What’s In Store After COVID Recovery?
Highlights
We believe:
- Economic gains have been front loaded in the first half of the year. As fiscal stimulus fades in the second half of the year, we believe the economy will continue growing, but at a slower annualized pace of 5%.
- We are mindful of the historic presidential cycle trends that suggest a large trading range heading into the mid-term elections.
- Inflation is front and center and the next couple of months will provide a lot of information on supply chain shortages and labor shortages. However, we believe that the inflation we are seeing now is more cyclical than structural.
- Credit has remained very resilient with positive economic momentum and accommodative monetary policy supporting risk appetites for credit.
- Most of the main risks we highlighted in our January Market Outlook are still present including excessive short-term investor sentiment, lofty equity market valuations, inflation, and potential tax hikes.
Revisiting Our January Market Outlook
In January’s Market Outlook we said, “Economic momentum, a rebound in earnings growth, and continued massive stimulus should support the equity markets, countering concerns over lofty valuations. Gains in the market could be front loaded as trends in the four-year presidential cycle suggest a consolidation in the second half of the year.”
The gains have certainly been front loaded, with the market surging beyond even our bullish year-end target. We are often asked if we would revise our target, but we don’t like playing that Wall Street game of raising targets when the market goes up and lowering targets when the market goes down. For example, last year during the crisis, Wall Street firms were slashing their targets. We held firm, and published commentary early on during COVID that showed how pandemics of the past have only had a temporary negative impact on the market.
We urged advisors and their clients to hold tight, while a record $700 billion flowed out of equity funds. We all know what happened next—the market surpassed our bullish outlook in 2020. In 2021, the market may again exceed our target, which is something we would all be happy about. We do expect the market to continue trading higher. However, we may also see a consolidation/larger trading range later in the second half of the year as we get past peak earnings growth, peak economic growth as the economy reopens, and as presidential election cycle trends begin to take hold.
GDP came in at 6.4% in the first quarter, and the Atlanta Fed’s GDPNOW forecast shows that GDP is tracking 9% for the second quarter. As fiscal stimulus fades in the second half of the year, we expect the economy to continue growing, but at a slower annualized pace of 5%.
Most of the main risks we highlighted in our January Market Outlook are still present, but they have not materially affected the markets. These risks include excessive short-term investor sentiment, lofty equity market valuations, inflation, and potential tax hikes. Fortunately, the U.S. has had a very effective vaccine rollout that has contributed to the economic reopening. We wish we could say the same globally, but in many countries, and especially in emerging markets, COVID is still leaving its mark.
Broadening Economic Trends
As shown in Figure 1 below, the markets have had a great run since the COVID lows and those gains have continued in 2021. Small-caps are leading the way with the Russell 2000 index up almost 130% and major U.S. indices higher by at least 90%. The U.S. has outpaced international equity markets and credit risk has been rewarded, while Treasuries have declined.
Figure 1. Time for a Pause?
| Domestic Equity | 2020 | 3/23/2020 – 5/31/2021 | YTD – 5/31/2021 |
|---|---|---|---|
| S&P 500 | 18.39% | 91.63% | 12.61% |
| Russell 1000 | 20.95% | 96.78% | 12.13% |
| Russell 2000 | 19.93% | 129.47% | 15.30% |
| Russell 3000 | 20.88% | 98.62% | 12.33% |
| Russell 1000 Value | 2.78% | 94.41% | 18.39% |
| Russell 1000 Growth | 38.49% | 96.61% | 6.31% |
| International Equity | 2020 | 3/23/2020 – 5/31/2021 | YTD – 5/31/2021 |
|---|---|---|---|
| MSCI Emerging Market | 18.31% | 83.94% | 6.09% |
| MSCI All Country World (ex US) | 10.65% | 82.15% | 9.75% |
| Fixed Income | 2020 | 3/23/2020 – 5/31/2021 | YTD – 5/31/2021 |
|---|---|---|---|
| BBgBarc U.S. Aggregate Bond | 7.51% | 3.97% | –2.29% |
| BBgBarc U.S. Treasury | 8.00% | –3.03% | –3.20% |
| BBgBarc U.S. Corporate | 9.89% | 18.55% | –2.85% |
| BBgBarc U.S. Corporate High Yield | 7.11% | 36.53% | 2.25% |
| BBgBarc Municipal | 5.21% | 14.79% | 0.78% |
Those trends have continued with economic reopening themes outperforming year to date. Large-cap value and small-caps are leading the way, outpacing growth and international equities. In fixed income, it’s been a difficult environment as rates have risen. High yield bonds have posted positive returns, boosted by lower duration and higher coupons. Meanwhile, Treasuries and investment grade corporate bonds have experienced losses year to date.
On a sector basis, economic reopening themes are clearly evident with Energy, Financials, Real Estate, Materials, and Industrials leading the way. Financials are benefiting from the steepening yield curve with short-term rates anchored near zero while intermediate and longer-term yields have risen. Meanwhile, last year’s winner, Technology, and defensive sectors, are lagging.
We have witnessed participation broadening out in the market. The NYSE Advance-Decline line is hitting new highs along with the major indices. That offers strong confirmation of this trend. Normally, market breadth deteriorates prior to major peaks and currently, market breadth is confirming the all-time highs. However, sentiment is stretched, which heightens the risk of a potential correction. Sentiment surveys and put/call ratios show complacency, but trends are positive, momentum is strong, credit remains well behaved, and there is plenty of monetary and fiscal support for the market. These factors have outweighed the sentiment concerns so far and have kept any short-term correction in check.
Figure 2. S&P 500 Cycle Composite for 2021

Figure 2 above shows the Ned Davis Research S&P 500 Cycle Composite for 2021 and actual trading year to date for the S&P 500. It combines the one-year cycle, the four-year cycle (election years), and decennial cycle (years ending in 0) into a single composite. We use the Cycle Composite as a guide to how the market may trade directionally throughout the year. So far year to date, it has been pretty accurate, calling for only modest pullbacks and higher highs through the first half of the year.
The Cycle Composite also highlights the potential for a correction and more challenging market conditions during the second half of the year. In our outlook in January, we said that “gains in the market could be front loaded” and that there was potential upside to our target before the Cycle Composite and presidential election trends took hold. What could be a catalyst for a more challenging market in the second half of the year? We believe that potentially moving past peak economic growth and reopening, peak earnings growth, rising inflation fears, and talk of tapering by the Fed could all pose challenges.
Value Finally Outpaces Growth
As mentioned earlier, we have seen the market trends broaden out, with cyclical and value sectors outperforming year to date. At this time last year, growth was outperforming value on a year-over-year basis by the biggest margin in history. We believed that this trend was unsustainable, and there was huge mean reversion potential for value to outperform. Well, we have now seen that come to fruition across market capitalizations with value finally outperforming growth. Value has now rebounded versus growth to the point where the year-over-year ratio is back to its mean.
The macro/fundamental backdrop of accelerating economic growth, strong earnings growth, and rising commodity prices tend to favor value over growth. These trends have favored cyclical value sectors such as Financials, Energy, Materials, and Industrials. When the market enters the next phase with more frequent and larger corrections, we believe that defensive value sectors such as Utilities, Consumer Staples, and Real Estate could benefit, providing a new catalyst for value to continue to outperform growth.
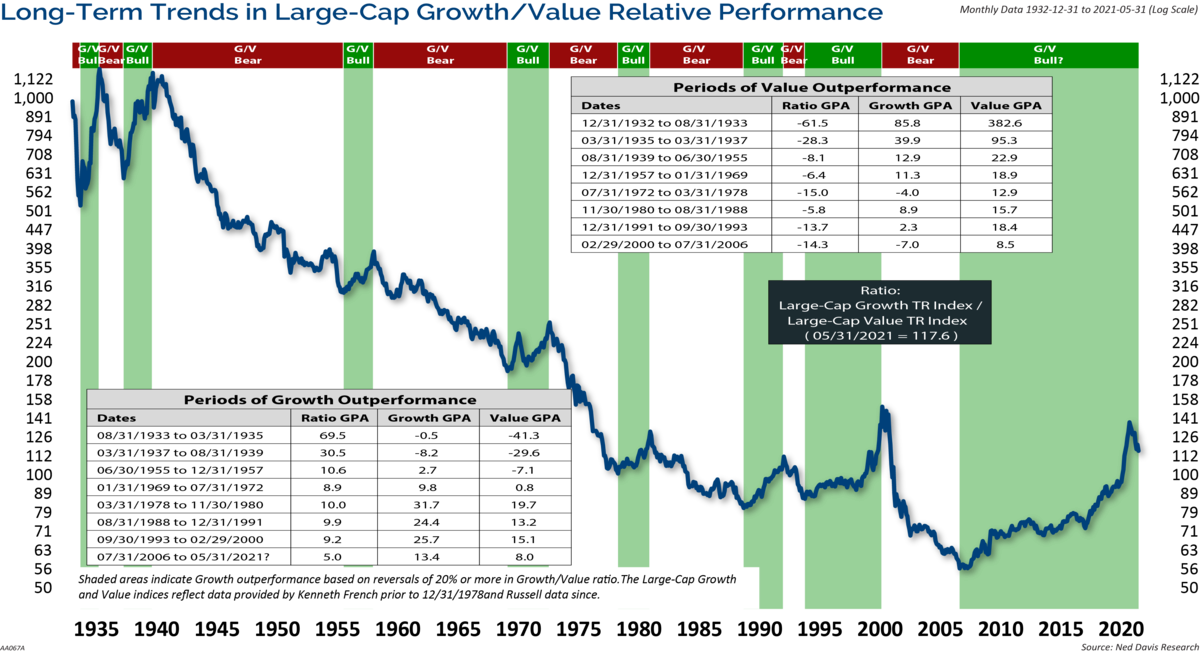
As shown in Figure 3 below, the mean reversion potential is not just a short-term, one-year issue. Growth has now outperformed value since 2006, a 14-year trend.
Figure 3. Growth Has Outperformed Value Since 2006
Valuations Remain Stretched
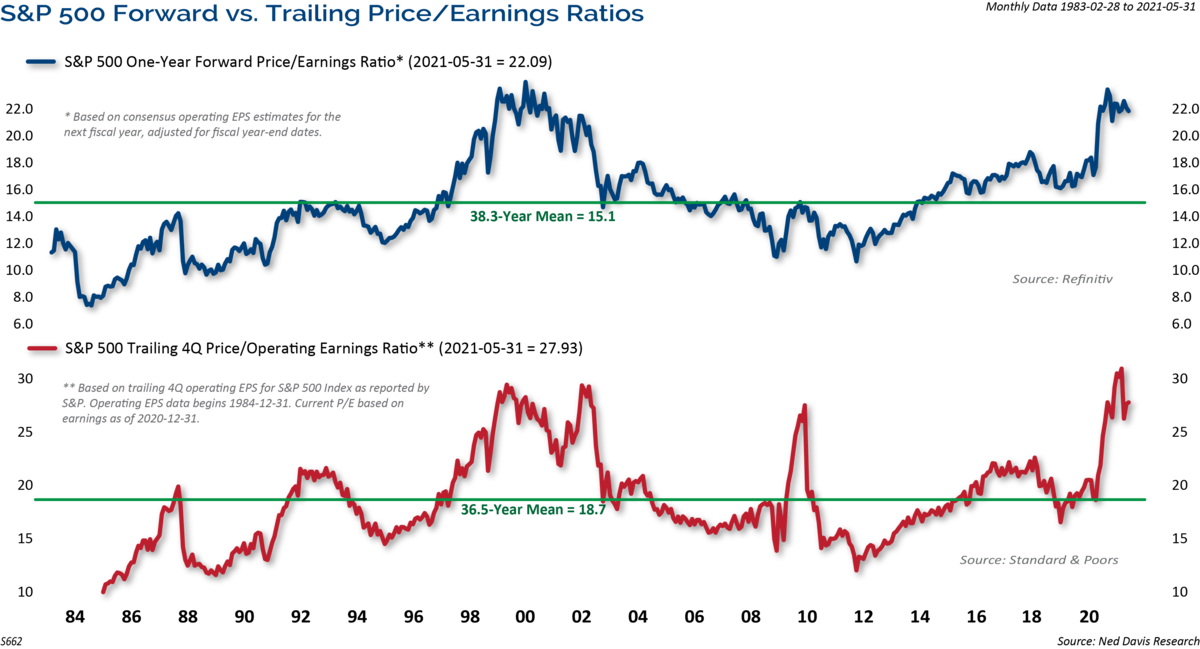
Valuations remain a concern. As shown in Figure 4 below, trailing and forward P/E ratios are near record highs. A saving grace of the valuation picture is that we have much lower rates and that the Fed is still more accommodative than in previous times of record valuations. For example, there is talk about valuations being similar to where they were in 1999. Sure, there are similarities, but in 1999 the 10-year Treasury yield was 6.5% and the Fed was hiking rates. Today, the 10-year yield is 1.5% and the Fed has not hiked rates yet.
FIgure 4. Trailing and Forward P/E Ratios are Near Record Highs
The valuation picture suggests that the overall stock market will be driven by earnings, which should continue to grow at a solid pace, but slower than we have seen so far during the recovery. At the beginning of the year, consensus estimates for 2021 earnings were for 36.7% growth. At the time, that seemed overly optimistic. However, estimates have only continued higher, and consensus is now calling for 52% earnings growth for calendar year 2021. This is the largest upward revision to S&P 500 consensus estimates on record. Realized and expected earnings growth have been a supporting factor for the market in the face of record valuations. One risk we do see is that peak earnings growth likely occurred in the first quarter, with more difficult year-over-year comparisons over the next 12-18 months. We believe that earnings will still grow, but at a slower pace.
By the time strong earnings growth has been reported, much of the good news has already been priced in. Very high earnings growth is unsustainable, and when earnings growth is high and slowing, the market has posted below average gains. By the second half of 2021, year-over-year earnings growth could be well into the zone where market gains have been below average.
Figure 5. Market Trends During the Four-Year Presidential Cycle

Election Year Trends
The chart in Figure 5 shows the historical trends of the market during the four years of the presidential cycle, dating back to the early 1900s. We are currently in the first year of the term and next year, 2022, is the mid-term election year.
What we find interesting is the horizontal shaded zone from about the middle of the first year of the term into mid-term elections. The market normally trades in a wide range, with the potential for decent corrections leading up to the mid-term elections. Will history repeat itself this time? It makes sense to think that the market will enter a period of consolidation after the massive rebound, combined with an overvalued market, peak earnings growth, peak economic growth, and the completion of the economic re-opening later this year.
We have studied every mid-term election year since 1934. History shows that the market has endured a 21% correction on average into the mid-term election year lows. The silver lining to this is that the market has also historically rebounded very strongly from those mid-term lows into a high the very next year. The average gain from the mid-term low to the high point in the following year is 47%. Naturally, the years accompanied by a recession have had steeper declines, 31% on average, than those with continued economic growth, 17% on average. As mentioned earlier, our base case is that the economy continues to grow, but at a slower pace, so if we do experience the normal mid-term election correction, we would expect it to be of the milder variety.
Figure 6. Yields Are Well Contained For Now

Credit Remains Resilient
As shown in Figure 6 above, the 10-year Treasury yield rose from an all-time low of 0.50% in March 2020 to a recent high of 1.77%. That was a steep rise in anticipation of the economy reopening after the COVID crisis. Yields have since contacted from 1.77% to 1.5% today.
Ironically, yields contract when the Fed stops Quantitative Easing, so the latest contraction may be in anticipation of some change in language from the Federal Reserve, but that is getting a few steps ahead at this point. For now, yields remain well contained within a trading range. Given the inflation concerns, we still believe the path of least resistance for yields may be higher. However, if yields break lower from here, that would signal to us that the bond market is discounting disappointing economic growth and less inflation to come.
It is a little surprising to many that yields have not risen more given the inflation concerns. There are several factors that could be contributing to this, including the fact that there is just too much money that has to go somewhere; this could be overwhelming the bond market. Or the bond market may be siding with the Fed that inflation is transitory, and bond yields and inflation are not as highly correlated as many think. In addition, pension funds have hit record funding levels with the rebound in the market. We are also seeing pensions rebalancing into more fixed income to match future liabilities.
Credit has remained very resilient in the face of rising interest rates. The steady grind lower in corporate credit spreads has continued virtually unabated since the COVID lows. The positive economic momentum and accommodative stance of monetary policy have supported risk appetites for credit. As such, high yield bonds have been a bright spot of performance in fixed income this year with the Bloomberg Barclays High Yield Index up 2.25% through May. Lower credit quality bonds are outperforming with CCC and below up 6.83% and BB up only 1.15%
Spreads have come in dramatically across both high yield and investment grade corporate bonds. Even so, the 245 basis points spread of high yield over Treasuries is still attractive compared to the 50 basis points spread of investment grade bonds over Treasuries.
The credit backdrop remains fairly benign. New issuance of corporate debt is up and on pace for another record year and the market is absorbing it. We are still in the economic recovery phase and in an environment of strong earnings growth, low default rates, upward rating changes, and tighter spreads.
Inflation or Reflation?
Inflation is here, as expected. The recent CPI reports surprised to the upside. The spikes were driven by a mix of temporary shortages, a huge increase in used car prices which is not sustainable, supply chain disruptions, and reopening rebounds in travel prices. These forces might generate high inflation prints in coming months too, but they are unlikely to last beyond this year.
We liken it more to reflation as the economy continues to reopen. The base effect should diminish over the next few months, providing a better handle on the underlying trend of inflation. Core Personal Consumption Expenditures (PCE), the Fed’s preferred inflation measure, has surged at the fastest pace in nearly three decades. We will likely continue seeing 3-4% year-over-year inflation prints through the summer and into year-end, and then settle down to 2.0%-2.5% after. If we see building wage pressures, then inflation would be stickier. It will be interesting to see over the next couple of months what happens to employment and labor costs. So far, 25 states have prematurely ended providing enhanced federal unemployment aid, which provided an extra $300 a week on top of regular state unemployment benefits. The supplemental benefit is slated to expire in early September. Will that help draw people back into the labor market? It’s hard for many businesses to compete for labor when unemployment benefits amount to about $32,000 annually.
At this point, we believe that the inflation we are seeing will be more cyclical than structural. In our opinion, there are several factors working against long-term inflation. In the short-term, productivity rebounds in recoveries, and the restoration of supply chains as more economies open up will ease pricing pressures. Structurally, the massive debt overhang and deteriorating demographics are deflationary, suggesting lower inflation down the road. In addition, in the worst year for the economy on record, businesses increased their spending on equipment and software by 7%, even as labor costs were shed by 4.5%, to the point where automation as a share of GDP has risen to an all-time high. This boom in productivity is deflationary over the longer-term.
We have looked at inflation over the decades and what we find is that stocks can do well in inflationary times. The only decades where stocks have returned negative total returns were during the 1930s, when there was deflation, and the 2000s, which saw modest inflation. Both periods were during secular bear markets.
Figure 7. High Yield Provides Shelter During Periods of Rising Rates
| Rising Rate Periods | 10-Year Treasury Rate Increase (bps)* | Bloomberg Barclays 7-10 Year U.S. Treasuries** | Bloomberg Barclays U.S. Corporate Investment Grade*** | Bloomberg Barclays U.S. Corporate High Yield |
|---|---|---|---|---|
| 8/4/2020 – 03/31/2021 | 122 | –7.38% | –3.26% | 7.04% |
| 09/07/2017 – 11/08/2018 | 119 | –5.29% | –2.73% | 2.78% |
| 07/05/2016 – 03/13/2017 | 125 | –7.01% | –2.10% | 8.73% |
| 07/25/2012 – 12/31/2013 | 161 | –7.03% | 0.53% | 14.71% |
| 10/06/2010 – 04/08/2011 | 118 | –5.72% | –1.21% | 7.28% |
| 12/18/2008 – 12/31/2009 | 177 | –6.42% | 21.05% | 73.30% |
| 06/02/2005 – 06/28/2006 | 136 | –4.28% | –2.72% | 5.49% |
| 10/05/1998 – 01/20/2000 | 263 | –8.11% | –3.02% | 3.77% |
| 01/18/1996 – 07/05/1996 | 153 | –5.29% | –4.19% | 2.78% |
| 10/15/1993 – 11/07/1994 | 286 | –7.01% | –8.11% | 8.73% |
In addition to looking at inflationary periods, we thought it is important to illustrate how various credit markets have historically performed during periods of rising interest rates, as measured by the 10-year Treasury yield. As shown in the table above in Figure 7, over the past almost 30 years, there have been ten instances where yields rose by 100 basis points or more. In each case, U.S. Treasuries declined, in all but two periods investment grade corporate bonds declined, and high yield bonds advanced in each of those instances. We believe this underscores the need to be tactical and active in fixed income during periods of rising interest rates, and the need to actively manage duration and credit risk.
The Fed: Serving Up the Punch
The Federal Reserve has said that they will continue to target low rates as a mechanism to create sustainable inflation. This means that inflation increases in the short term will be ignored until it is “sustainable.” We do not think the Fed will blink.
It’s important to remember that the Fed’s forward guidance has three parts:
(1) Maximum employment (broadly and vaguely defined)
(2) Realized inflation at 2%
(3) Projected inflation above 2%
Given that the Fed has stressed it wants to see employment back to where it was pre-COVID, we think the Fed still has a long way to go before taking their foot of the gas pedal. The saying used to be that the Fed would take the punch bowl away just as the party was getting going. Now, they are the bartender serving up the punch.
Figure 8. Fed’s Balance Sheet Has Soared During COVID
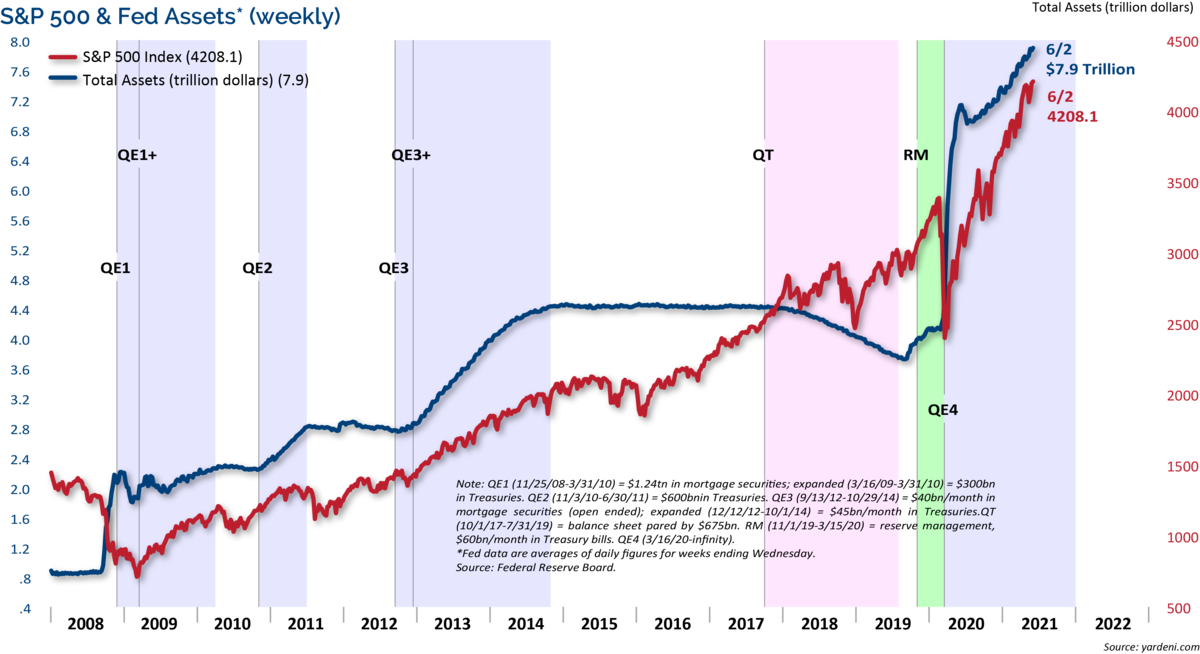
As shown in Figure 8, the Fed’s balance sheet has surged by almost $4 trillion since the beginning of COVID. Our best forecast for tapering bond purchases is sometime in 2022. We would look toward the Fed’s Jackson Hole meeting in August for guidance on tapering.
There is a lot of speculation about tapering. All tapering means is slowing the pace of asset purchases. This is all relatively new and the only other time the Fed began tapering was in 2014. The market really didn’t run into trouble until 2018 when the Fed messaged continued tapering and a series of additional rate hikes. We don’t think that the Fed will make the same mistake this time. So even if the Fed begins tapering next year, we believe the market could handle it in stride.
Debt levels have also soared to record highs with the massive stimulus packages enacted to sure up the economy and provide social relief for so many affected by the pandemic. While necessary to bridge the economic gap, it may have had significant longer-term economic implications. History shows that as the amount of debt as a % of GDP has risen over time, the rate of growth in inflation, GDP, productivity, and payrolls have all declined. Debt crowds out today’s savings, which are tomorrow’s investments as it takes resources away from productive economic uses. While the debt may be politically popular and socially necessary, it will weaken growth and inflation after the initial spurt.
Conclusion
We are still in the secular bull market that began after the Credit Crisis. The fact that the COVID recession and stock market decline was so short lived, combined with the fact that the rebound has taken the major indices to new highs, suggests that the secular bull market is intact.
In conclusion, risk assets have performed very well through the first half of the year. We expected the market and economic gains to be front loaded, and they certainly have been. We believe the economy and markets have more room to advance given the accommodative stance of the Fed and economic re-opening. As we get further into the second half of the year, we could see some volatility as we pass peak earnings growth, peak economic growth, and the economic re-opening is largely completed.
In addition, we are mindful of the historic presidential cycle trends that suggest a large trading range into the mid-term elections. Inflation is front and center and the next couple of months will provide a lot of information on supply chain shortages and labor shortages. We expect that the inflation we are seeing now is more cyclical than structural. As always, we believe that clients should be focused on their long-term goals and objectives, and not be derailed by short-term swings in the markets.
Eager for More Insights? Visit our 2021 Mid-Year Market Outlook Resource Center.
The views expressed are those of the author(s) and do not necessarily reflect the views of Clark Capital Management Group. The opinions referenced are as of the date of publication and are subject to change due to changes in the market or economic conditions and may not necessarily come to pass. There is no guarantee of the future performance of any Clark Capital investments portfolio. Material presented has been derived from sources considered to be reliable, but the accuracy and completeness cannot be guaranteed. Nothing herein should be construed as a solicitation, recommendation or an offer to buy, sell or hold any securities, other investments or to adopt any investment strategy or strategies. For educational use only. This information is not intended to serve as investment advice. This material is not intended to be relied upon as a forecast or research. Past performance does not guarantee future results.
The S&P 500 measures the performance of the 500 leading companies in leading industries of the U.S. economy, capturing 75% of U.S. equities.
The 10-year Treasury note is a debt obligation issued by the United States government with a maturity of 10 years upon initial issuance. A 10-year Treasury note pays interest at a fixed rate once every six months and pays the face value to the holder at maturity.
The Dow Jones Industrial Average is the most widely used indicator of the overall condition of the stock market, a price-weighted average of 30 actively traded blue chip stocks, primarily industrials. The 30 stocks are chosen by the editors of the Wall Street Journal (which is published by Dow Jones & Company), a practice that dates back to the beginning of the century. The Dow is computed using a price-weighted indexing system, rather than the more common market cap-weighted indexing system.
NDR (Ned Daily Research) Daily Trading Sentiment Index is based on the S&P 500 Daily Sentiment Index which shows a short-term sentiment view of the S&P 500 Index.
Non-investment-grade debt securities (high-yield/junk bonds) may be subject to greater market fluctuations, risk of default or loss of income and principal than higher-rated securities.
This document may contain certain information that constitutes forward-looking statements which can be identified by the use of forward-looking terminology such as “may,” “expect,” “will,” “hope,” “forecast,” “intend,” “target,” “believe,” and/or comparable terminology (or the negative thereof). Forward looking statements cannot be guaranteed. No assurance, representation, or warranty is made by any person that any of Clark Capital’s assumptions, expectations, objectives, and/or goals will be achieved. Nothing contained in this document may be relied upon as a guarantee, promise, assurance, or representation as to the future.
The volatility (beta) of a client’s portfolio may be greater or less than its respective benchmark. It is not possible to invest in these indices.
Index returns include the reinvestment of income and dividends. The returns for these unmanaged indexes do not include any transaction costs, management fees or other costs. It is not possible to make an investment directly in any index.
The price-to-earnings ratio (P/E ratio) is the ratio for valuing a company that measures its current share price relative to its per-share earnings (EPS). The price-to-earnings ratio is also sometimes known as the price multiple or the earnings multiple.
Russell 1000 Index measures the performance of the 1,000 largest companies in the Russell 3000 Index, which represents approximately 92% of the total market capitalization of the Russell 3000 Index.
The Russell 2000 Index measures the performance of the 2000 smallest U.S. companies based on total market capitalization in the Russell 3000, which represents approximately 11% of Russell 3000 total market capitalization.
Russell 1000 Growth Index measures the performance of those Russell 1000 companies with higher price-to-book ratios and higher forecasted growth values.
Russell 1000 Value Index refers to a composite of large and mid-cap companies located in the United States that also exhibit a value probability.
The Russell 3000 Index measures the performance of the 3 000 largest US companies based on total market capitalization, which represents approximately 98 of the investable U.S. equity market.
The MSCI Emerging Markets is an index used to measure equity market performance in global emerging markets
The MSCI All Country World is a market capitalization weighted index designed to provide a broad measure of equity-market performance throughout the world.
The Bloomberg Barclays US Aggregate Bond Index is a broad-based flagship benchmark that measures the investment grade, US dollar-denominated, fixed-rate taxable bond market. The index includes Treasuries, government-related and corporate securities, MBS (agency fixed-rate pass-throughs), ABS and CMBS (agency and non-agency).
The Bloomberg Barclays US Treasury Index measures US dollar-denominated,fixed-rate, nominal debt issued by the U.S. Treasury.
The Bloomberg Barclays US Corporate Bond Index measures the investment grade, fixed-rate, taxable corporate bond market. It includes USD-denominated securities publicly issued by US and non-US industrial, utility and financial issuers.
The Bloomberg Barclays U.S. Corporate High-Yield Index covers the U.S. dollar-denominated, non-investment grade, fixed-rate, taxable corporate bond market. Securities are classified as high-yield if the middle rating of Moody’s, Fitch, and S&P is Ba1/BB+/BB+ or below.
The Bloomberg Barclays U.S. Municipal Index covers the USD-denominated long-term tax exempt bond market. The index has four main sectors: state and local general obligation bonds, revenue bonds, insured bonds and prerefunded bonds.
Clark Capital Management Group, Inc. is an investment adviser registered with the U.S. Securities and Exchange Commission. Registration does not imply a certain level of skill or training. More information about Clark Capital’s advisory services and fees can be found in its Form ADV which is available upon request. CCM-672
![]()