Navigating the Year Ahead
Highlights
We believe:
- The secular bull market should continue in 2022. Our S&P 500 target is 5200 and is driven by continued economic growth/re-opening and earnings growth.
- Mid-term election year trends suggest a choppy first half of the year with a heightened risk of a 10-15% correction, followed by a strong second half recovery to new highs.
- Tailwinds will continue from economic re-opening, unprecedented monetary stimulus, inventory rebuilding, pent up demand for spending, and a surge in consumer net worth.
- Inflation should moderate from 30-year highs in the second half of year as supply chains ease and COVID recedes.
- The Federal Reserve should end its tapering by March, and will follow with a series of rate hikes. We believe there will be three rate hikes in 2022, although the market is pricing in four.
- The 10-year Treasury Note will end the year near 2.0%, but it could trade up to 2.25% – 2.50% in the interim. We anticipate another year of outperformance for credit over duration.
- Risks to the outlook include additional COVID variants, equity market valuations, Fed policy mistakes, inflation pressures, geopolitical risks (China, Russia), and U.S. mid-term elections.
Heck of a Run
In last year’s Market Outlook, we quoted the song titled, “1921” by The Who, which says, “Got a feeling ’21 is going to be a good year, especially if you and me see it in together.” We expected a good year in 2021, and that certainly panned out for the markets and the economy. However, it was not such a good year for the pandemic, with more deaths in 2021 than in 2020 and new cases now surging higher from the Omicron variant. Notwithstanding the human toll, 2021 was a great year for the markets.
Figure 1. Equity Markets: A Remarkable Recovery Since March 2020
| Domestic Equity | 2020 | 2021 | 3/23/2020 – 12/31/21 |
|---|---|---|---|
| S&P 500 | 18.39% | 28.68% | 118.97% |
| Russell 1000 | 20.95% | 26.43% | 121.86% |
| Russell 2000 | 19.93% | 14.78% | 128.45% |
| Russell 3000 | 20.88% | 25.64% | 122.15% |
| Russell 1000 Value | 2.78% | 25.12% | 105.46% |
| Russell 1000 Growth | 38.49% | 27.59% | 135.96% |
| International Equity | 2020 | 2021 | 3/23/2020 – 12/31/21 |
|---|---|---|---|
| MSCI Emerging Market | 18.31% | -2.54% | 69.06% |
| MSCI All Country World (ex US) | 10.65% | 7.82% | 78.94% |
| Fixed Income | 2020 | 2021 | 3/23/2020 – 12/31/21 |
|---|---|---|---|
| BBgBarc U.S. Aggregate Bond | 7.51% | -1.54% | 4.76% |
| BBgBarc U.S. Treasury | 8.00% | -2.32% | -2.15% |
| BBgBarc U.S. Corporate | 9.89% | -1.04% | 20.76% |
| BBgBarc U.S. Corporate High Yield | 7.11% | 5.28% | 40.57% |
| BBgBarc Municipal | 5.21% | 1.52% | 15.62% |
Risk assets surged, with the S&P 500 gaining 28.68% and notching 70 record highs along the way. As shown in Figure 1 above, the S&P rose more than 10% for a third consecutive year for the first time since 2012-2014 and all 11 S&P 500 sectors posted double-digit returns for the first time since 1995. Market tailwinds included unprecedented monetary stimulus, economic re-opening, and earnings growth of about 65%. U.S. equities handily outperformed international stocks in 2021 and in 8 of the past 10 years.
It has been a remarkable recovery in the equity markets since the pandemic led declines in early 2020. The major U.S. indices have advanced by as much as 135%, which is much more than their international counterparts.
Fixed income suffered through a difficult year as the economy recovered, inflation surged to its highest level in 30 years, and interest rates rose. The Bloomberg Barclays U.S. Aggregate Bond Index suffered its fourth loss ever, declining by 1.54%. Treasuries declined even more as rates across the curve rose. On the other hand, credit performed well throughout the year, with high yield bonds advancing 5.28%.
A Transition Year
As we look toward 2022 and ponder what the year will hold for the markets and the economy, we think we are transitioning from a year of recovery in 2021 to a year of headwinds and mean reversion in 2022. We see 2022 continuing many of the trends that propelled the markets to new highs last year, such as continued economic and earnings growth, but at a much slower pace. We think there will be four dominant themes throughout 2022: COVID variants and the government response and economic impact, inflation, Fed policy, and the mid-term elections.
Our expectations call for a target of 5200 on the S&P 500, aided by stronger than expected earnings growth (12% versus 9% consensus expectations) and continued economic expansion. 2022 is also a mid-term election year and history suggests a choppy first half of the year followed by a second half recovery. As a result, we expect to see more volatility in 2022 than last year, with the potential for a 10-15% correction in the first half of the year.
We believe economic growth will remain above trend, but not at the torrid pace we have seen since the Covid collapse. We expect the U.S. economy to grow at a pace of between 3.5% – 4.0% real economic growth with tailwinds from continued economic reopening, unprecedented monetary stimulus, and inventory rebuilding. Inflation is here and is going to remain elevated from the trend of the past 30 years. It is simply a matter of too much money chasing too few goods and services as well as too little labor. We do expect inflation to moderate to 3.5% year over year in the second half of the year as COVID fears dissipate and supply chains improve.
The Federal Reserve is set to end tapering in the first quarter and begin hiking rates shortly thereafter. The market is currently pricing in four rate hikes; however, we don’t expect the Fed to act as aggressively as is priced into the markets. When the Fed hikes at a measured pace, the market has historically performed well in the 12 months after the first rate hike. Yields will rise and we expect the 10-year Treasury Note yield to end the year near 2.0%, but it could trade as high as 2.25% – 2.5% during the year.
There are a lot of risks to the outlook, including but not limited to, additional COVID variants, lofty valuations, the potential for a Fed policy error, the mid-term elections in November, and geopolitical risks with China and Russia.
A Wider Range of Outcomes
Let’s take a look at the economy. As shown in Figure 2 below, total economic output has surged, and by the end of the first quarter in 2021, the economy recovered all the losses from the COVID swoon. Going into the New Year, we believe the U.S. economy still has a tailwind with strong momentum. Economically speaking though, 2022 may have a wider range of potential outcomes than normal given the many uncertainties that are present including: COVID variants, the government’s response to the virus, inflation, and changing Federal Reserve policy.
Figure 2. GDP Surge Shows Post-COVID Rebound
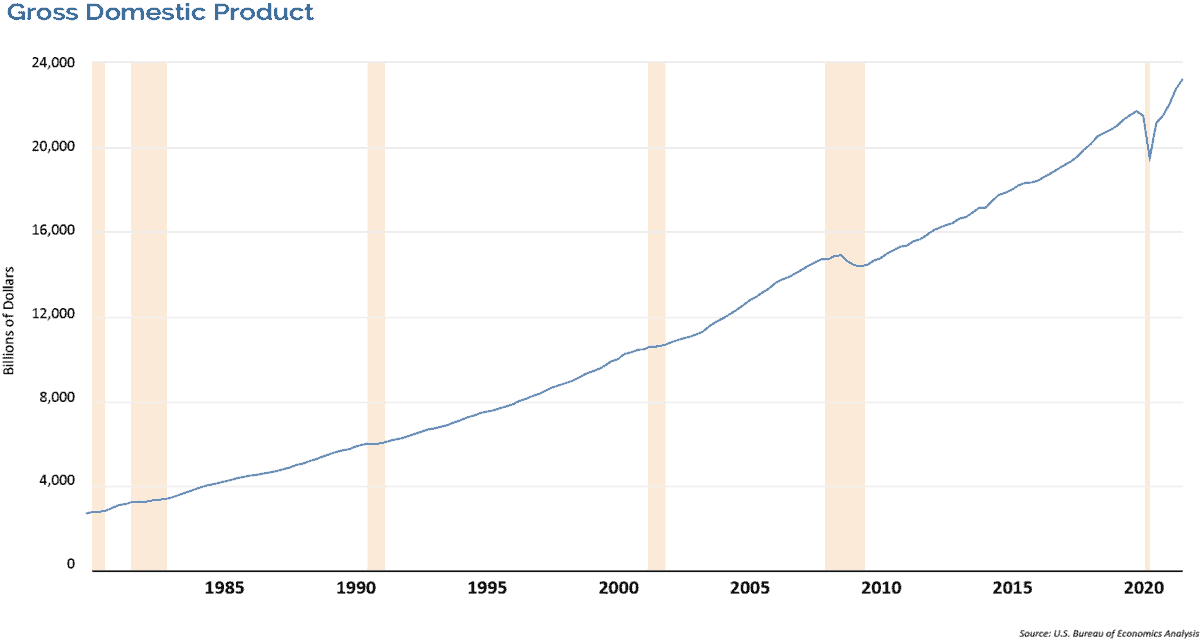
Omicron is likely to take a small bite out of growth early on, but we still expect the U.S. economy to grow at an above-trend pace and advance at a 3.5% – 4.0% real annualized rate for the calendar year 2022, which is down from an expected 5.25% average annual growth rate in 2021. While there are many potential headwinds facing the markets in 2022, we believe there are even more positive factors that will contribute to economic growth. These include the lagged impact of unprecedented monetary stimulus, receding supply chain issues, continued economic re-opening, the surge in consumer net worth, and inventory rebuilding.
One of the most reliable predictors of an impending recession is the U.S. Treasury yield curve and specifically, the spread of yield between 2-year and 10-year Notes. Just about every inversion of the yield curve has been followed by a recession, and no recession since at least the mid-1970s has occurred without an inversion of the yield curve beforehand. While the curve has flattened considerably since March 2021, it still hasn’t inverted, suggesting that outside of a major policy error by the Fed, or an exogenous shock, a recession in the near-term is unlikely.
John Maynard Keynes wrote that, “On average, the rate of change of the money supply has reached its peak nearly 16 months before the peak in general business.” Monetary policy works with big lags. Over the past two years, the M2 money supply aggregate in the U.S has surged by a record 42%. Since monetary policy works with long lags, the explosive growth in M2 over the past two years increases the odds that nominal GDP growth surprises to the upside in 2022, inflation remains on the front burner, and corporate profits grow at double-digit rates.
As such, even though the Fed is shifting policy to end its bond purchase program and will begin hiking rates soon after, the economy will still be feeling the effects of easy policy well into the future. Therefore, we believe the labor market will remain tight. Unemployment claims are already at 50-year lows and suggest the unemployment rate will continue trending down into the low 3% range. Given the persistently low participation rate, we expect the unemployment rate to fall below its low point of 3.5% it hit in 2019.
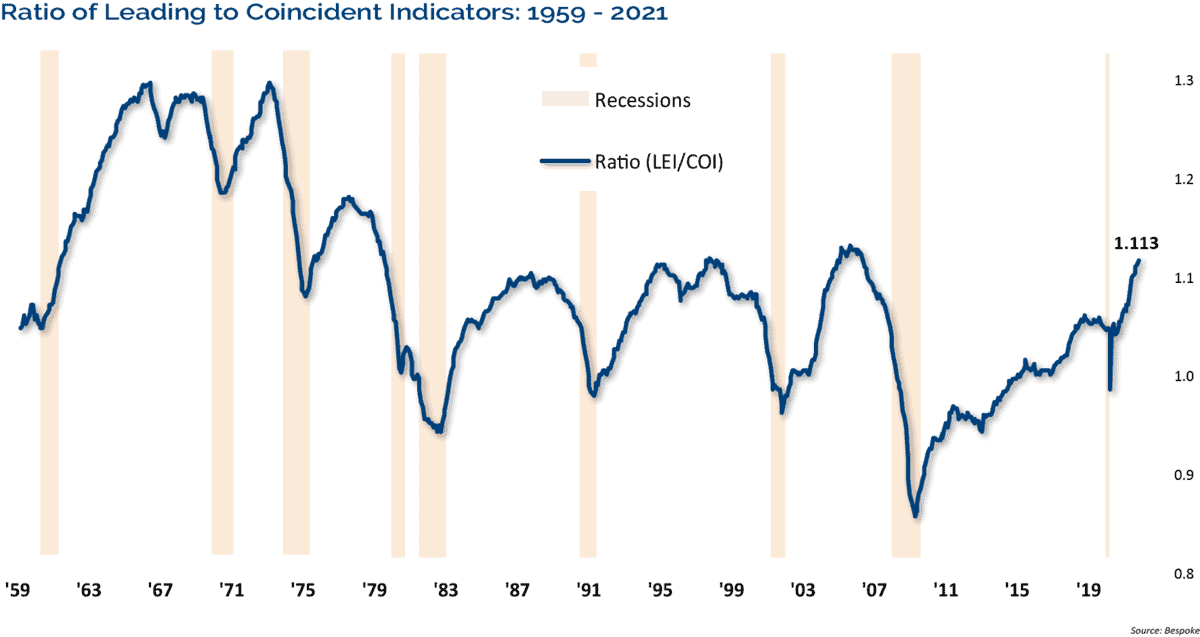
We believe the economy has more runway to continue expanding given its strong momentum, low interest rates, supportive monetary policy, pent up demand, and the need to replenish depleted inventories. An indicator we like to follow that is giving the all-clear signal for the economy is the ratio of leading to coincident indicators. Leading indicators tend to roll over well in advance of a recession and give plenty of forewarning of economic trouble. As shown in Figure 3 below, the ratio is currently at cycle highs, indicating continued strength for the U.S. economy.
Figure 3. Ratio of Leading to Coincident Indicators Signals Continued Economic Strength
In addition, the housing market has been a pillar of strength for the economy as rising housing prices and sales have added to consumer net wealth. This trend looks to continue as housing starts recently made cycle highs and hit their highest level since 2007.
The Pandemic Continues On
On January 3rd, more than 1 million people in the U.S. were diagnosed with COVID. The massive number of infections is likely severely underrepresented due to the lack of testing available and the fact that many people rely on at-home tests that are not reported to official government authorities. Currently, the CDC estimates that Omicron now accounts for 95% of new COVID infections. The good news is that the Omicron variant appears to be less virulent than other mutations, leading to fewer instances of severe infections, hospitalization, and death. Many health officials are also predicting that Omicron will result in herd immunity.
Still, the economic impact of Omicron is being felt as flights are being canceled, schools are going back to virtual, hospitals are experiencing a surge in cases, supply chains are being challenged due to a lack of workers, and return to work policies are being delayed.
FIgure 4. Each Wave of COVID Has Less Economic Impact
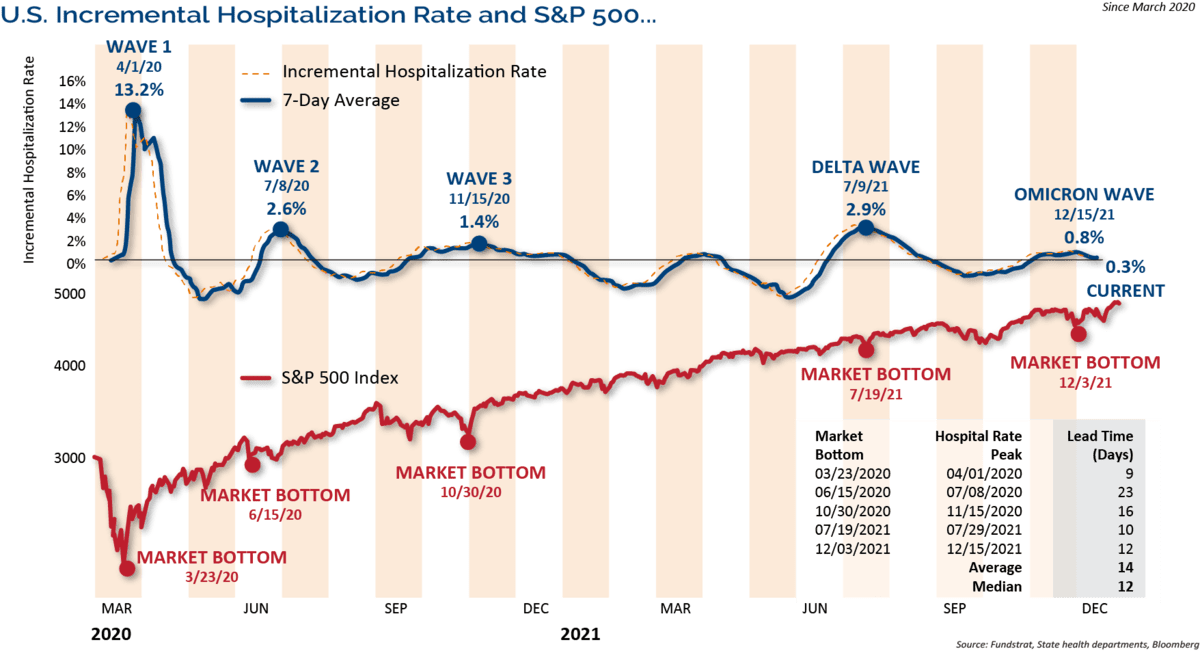
What we want to highlight here is that each wave of COVID has had less economic impact, and the market recognizes that. The chart in Figure 4 above shows the incremental hospitalization rate, which is the utilization of hospital resources for a given level of cases, along with the S&P 500. The incremental hospitalization rate seems to have peaked well below prior waves, and consistent with prior waves, the S&P 500’s mid-December low was also in advance of this recent peak.
The Return of Investor Pessimism
Extremes in investor sentiment are normally contrarian indicators, with optimistic sentiment leading to corrections or pullbacks, and pessimistic extremes leading to rebounds.
Investor sentiment has gotten whipped around recently, and has surprisingly turned quite pessimistic with only small drawdowns in the market. 2021 was one of the least volatile years on record. There were only three minor corrections in the S&P 500, with declines of 4.13% in March, 5.12% in October, and 4.03% in December. Each one of those small declines saw investors turn overly pessimistic.
Ned Davis Research’s Trading Sentiment Composite hit a pessimistic extreme most recently in mid-December, setting up the year-end rally. In addition, individual investors, as measured by the American Association of Individual Investor sentiment poll, showed a level of bearishness that was in the 90th percentile of all readings in its history. It’s no surprise that sentiment turned pessimistic given the Fed’s messaging of rate hikes, high inflation, and the surge in COVID cases. It is often said that bull markets “climb a wall of worry,” and that has been the case with this bull market since the COVID lows.
The Impact of Rate Hikes
We know the Federal Reserve is going to hike rates several times this year. However, credit conditions remain firm, despite the Fed telegraphing their intentions on tapering and subsequent rate hikes. Historically, the first rate hike is not bearish for equities, but quality and profitability start to replace leverage and beta as desirable attributes, and we expect 2022 to exemplify these historical characteristics.
Figure 5. Stocks Have Historically Done Well After the First Year of Slow Rate Tightening Cycles
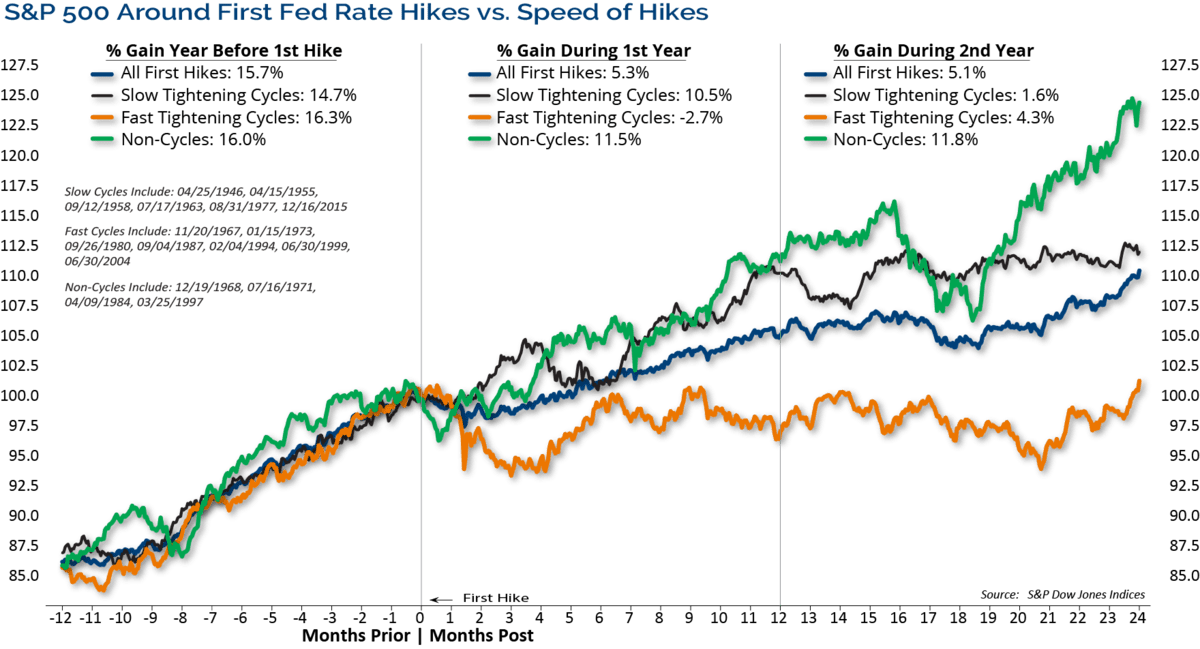
As shown in Figure 5 above, stocks have historically digested the first year of slow rate tightening cycles well (waiting at least one meeting in between hikes, on average) with the S&P 500 rising an average of 10.5%. During the first year of fast tightening cycles (hikes at most meetings), however, the S&P 500 fell 2.7%, on average.
Mid-Term Election Year Trends
The chart below in Figure 6 shows the Ned Davis Research S&P 500 Cycle Composite for 2022. It combines the one-year cycle, four-year cycle (election years), and decennial cycle into a single composite. We use the Cycle Composite as a guide to how the market may trade directionally in the upcoming year. It has had a very good track record in previous years.
Figure 6. Cycle Composite Suggests a Weak First Half Followed by a Strong Rebound
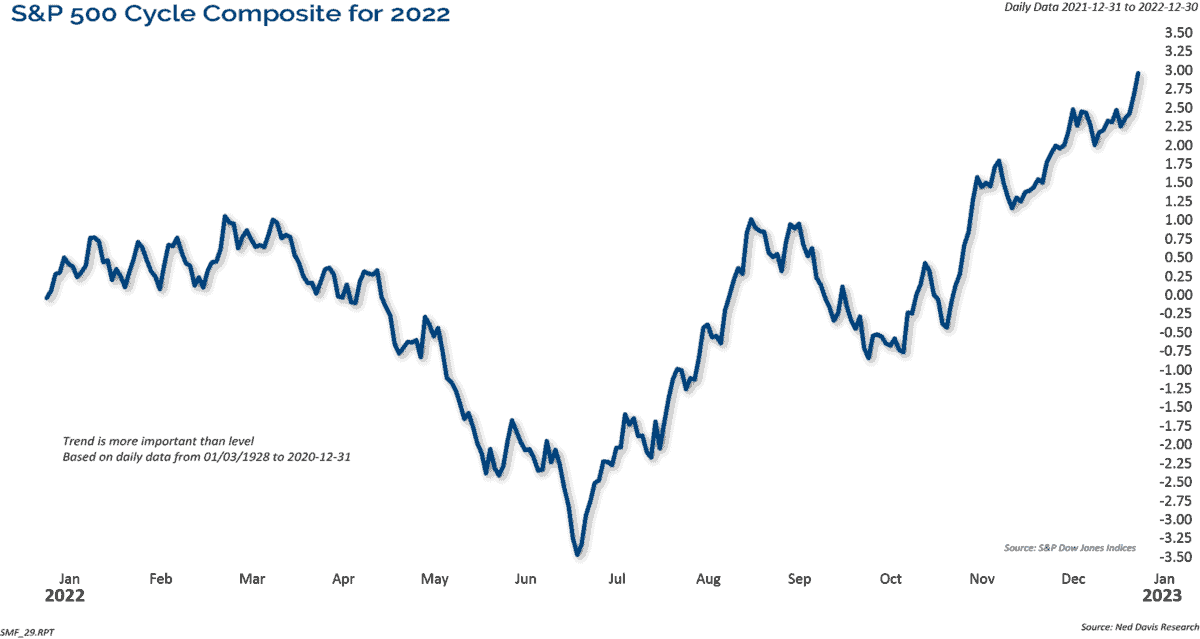
The Cycle Composite for 2022 suggests a weak first half of the year followed by a strong rebound in the second half. The Cycle Composite is aligned with the normal mid-term election year trends, which also suggest a weak first half, followed by a strong rebound in the second half of the year.
The chart in Figure 7 below graphically shows the historical trend of the market during the four years of the Presidential Cycle, dating back to the early 1900s. We are currently in the second year of the term, which is the mid-term election year. The second year of the President’s term has been mediocre for the equity markets. In the post-WWII era (since 1948), the mid-term election year has posted an average price gain of 6.0%, which is the smallest average gain for the S&P 500 of all four years of the term. Our target for year-end is 5200, which would be a 9% price advance, and when adding in dividends, it would represent a total return of about 10.5%.
Figure 7. Mid-Term Election Years Post Modest Gains
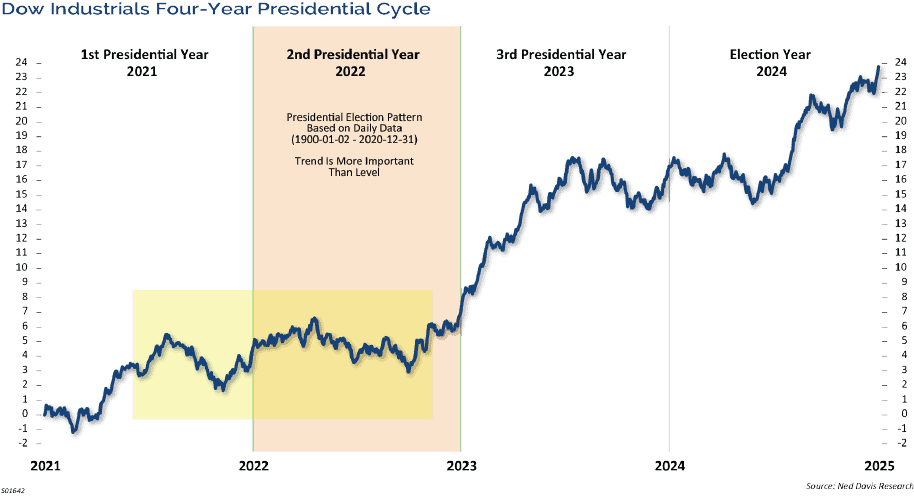
The horizontal shaded zone from about the middle of the first year of the term into mid-term elections shows historically that the market normally trades in a sideways consolidation. The market normally trades in a wide range with the potential for decent corrections leading up to the mid-term election. Part of the rationale for this pattern is that government stimulus follows the presidential cycle. Stimulus normally picks up prior to the mid-term elections as the party in power tries to maintain its status, with that stimulus continuing through the general election year.
History shows that the market has endured a 21% correction on average into the mid-term election year lows. The silver lining to this is that the market has also historically rebounded very strongly from those mid-term lows into a high the very next year. The average gain from the mid-term low to the high point in the following year is 47%. Naturally, the years accompanied by a recession have had steeper declines, 31% on average, than those with continued economic growth, 17% on average. As we have mentioned earlier, our base case is that the economy continues to grow, at a slower pace, so if we do get the normal mid-term election correction, we would expect it to be of the milder variety.
In addition, since 1938, there have been 9 mid-term election years that had Democrats controlling the White House, the Senate, and the House of Representatives as they do today. In those years, the average returns were a 4.5% loss in the first half of the year followed by a 13.5% gain in the second half.
Adjusting Earnings Expectations
Coming into 2021, the price-to-earnings ratio (P/E) for the S&P 500 was a lofty 30.67. We highlighted the extreme valuations as a risk, but expected the multiple to contract given strong expected earnings growth. Stocks did very well last year, but earnings boomed even more. As shown in Figure 8 below, this brought P/E ratios down, but nevertheless, the S&P 500 ended the year trading at 23.6 times earnings. Given our expectations of 12% earnings growth, we could see marginal compression again this year.
Figure 8. Earnings Boomed in 2021
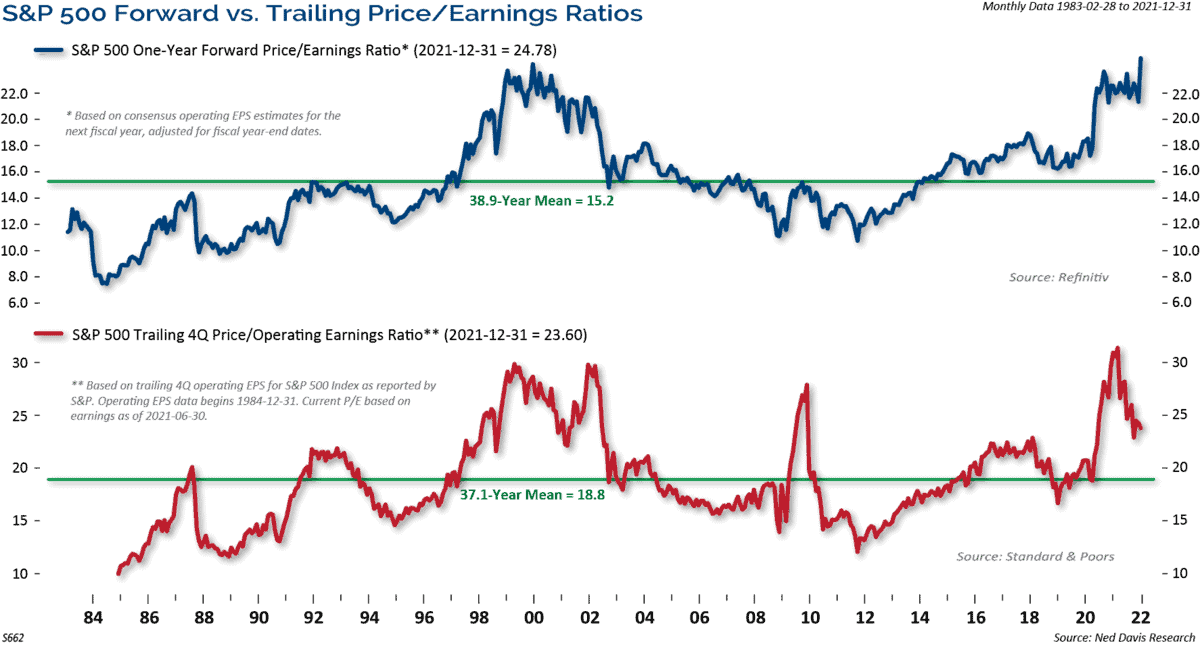
With long-term interest rates being so low by historical standards and moving higher, almost any relative valuation comparison favors stocks over bonds. For example, the S&P 500 forward earnings yield is 255 basis points higher than the 10-year Treasury yield versus a 20-year average of 149 basis points. While absolute valuations measures such as the P/E ratio are high and indicate high risk, attractive relative valuations support the secular bull market trend, favoring stocks as there is no alternative (TINA).
Will Yields Edge Higher?
Yields have started to move higher, with the 10-year yield breaking above last year’s high as it becomes evident that the Federal Reserve is going to move forward with rate hikes. The market was unnerved in early January when the minutes of the December FOMC meeting indicated that rates hikes could come sooner, and some members also noted that it could be appropriate to begin to reduce the size of the Fed’s balance sheet relatively soon after beginning to raise the federal funds rate.
The December jobs report showed the labor market continuing to tighten, with the unemployment rate sinking to 3.9%, just 0.4% above the pre-pandemic low, wages growing at a 4.9% year-over-year pace, and the labor participation rate staying stubbornly low. The Fed’s criteria of maximum employment and inflation has effectively been achieved, laying the groundwork for a rate hike as soon as March. Whether the Fed meets market expectations of four rates hikes or fewer remains to be seen. Our expectation is that the Fed will not act as aggressively as is currently priced into the markets.
Since 1980, there have been 9 Fed tightening cycles. Yields have always risen going into the first rate hike, while the yield curve tends to modestly flatten after rate hikes ensue as the market anticipates slower economic growth in the future. Our expectation is for the 10-year Treasury Note to end the year near 2.0%, but it could trade up to 2.25% – 2.50% range in the interim.
Changes Ahead for Fed Policy
In last year’s Market Outlook we said, “The Fed is staying in the game, they have no choice. The liquidity is massive and has driven up asset values across the board and kept interest rates artificially low. A question that central banks will have to answer in the years to come is, ‘How do they exit extreme stimulus without disrupting financial stability?’”
Figure 9. Fed’s Balance Sheet Has Doubled Since Pandemic’s Start
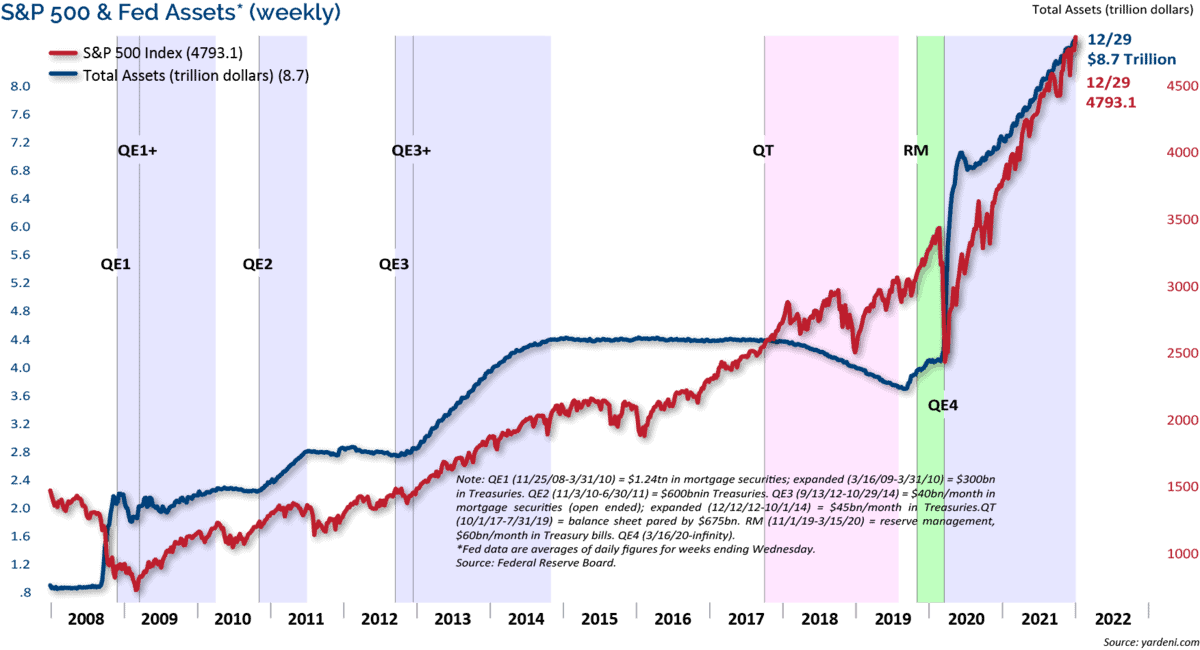
Well, here we are a year later, and we can see why the market has been rattled to start the year over the Fed’s mention of reducing the size of its balance sheet. Virtually all of the gains in stocks since 2008 have occurred while the balance sheet was growing. As shown in Figure 9 above, the Fed’s balance sheet has doubled, up over $4 trillion, since the beginning of COVID. There is no way the Fed can reduce the size in a meaningful way without disruption. The last time the Fed messaged letting the balance sheet roll off and hiking rates at the same time was in 2018. That didn’t end well with the market tanking before Chairman Powell pivoted. The stakes are even higher now than in 2018. So, it will be interesting to see how this evolves. We are skeptical, and think the Fed may be jawboning and won’t be as aggressive as their language.
Inflation is Here
Over the past year and a half, rising wages and poorly targeted pandemic relief programs gave Americans enormous new spending power while the continuing virus threat discouraged services consumption. So, consumers spent money on stuff. Too much money chased too few goods; too much demand led to damaged supply chains being overrun.
Inflation has ramped quicker than most expected, including the Federal Reserve. November’s blowout Consumer Price Index (CPI) reading of 6.9% annualized is double the readings that were persistently below 3% for the past 25 plus years. The stronger inflation numbers forced the Fed to change course, and in November, it stepped up its tapering and signaled that a rate hike cycle would begin.
In a recent blog post, Minneapolis Fed President Neel Kashkari acknowledged that the Fed must lean into inflation to re-anchor inflation expectations at 2%. But he also worried about inflation dropping back to the disinflationary era of the last 10 years. He wrote, “If the macroeconomic forces that kept advanced economies in a low-inflation regime are ultimately going to reassert themselves, the challenge for the FOMC will be to recognize this as soon as possible so we can avoid needlessly slowing the recovery, while at the same time protecting against the risk of entering a new, high-inflation regime. This strikes me as an especially difficult challenge for policymakers.” This suggests that the Fed sees the narrow path forward of hiking rates while also trying to engineer a soft landing.
Figure 10. Inflation is Now Normalizing
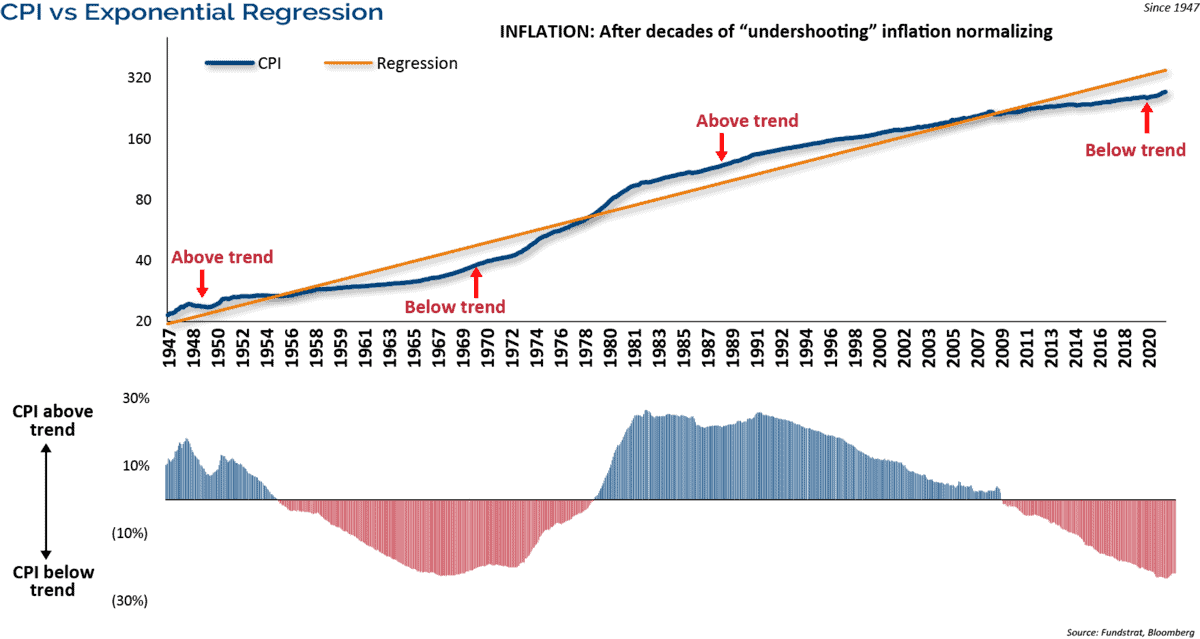
The chart above in Figure 10 shows that inflation has been lower than its long-term trend since the Global Financial Crisis, and after decades of undershooting, inflation is now normalizing. We expect inflation to moderate to 3.5% year over year from the lofty levels we see now in the second half of this year; however, it is likely to stay elevated compared to recent history as it catches back up to its long-term trendline.
We do not expect runaway inflation like we saw in the 1970s and early 1980s. We expect the current high inflation to be cyclical rather than structural, and believe that the restoration of supply chains, as more economies open up, will ease pricing pressures. Structurally, the massive debt overhang and deteriorating demographics suggest lower inflation down the road.
Credit Remains Resilient
In fixed income, we currently favor credit over duration as our credit-based risk management models continue to show no signs of credit deterioration. Despite the surge in COVID cases, the economy continues to re-open, which provides a favorable macro backdrop to credit. Continued economic re-opening has led to improved credit outlooks and an upgrade cycle that appears set to extend into 2022. The favorable macro backdrop and upgrade cycle has led to a high yield default rate of just 0.38% compared to its long-term average default rate of 3.66%.
Credit outperformed duration last year and we expect the same in 2022. Duration across fixed income sectors is extended, which indicates increased sensitivity to rising rates. For example, the duration of the Bloomberg Barclays Aggregate Bond Index ended the year near its all-time high. That is a conundrum for bond investors in a rising rate environment, and highlights the need for active bond management.
Figure 11. Credit Spreads are Historically Low

The lower duration of high yield bonds, than treasuries and investment grade corporate debt, was a defensive attribute for high yield last year and that should play out again in 2022. Credit spreads are historically low, with the Barclays High Yield Corporate Bond Index yielding only 269 basis points above 10-year U.S. Treasuries as shown in Figure 11 above. Given the low level of absolute yields and spreads, we would look for low single-digit returns again for high yield in 2022. However, we also anticipate a bout of volatility in credit to occur in tandem with other risk assets if the mid-term election year trends play out.
Overall, credit fundamentals have improved markedly during the economic recovery. Companies have decreased their leverage to their lowest levels since pre-2000. In addition, a wave of refinancing at lower rates has resulted in the interest coverage ratio surging to its highest level in over 50 years.
Figure 12. Stock Market Capitalization vs. GDI Highlights Risks

Let’s shift to the long-term secular view of the market. Figure 12 on the previous page looks at the stock market capitalization versus gross domestic income. The stock market has never been this overvalued relative to the economy. Factors such as globalization, productivity, innovation, and technology may have caused the ratio of stocks/economy to shift higher. However, it does highlight the risks associated with the market, and suggests that longer-term stock returns may be lower than we have had in the recent past. A caveat is that valuation metrics are not good timing tools, but they are good at highlighting risks.
Figure 13. Correlation Has Fallen, but Is Still Positive
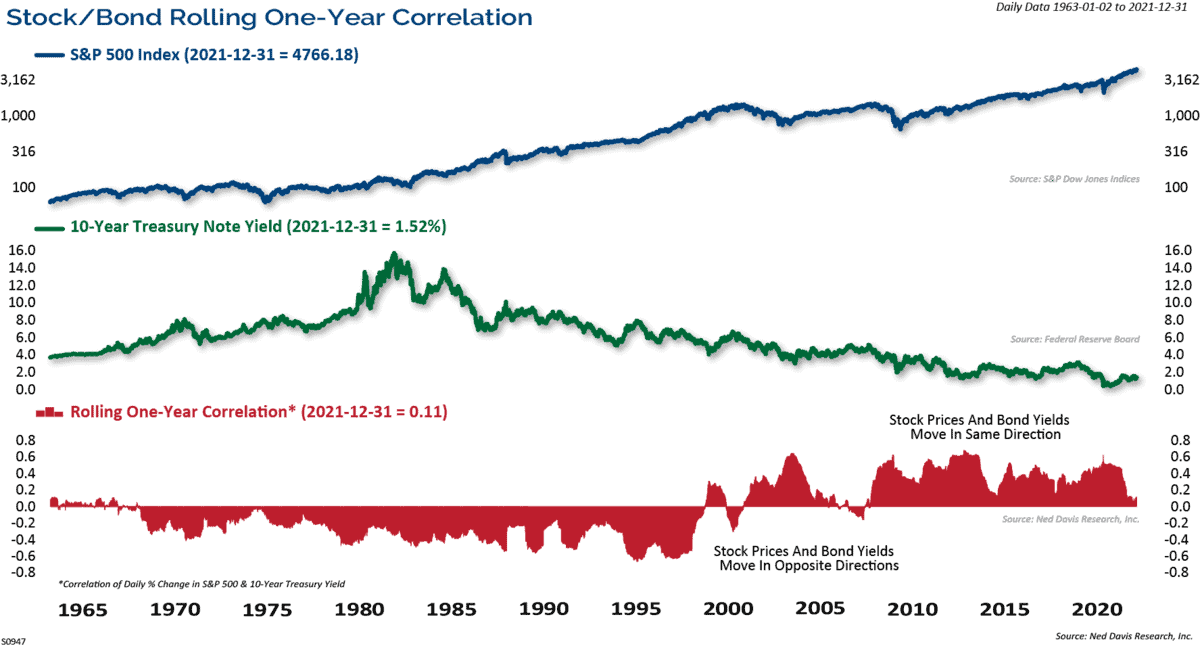
The chart above in Figure 13 shows the rolling one-year correlation between the daily change in the S&P 500 and the 10-year Treasury yield. From the late 1960s to the late-1990s, the correlation was negative, meaning that rising bond yields were bearish for stocks. Inflation back then was a bigger concern than deflation, so rising bond yields meant the Fed needed to tighten. However, the correlation shifted after the Asian Crisis and turned positive. Higher bond yields have signaled higher growth, which is good for stocks. Recently, the correlation has fallen, but is still positive. However, a sustained period of negative correlation between stock prices and bond yields would imply that inflation is a bigger threat, and the Fed would need to tighten policy more aggressively.
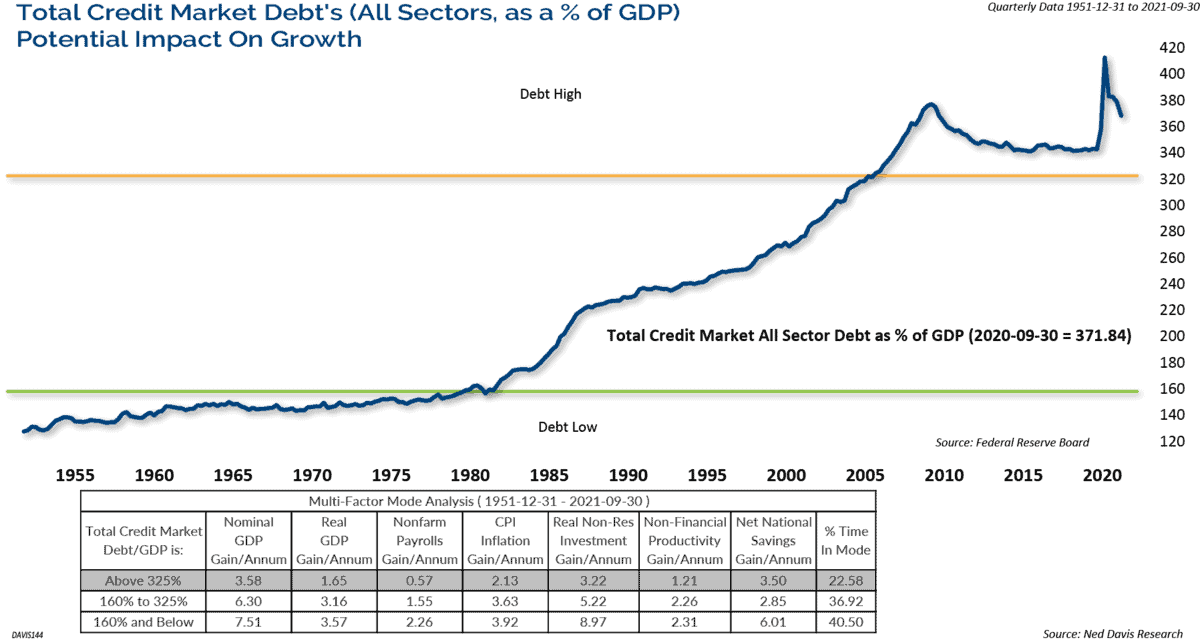
Debt levels have soared to record highs. Figure 14 on the following page graphically shows that as the amount of debt as a percentage of GDP has risen, the rate of growth in inflation, GDP, productivity, and payrolls have all declined. Debt crowds out today’s savings which are tomorrow’s investments, as it takes resources away from productive economic uses in order to service the debt. While the debt may have been politically popular and socially necessary, unfortunately it will lead to slower structural growth in the future. We simply cannot borrow and saddle future generations with massive debt and expect it to not have economic consequences in the future.
Figure 14. As Debt Increases, Growth Declines
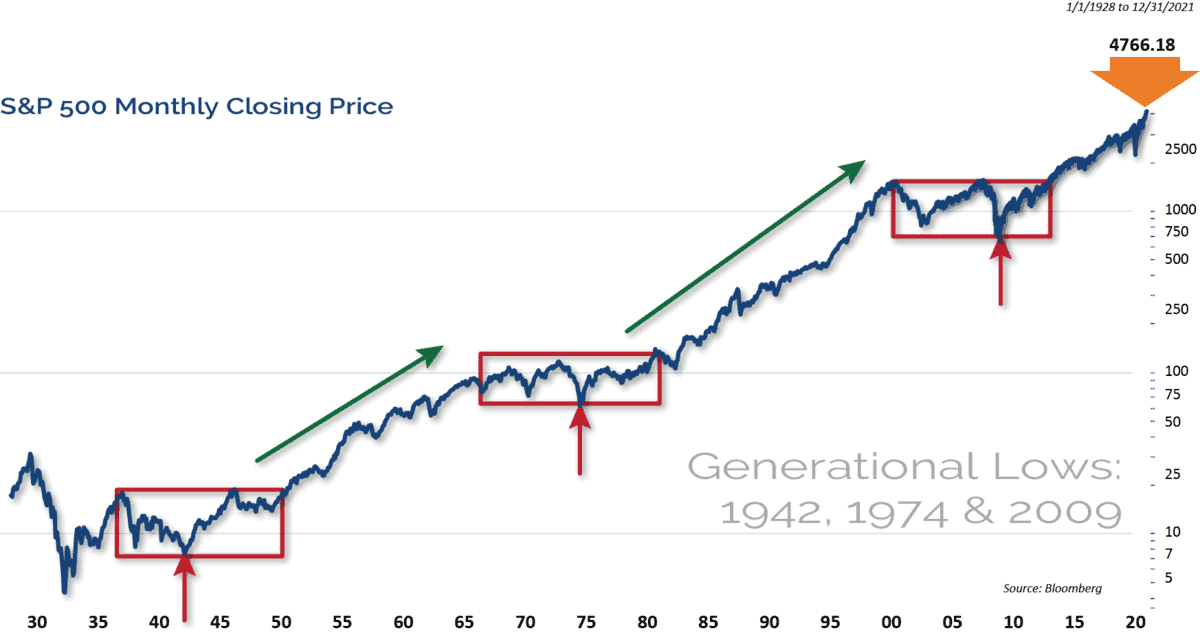
We have concluded the past several annual Market Outlook calls with the below chart in Figure 15 of the very long-term perspective of the equity markets.
This chart of the S&P 500 dates back into the 1920’s. The three boxes in red highlight the last three secular bear markets. Note that once the market eclipsed its prior secular peak, it continued higher for many years. In last year’s Market Outlook we said, “The fact that the COVID recession and stock decline was so short lived, and the rebound has taken the major indices to new highs, suggests that the secular bull market is intact.” That is still our opinion today.
Figure 15. Secular Bull Market Remains Intact
Conclusion
In summary, we expect economic growth to continue for several more years with strong tailwinds of continued economic reopening, COVID fading in the background as we learn to live with it, unprecedented monetary stimulus, and inventory rebuilding. The economy should grow at a real annualized pace of between 3.5% – 4.0% in 2022. Inflation is here, but we think the high levels we are seeing today will ease in the second half of the year to 3.5% year over year as supply chains ease and prices moderate.
It is a mid-term election year, which suggests increased volatility, a weak first half, followed by strength in the second half of the year. We look for the S&P 500 to end the year at 5200. The Fed is a wildcard as they will begin hiking rates. The market is currently pricing in four rate hikes in 2022. The market has historically done well after the Fed begins hiking rates if they take a gradual approach. Of course, with Fed actions, there is always the risk of a policy error. As always, we believe that clients should be focused on their long-term goals and objectives, and not be derailed by short-term swings in the markets.
Eager for More Insights? Visit our 2022 Mid-Year Market Outlook Resource Center.
The opinions expressed are those of Clark Capital Management Group. The opinions referenced are as of the date of publication and are subject to change due to changes in the market or economic conditions and may not necessarily come to pass. There is no guarantee of the future performance of any Clark Capital investment portfolio. Material presented has been derived from sources considered to be reliable, but the accuracy and completeness cannot be guaranteed. Nothing herein should be construed as a solicitation, recommendation or an offer to buy, sell or hold any securities, other investments or to adopt any investment strategy or strategies. For educational use only. This information is not intended to serve as investment advice. This material is not intended to be relied upon as a forecast or research. The investment or strategy discussed may not be suitable for all investors. Investors must make their own decisions based on their specific investment objectives and financial circumstances. Past performance does not guarantee future results.
This document may contain certain information that constitutes forward-looking statements which can be identified by the use of forward-looking terminology such as “may,” “expect,” “will,” “hope,” “forecast,” “intend,” “target,” “believe,” and/or comparable terminology (or the negative thereof). No assurance, representation, or warranty is made by any person that any of Clark Capital’s assumptions, expectations, objectives, and/or goals will be achieved. Nothing contained in this document may be relied upon as a guarantee, promise, assurance, or representation as to the future.
Clark Capital Management Group, Inc. is an investment adviser registered with the U.S. Securities and Exchange. Commission Registration does not imply a certain level of skill or training. More information about Clark Capital’s advisory services can be found in its Form ADV which is available upon request.
The Barclays U.S. Corporate High-Yield Index covers the USD-denominated, non-investment grade, fixed-rate, taxable corporate bond market. Securities are classified as high-yield if the middle rating of Moody’s, Fitch, and S&P is Ba1/BB+/BB+ or below.
Index returns include the reinvestment of income and dividends. The returns for these unmanaged indexes do not include any transaction costs, management fees or other costs. It is not possible to make an investment directly in any index.
Fixed income securities are subject to certain risks including, but not limited to: interest rate (changes in interest rates may cause a decline in market value or an investment), credit, prepayment, call (some bonds allow the issuer to call a bond for redemption before it matures), and extension (principal repayments may not occur as quickly as anticipated, causing the expected maturity of a security to increase).
Non-investment-grade debt securities (high-yield/junk bonds) may be subject to greater market fluctuations, risk of default or loss of income and principal than higher-rated securities
The S&P 500 measures the performance of the 500 leading companies in leading industries of the U.S. economy, capturing 75% of U.S. equities.
The Russell 1000 Value Index measures the performance of the large-cap value segment of the U.S. equity universe. It includes those Russell 1000 companies with lower price-to-book ratios and lower expected growth values.
The Russell 1000 Growth Index measures the performance of the large-cap growth segment of the U.S. equity universe. It includes those Russell 1000 Index companies with higher price-to-book ratios and higher forecasted growth values.
The Russell 1000 Index measures the performance of the large-cap segment of the U.S. equity universe. It is a subset of the Russell 3000® Index and includes approximately 1000 of the largest securities based on a combination of their market cap and current index membership. The Russell 1000 represents approximately 92% of the U.S. market.
The Russell 2000 Index measures the performance of the 2000 smallest U.S. companies based on total market capitalization in the Russell 3000, which represents approximately 10% of Russell 3000 total market capitalization.
The Russell 3000 Index measures the performance of the 3000 largest U.S. companies based on total market capitalization, which represents approximately 98% of the investable U.S. equity market.
The MSCI Emerging Markets Index is a free float-adjusted market capitalization index that is designed to measure equity market performance of emerging markets. The MSCI Emerging Markets Index consists of the following 21 emerging market country indices: Brazil, Chile, China, Colombia, Czech Republic, Egypt, Hungary, India, Indonesia, Korea, Malaysia, Mexico, Morocco, Peru, Philippines, Poland, Russia, South Africa, Taiwan, Thailand, and Turkey.
The MSCI World ex US Index is a market capitalization-weighted index designed to measure equity performance in 22 global developed markets, excluding the United States. The benchmark for this composite is used because the MSCI World Ex US Net Index is generally representative of international equities.
BBgBarc U.S. Aggregate Bond Index covers the U.S. investment-grade fixed-rate bond market, including government and credit securities, agency mortgage pass-through securities, asset-backed securities and commercial mortgage-based securities. To qualify for inclusion, a bond or security must have at least one year to final maturity, and be rated investment grade Baa3 or better, dollar denominated, non-convertible, fixed rate and publicly issued.
The BBgBarc US Treasury Index measures US dollar-denominated, fixed-rate, nominal debt issued by the US Treasury. Treasury bills are excluded by the maturity constraint but are part of a separate Short Treasury Index. STRIPS are excluded from the index because their inclusion would result in double-counting. The US Treasury Index is a component of the US Aggregate, US Universal, Global Aggregate and Global Treasury Indices.
The BBgBarc US Corporate Bond Index measures the investment grade, fixed-rate, taxable corporate bond market. It includes USD-denominated securities publicly issued by US and non-US industrial, utility and financial issuers. The US Corporate Index is a component of the US Credit and US Aggregate Indices, and provided the necessary inclusion rules are met, US Corporate Index securities also contribute to the multi-currency Global Aggregate Index.
The BBgBarc U.S. Corporate High-Yield Index covers the U.S. dollar-denominated, non-investment grade, fixed-rate, taxable corporate bond market. Securities are classified as high-yield if the middle rating of Moody’s, Fitch, and S&P is Ba1/BB+/BB+ or below.
The BBgBarc U.S. Municipal Index covers the USD-denominated long-term tax-exempt bond market. The index has four main sectors: state and local general obligation bonds, revenue bonds, insured bonds and prerefunded bonds.
The Global Manufacturing PMI™ indices are all seasonally adjusted. The seasonal adjustment is applied at the national level (as opposed to at the global aggregate level) in order to account for differing seasonal patterns in each of the nations included. Global Manufacturing PMI™ indices are weighted according to national contributions to global manufacturing gross value added. Weights for the global indices are derived from the latest available World Bank data on the gross value added of manufacturing for each of the nations covered. World Bank data on value added are in constant 2010 US$, with all national currencies converted to 2010 US$ by the World Bank using DEC alternative conversion factors.
The NDR Credit Conditions Indices (CCI) are designed to objectively measure credit conditions in the U.S. market, specifically the cost & availability of credit. The index consists of two equal-weighted components and historically evaluates business and consumer credit conditions.
NDR (Ned Daily Research) Daily Trading Sentiment Index is based on the S&P 500 Daily Sentiment Index which shows a short-term sentiment view of the S&P 500 Index
Created by the Chicago Board Options Exchange (CBOE), the Volatility Index, or VIX, is a real-time market index that represents the market’s expectation of 30-day forward-looking volatility. Derived from the price inputs of the S&P 500 index options, it provides a measure of market risk and investors’ sentiments.
The 10-year Treasury note is a debt obligation issued by the United States government with a maturity of 10 years upon initial issuance. A 10-year Treasury note pays interest at a fixed rate once every six months and pays the face value to the holder at maturity.
The Dow Jones Industrial Average is the most widely used indicator of the overall condition of the stock market, a price-weighted average of 30 actively traded blue chip stocks, primarily industrials. The 30 stocks are chosen by the editors of the Wall Street Journal (which is published by Dow Jones & Company), a practice that dates back to the beginning of the century. The Dow is computed using a price-weighted indexing system, rather than the more common market cap-weighted indexing system.
Index returns include the reinvestment of income and dividends. The returns for these unmanaged indexes do not include any transaction costs, management fees or other costs. It is not possible to make an investment directly in any index.
The volatility (beta) of an account may be greater or less than its respective benchmark.
The Consumer Price Index (CPI) measures the change in prices paid by consumers for goods and services. The CPI reflects spending patterns for each of two population groups: all urban consumers and urban wage earners and clerical workers. CCM-672
![]()