More Tricks Than Treats as Stocks Drop to Close Out October
HIGHLIGHTS:
- The last week of October pushed equities into negative territory for the month. Driven by rising COVID cases and the pending presidential election, equities could not hold onto gains from earlier in the month.
- The pending election and rising COVID cases also pushed volatility higher. The VIX Index rose above 40 in late October for the first time since June. It settled the month only modestly below that level at 38.02.
- Despite a more risk-off environment as October progressed, U.S. Treasury yields rose during the month. The 10-year U.S. Treasury yield ended September at 0.69%, but rose to 0.88% by October’s end.
- The record drop in GDP in the second quarter of -31.4% was met by an equally historic increase in GDP in the third quarter of 33.1%. Economic readings released in October were mixed.
- The month started with hopes that another round of fiscal stimulus would be enacted. However, moving into November, no stimulus package was passed, the election is now here, and COVID cases are accelerating, leading to elevated levels of volatility for investors.
EQUITY MARKETS
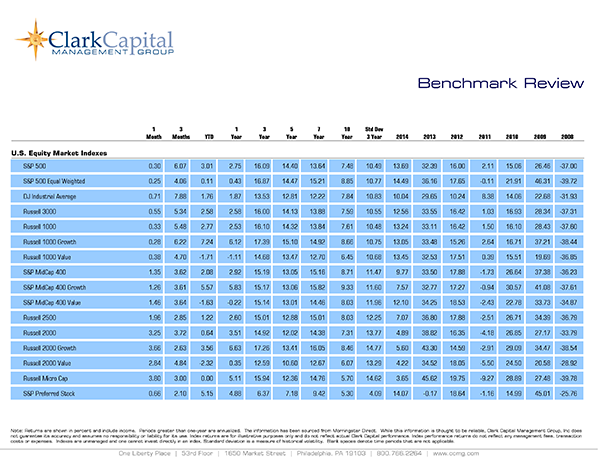
The last week sell-off in stocks pushed most major U.S. equity indices into negative territory for October. After a remarkable multi-month run following March lows, most equity indices declined in both September and October. Dispersion in performance among indices has been a long-running theme year to date, and that disparity played out in October as well, but with different pockets of strength. The S&P 500 Index, the Dow Jones Industrial Average, and the NASDAQ Composite all lost ground in October. However, the S&P 500 and NASDAQ remained in positive year-to-date territory, while the Dow slipped further into the red so far this year. The Russell 2000 Index, a measure of small-cap stocks, was positive in October, as were mid-caps, but both small and mid-cap stocks were still negative year to date. Value had better relative performance than growth for the month, but growth still shows a major advantage year to date.
The CBOE Volatility Index or VIX Index, rose to its highest level since June as volatility picked up late in the month when equities declined. The VIX closed above 40 in late October for only the second time since April. Historically, the VIX spends about 63% of the time between 10 and 20 and a reading above 40 is rare, occurring less than 3% of the time. We had been anticipating higher levels of volatility as we approached the election and as the economy encountered bumps along the way in the reopening process. These issues were further exacerbated by accelerating COVID cases in the U.S. and other parts of the world as October ended. Looking at the balance of 2020, volatility will likely remain elevated until we get through the election and see a slowdown in COVID cases.
Value continued to show some relative outperformance compared to growth in October, as it had in September. We at Clark Capital continue to use our disciplined approach of seeking out high-quality companies with improving business conditions at what we believe are good prices. The value/growth disparity has been and continues to be very stretched from our perspective, but some modest shift has occurred over the last two months as the FANMAG stocks have lost strength relative to the broader market. As always, we will continue to make purposeful investments in both stocks and bonds as we move forward in what we believe will be a period of wider outcomes of investment results.
The numbers for October were as follows: The S&P 500 declined -2.66%, the Dow Jones Industrial Average fell by -4.52%, the Russell 3000 slipped -2.16%, the NASDAQ Composite was off -2.26%, but the Russell 2000 Index gained 2.09%. Year-to-date results continue to show major dispersion among these broad indices and returns through October, in the same order, were as follows: 2.77%, -5.38%, 3.14%, 22.50%, and -6.77%, respectively. Reflecting the outperformance of large-cap companies, the S&P 500 Index (which is market-cap weighted) easily outpaced its equal weighted counterpart for the first ten months of the year. The S&P 500 Equal Weighted Index is down -5.33% year to date, but it did have a relatively better month of October, down only -0.61%, compared to the headline, market-cap weighted S&P 500.
Looking at style, growth stocks still hold the clear advantage year to date despite back to back months of relative outperformance of value stocks. The headline Russell 1000 Index is up 3.83% year to date. However, the Russell 1000 Growth Index has advanced 20.11% year to date, but was down -3.40% in October. The Russell 1000 Value index is off -12.74% year to date, but it declined a more modest -1.31% for the month.
International equities were mixed during the month with emerging markets continuing to outpace developed market stocks. The MSCI Emerging Markets Index gained 2.06% in October and the MSCI ACWI ex USA Index, a broad measure of international equities, declined -2.15% with year-to-date returns of 0.87% and -7.47%, respectively.
FIXED INCOME
The yield on the 10-year U.S. Treasury rose rather sharply during October, which created a headwind to most areas of the bond market. The ongoing and massive support from the Federal Reserve is generally keeping a lid on interest rates. However, after putting in historic lows across multiple parts of the yield curve in 2020, some movement higher in rates is not unexpected. We continue to believe that we will be in a “lower for longer” interest rate environment for the foreseeable future, but that does not mean that rates cannot fluctuate along the way.
Fixed income returns were as follows for October: the Bloomberg Barclays U.S. Aggregate Bond Index fell -0.45%, the Bloomberg Barclays U.S. Credit Index declined -0.22%, the Bloomberg Barclays U.S. Corporate High Yield Index gained 0.51% and the Bloomberg Barclays Municipal Index fell by -0.30%.
Treasuries still show solid results year to date driven by powerful first quarter returns, but this pocket of fixed income was among the hardest hit in October as interest rates rose. For example, for the month of October, the general Bloomberg Barclays U.S. Treasury Index fell -0.94% and the Bloomberg Barclays U.S. 30-Year Treasury Index declined -4.16%. High-yield bonds continued to inch further into positive year-to-date territory in October and despite weakness during the month, U.S. Treasuries, particularly further out on the yield curve, show the best results in the bond market through ten months of 2020.
ECONOMIC DATA AND OUTLOOK
As expected, the economic rebound in the third quarter was just as historic as the decline in GDP in the second quarter. After falling by -31.4% in Q2, the advanced reading of Q3 GDP rebounded by an astounding 33.1%, topping expectations. We anticipate more economic progress in the months and quarters ahead, but continue to expect bumps along the way on this economic recovery.
While the pace of job market gains has slowed, gains continue to be at elevated levels. Non-farm payrolls increased by 661,000 in September, but this was well below estimates of 859,000 and the prior month’s revised mark of just under 1.5 million new jobs. The unemployment rate continued to improve, dropping to 7.9%, which was better than the anticipated drop to 8.2%. Clearly, the job market has rebounded strongly from the massive layoffs that occurred as the economy shut down. However, when compared to the 3.5% unemployment rate at the end of 2019, there is still a lot of ground to make up in the labor market. Additionally, improvements moving forward will likely be more challenging than the snap-back gains we experienced in the labor market as the economy reopened.
The widely followed ISM Manufacturing Index dropped to 55.4 in October, below both expectations and the prior month’s level. The New Orders component of this reading was at 60.2, which still reflects strong growth, but was well below August’s level of 67.6 and expectations of 65.2. The good news is that this index rebounded strongly in October to 59.3 – the highest mark since November 2018. The ISM Non-Manufacturing Index, which covers the much larger service industries in the U.S. economy, improved to 57.8 from 56.9 and was ahead of expectations of 56.2. Clearly, manufacturing and service industries have improved from the shutdown period.
Retail sales continued to advance in September and are at higher levels than before the pandemic. Excluding auto and gas station sales, retail sales increased 1.5% for the month, outpacing expectations of a 0.5% improvement. New home sales, which are at levels last seen in 2006, could not keep pace with the surge in August and came in at a 959,000 annualized pace. Expectations were calling for a 1.025 million annual rate and a downward revision to the prior month’s reading brought it just below the 1 million unit pace to 994,000.
Housing starts improved from August but were below expectations while building permits exceeded expectations and the prior month’s level. Existing home sales at a 6.54 million annualized rate exceeded expectations of 6.3 million and last month’s mark. The Conference Board’s Leading Index gained 0.7%, surpassing the estimate of 0.6% and the gain in August was revised from a 1.2% monthly gain to 1.4%.
While strong gains continue in many parts of the economy, some data is reflecting that the pace of improvement is now slowing. We had anticipated that the third quarter would rebound strongly and while the fourth quarter would reflect above trend economic growth, it would be more muted compared to the third quarter.
There has been no change in the Fed’s stance as they continue to exhibit an “all in” attitude to support the financial system. Despite the Fed’s steady hand during this crisis, the unknown details of the highly anticipated next round of fiscal stimulus continues to gain the attention of the market. Most observers expect another round of fiscal stimulus, but the negotiations between the House and the Trump Administration broke down prior to the election as individual proposals demonstrate different priorities and dollar amounts between the parties. This next round of fiscal stimulus will likely be an ongoing focus in the market until some clarity develops around this issue after the election.
Equity markets had enjoyed a remarkable rebound following the lows in March with relatively little volatility. That changed in September and continued in October as most equity indices dropped and volatility rose. We remain resolute in our belief that the U.S. economy and corporate America will make it through this pandemic. This stance has not changed since the beginning of the crisis. We believe that the presidential election could continue to cause volatility that may last beyond November 3rd should it take more time to determine the winner.
Furthermore, the rising COVID case count continues to weigh on the markets and improvements on that front cannot come quickly enough. However, we believe that the economy and financial markets are heading in the right direction. As always, we believe it is imperative for investors to stay focused on their long-term goals and not let short-term swings in the market derail them from their longer-term objectives.
INVESTMENT IMPLICATIONS
Clark Capital’s Top-Down, Quantitative Strategies
The relative strength models that guide our top-down strategies have been very persistent in favoring large-cap and growth styles. We are beginning to see signs of emerging relative improvement in both mid and small-caps, as trends begin to broaden out with the economic reopening themes gathering strength.
In Fixed Income Total Return, our models have remained strong in favoring high yield as credit has remained very strong even during the equity correction in the second half of October. In our Alternative Opportunity portfolio, recent moves include adding to commodities and related stocks as they benefit from economic reopening themes.
Clark Capital’s Bottom-Up, Fundamental Strategies
In our bottom-up equity portfolios, as economic activity continues to recover, we continue to look for compelling companies with underappreciated business momentum (estimates are too low) or a valuation that does not reflect the quality and longer-term business prospects. For example, the High Dividend Equity portfolio purchased a leading global provider of electrical connection and protection solutions that has been unduly punished for exposure to commercial construction and energy end markets. We expect the company’s earnings to continue to exceed expectations and for the company to relatively outperform industrial peers in 2021 as those segments pick up and management demonstrates resiliency of margins.
In our fixed income strategies, the Taxable Bond portfolio continued to see companies refinance bonds in the BB credit space that we own. In the Tax-Free Bond portfolio, the headwinds of supply, credit erosion and political/economic uncertainty hold fast. While supply was outsized during the month as we forecasted, 30-40% was taxable. So, while the market cheapened overall, in a sense exempt paper became harder to find and helped insulate performance, a key factor when states like NJ, NY and CA rattle the tax increase sabre.
| Event | Period | Estimate | Actual | Prior | Revised |
|---|---|---|---|---|---|
| ISM Manufacturing | Sept | 56.5 | 55.4 | 56.0 | — |
| ISM Services Index | Sept | 56.2 | 57.8 | 56.9 | — |
| Change in Nonfarm Payrolls | Sept | 859k | 661k | 1.371m | 1.489m |
| Unemployment Rate | Sept | 8.2% | 7.9% | 8.4% | — |
| Average Hourly Earnings YoY | Sept | 4.8% | 4.7% | 4.7% | 4.6% |
| JOLTS Job Openings | Aug | 6500k | 6493k | 6618k | 6697k |
| PPI Final Demand MoM | Sept | 0.2% | 0.4% | 0.3% | — |
| PPI Final Demand YoY | Sept | 0.2% | 0.4% | -0.2% | — |
| PPI Ex Food and Energy MoM | Sept | 0.2% | 0.4% | 0.4% | — |
| PPI Ex Food and Energy YoY | Sept | 1.0% | 1.2% | 0.6% | — |
| CPI MoM | Sept | 0.2% | 0.2% | 0.4% | — |
| CPI YoY | Sept | 1.4% | 1.4% | 1.3% | — |
| CPI Ex Food and Energy MoM | Sept | 0.2% | 0.2% | 0.4% | — |
| CPI Ex Food and Energy YoY | Sept | 1.7% | 1.7% | 1.7% | — |
| Retail Sales Ex Auto and Gas | Sept | 0.5% | 1.5% | 0.7% | 0.5% |
| Industrial Production MoM | Sept | 0.5% | -0.6% | 0.4% | — |
| Building Permits | Sept | 1520k | 1553k | 1470k | 1476k |
| Housing Starts | Sept | 1465k | 1415k | 1416k | 1388k |
| New Home Sales | Sept | 1025k | 959k | 1011k | 994k |
| Existing Home Sales | Sept | 6.3m | 6.54m | 6.0m | 5.98m |
| Leading Index | Sept | 0.6% | 0.7% | 1.2% | 1.4% |
| Durable Goods Orders | Sept P | 0.5% | 1.9% | 0.5% | 0.4% |
| GDP Annualized QoQ | 3Q A | 0.5% | 1.9% | 0.5% | 0.4% |
| U. of Mich. Sentiment | Oct P | 80.5 | 81.2 | 80.4 | — |
| Personal Income | Sept | 0.4% | 0.9% | -2.7% | -2.5% |
| Personal Spending | Sept | 1.0% | 1.4% | 1.0% | — |
| S&P CoreLogic CS 20-City YoY NSA | Aug | 4.20% | 5.18% | 3.95% | 4.12% |
Source: Bloomberg
Past performance is not indicative of future results. The opinions expressed are those of the Clark Capital Management Group portfolio manager(s) that manage the strategies or products discussed herein, and do not necessarily reflect the opinions of all portfolio managers at Clark Capital Management Group or the firm as a whole. The opinions referenced are as of the date of publication and are subject to change due to changes in the market or economic conditions and may not necessarily come to pass. Nothing herein should be construed as a solicitation, recommendation or an offer to buy, sell or hold any securities, other investments or to adopt any investment strategy or strategies.
There is no guarantee of the future performance of any Clark Capital investment portfolio. This is not financial advice or an offer to sell any product. Clark Capital Management Group reserves the right to modify its current investment strategies and techniques based on changing market dynamics or client needs. It should not be assumed that any of the investment recommendations or decisions we make in the future will be profitable or will equal the investment performance of the securities discussed herein. Clark Capital Management Group is an investment adviser registered with the U.S. Securities and Exchange Commission. Registration does not imply a certain level of skill or training. More information about Clark Capital Management Group’s advisory services can be found in its Form ADV which is available upon request.
Fixed income securities are subject to certain risks including, but not limited to: interest rate (changes in interest rates may cause a decline in market value or an investment), credit, prepayment, call (some bonds allow the issuer to call a bond for redemption before it matures), and extension (principal repayments may not occur as quickly as anticipated, causing the expected maturity of a security to increase).
Non-investment-grade debt securities (high-yield/junk bonds) may be subject to greater market fluctuations, risk of default or loss of income and principal than higher-rated securities.
Foreign securities are more volatile, harder to price and less liquid than U.S. securities. They are subject to different accounting and regulatory standards and political and economic risks. These risks are enhanced in emerging market countries.
The U.S. Dollar Index is an index of the value of the United States dollar relative to a basket of foreign currencies, often referred to as a basket of U.S. trade partners’ currencies. The Index goes up when the U.S. dollar gains “strength” when compared to other currencies.
The S&P 500® Equal Weight Index (EWI) is the equal-weight version of the widely-used S&P 500. The index includes the same constituents as the capitalization weighted S&P 500, but each company in the S&P 500 EWI is allocated a fixed weight – or 0.2% of the index total at each quarterly rebalance.
The Bloomberg Barclays U.S. Municipal Index covers the USD-denominated long-term tax exempt bond market. The index has four main sectors: state and local general obligation bonds, revenue bonds, insured bonds and prerefunded bonds.
The Dow Jones Industrial Average indicates the value of 30 large, publicly owned companies based in the United States.
The NASDAQ Composite is a stock market index of the common stocks and similar securities listed on the NASDAQ stock market.
The S&P 500 measures the performance of the 500 leading companies in leading industries of the U.S. economy, capturing 75% of U.S. equities. .
The Russell 1000 Growth Index measures the performance of the large-cap growth segment of the U.S. equity universe. It includes those Russell 1000 Index companies with higher price-to-book ratios and higher forecasted growth values.
Russell 1000 Index measures the performance of the 1,000 largest companies in the Russell 3000 Index, which represents approximately 92% of the total market capitalization of the Russell 3000 Index.
The Russell 1000 Value Index measures the performance of the large-cap value segment of the U.S. equity universe. It includes those Russell 1000 Index companies with lower price-to-book ratios and lower forecasted growth values.
The Russell 2000 Index is a small-cap stock market index that represents the bottom 2,000 stocks in the Russell 3000.
The Russell 3000 Index measures the performance of the 3,000 largest U.S. companies based on total market capitalization, which represents approximately 98% of the investable U.S. equity market.
The 10 Year Treasury Rate is the yield received for investing in a US government issued treasury security that has a maturity of 10 year. The 10 year treasury yield is included on the longer end of the yield curve. Many analysts will use the 10 year yield as the “risk free” rate when valuing the markets or an individual security.
The MSCI Emerging Markets Index is used to measure large and mid-cap equity market performance in the global emerging markets.
The MSCI ACWI ex USA Index captures large and mid-cap representation across 22 of 23 developed market countries and 24 emerging market countries, covering approximately 85% of the global equity opportunity set outside of the U.S.
Bloomberg Barclays U.S. Aggregate Bond Index: The index is unmanaged and measures the performance of the investment grade, U.S. dollar denominated, fixed-rate taxable bond market, including Treasuries and government-related and corporate securities that have a remaining maturity of at least one year.
The Bloomberg Barclays U.S. Corporate High-Yield Index covers the U.S. dollar-denominated, non-investment grade, fixed-rate, taxable corporate bond market. Securities are classified as high-yield if the middle rating of Moody’s, Fitch, and S&P is Ba1/BB+/BB+ or below.
The Bloomberg Barclays U.S. Credit Index measures the investment grade, U.S. dollar denominated, fixed-rate taxable corporate and government related bond markets.
The ISM Non-Manufacturing Index is an index based on surveys of more than 400 non-manufacturing firms’ purchasing and supply executives, within 60 sectors across the nation, by the Institute of Supply Management (ISM). The ISM Non-Manufacturing Index tracks economic data, like the ISM Non-Manufacturing Business Activity Index. A composite diffusion index is created based on the data from these surveys, that monitors economic conditions of the nation.
ISM Manufacturing Index measures manufacturing activity based on a monthly survey, conducted by Institute for Supply Management (ISM), of purchasing managers at more than 300 manufacturing firms.
Personal consumption expenditures price index is the component statistic for consumption in gross domestic product collected by the United States Bureau of Economic Analysis.
The Bloomberg Barclays US Treasury Index measures US dollar-denominated, fixed-rate, nominal debt issued by the U.S. Treasury.
The 30 Year Treasury Rate is the yield received for investing in a US government issued treasury security that has a maturity of 30 years. The 30 year treasury yield is included on the longer end of the yield curve and is important when looking at the overall US economy.
The CBOE Volatility Index, known by its ticker symbol VIX, is a popular measure of the stock market’s expectation of volatility implied by S&P 500 index options.
The Conference Board’s Leading Indexes are the key elements in an analytic system designed to signal peaks and troughs in the business cycle. The leading, coincident, and lagging economic indexes are essentially composite averages of several individual leading, coincident, or lagging indicators. They are constructed to summarize and reveal common turning point patterns in economic data in a clearer and more convincing manner than any individual component – primarily because they smooth out some of the volatility of individual components.
The volatility (beta) of a client’s portfolio may be greater or less than its respective benchmark. It is not possible to invest in these indices.
Index returns include the reinvestment of income and dividends. The returns for these unmanaged indexes do not include any transaction costs, management fees or other costs. It is not possible to make an investment directly in any index.
CCM-993
![]()