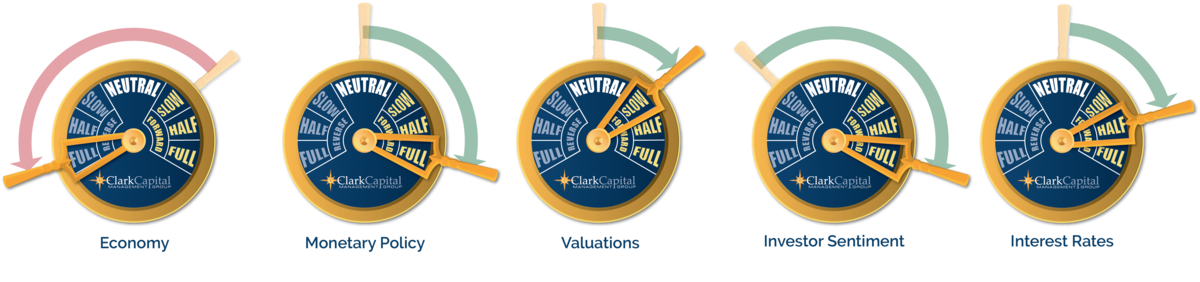
Clark Capital’s Economic Gauges
Market Moves: Charting Our Strategies, April 2020
Clark Capital’s Bottom-Up, Fundamental Strategies
In April, the market rallied sharply with the S&P 500 as it posted its biggest monthly gain since 1987, up 12.82%. Drivers for the rally included improving COVID-19 trends, slow re-opening plans for the economy, and possible treatments on the horizon. With earnings season in full swing, the number of buyback cancelations, dividend cuts, and suspensions continue to rise as forward earnings estimates decline.
Since the start of the COVID-19 virus, 119 companies have cut or suspended their dividend compared to the 2008 Financial Crisis when ninety companies cut dividends. Historically, as forward earnings estimates decline, there is a direct correlation to an increased number of dividend cuts.
The Navigator® High Dividend Equity portfolio focuses on dividend growers, which tend to have more stable businesses and cash flows. In the portfolio, the strongest contributing sectors were Financials, Industrials and Utilities while the detractors were Energy, REITs and Consumer Discretionary. Navigator® ADR International Equity has dramatically reduced its larger-than-typical emerging market weight from 21.6% in January to just 13.7% as slower economic growth typically harms more fragile economies.
At month end, we continued to add higher quality companies to the portfolio. As greater visibility regarding economic re-starts progresses, we anticipate continuing to move away from our biggest and safest country and industry holdings, like Japan and Ireland, Healthcare and Technology, and shifting back to emerging markets and cyclicals.
Below are strategy updates from April:
All Cap Core U.S. Equity
- Navigator All Cap is positioned in approximately 65% large-cap stocks with the remainder in mid/small-cap stocks and cash.
- The portfolio’s allocation to large-cap is now back below our high limit as small and mid-cap opportunities have been added to the portfolio. By many measures, small-cap and value underperformance relative to large caps had reached levels not seen since 2001. Technology and Healthcare remain the largest sector weights in the strategy at over 20%.
- Technology is the largest sector weight in the strategy at 20.6%. Although we reduced our weighting in Healthcare by approximately 2% this month to 18.4%, we remain overweight Healthcare and Consumer Discretionary by approximately 3% each.
- We will continue to pursue the highest quality small and mid-cap companies as we expect them to perform well after economic expectations stabilize as we believe they represent a unique opportunity.
High Dividend Equity
- With earnings season in full swing, the number of buyback cancelations, dividend cuts and suspensions continue to rise as forward earnings estimates decline.
- In April, the High Dividend equity portfolio rose +9.7% versus the Russell 1000 Value index up +11.2%.
- In the portfolio, the strongest contributing sectors were Financials, Industrials and Utilities while the detractors were Energy, REITs and Consumer Discretionary. Year-to-date, the largest contributing sectors are Technology, Industrials, and Healthcare versus the weakest sectors, which are Consumer Discretionary, Communications and Financials.
International Equity ADR
- Navigator® ADR/International Equity dramatically reduced its larger-than-typical emerging market weight from 21.6% in January to just 13.7% as slower economic growth typically harms more fragile economies.
- At month end, we continued to add higher quality companies to the portfolio including a telecommunications company and two life insurers.
- As greater visibility regarding economic re-starts progresses, we anticipate the portfolio will continue to move away from our biggest and safest country and industry holdings, like Japan and Ireland, Healthcare and Technology and move back to emerging markets and cyclicals.
Small Cap Core U.S. Equity
- 83% of the Navigator® Small Cap strategy is positioned in small-cap stocks with the balance in mid-cap stocks and cash.
- Industrials, Healthcare, Consumer Discretionary and Technology all have weights between 15-18% and represent our largest sector exposures.
- We added high-quality cyclicals to the portfolio this month including a REIT, a home loan lender and a freight and shipping company.
- The portfolio’s value and quality characteristics match or exceed the S&P 500 and Russell 2000. The recent market downturn has allowed us to add what we believe are high quality companies in every broad sector at very attractive value metrics.
SMID Cap Core U.S. Equity
- 72% of the Navigator® SMID Cap portfolio is positioned in small-cap stocks with the balance in mid-cap stocks and cash.
- Healthcare, Industrials, Consumer Discretionary and Technology represent our largest sector weights, each greater than 15%.
- We added high-quality cyclicals to the portfolio this month including a home loan lender and a freight and shipping company.
- The portfolio’s value and quality characteristics match or exceed the S&P 500 and Russell 2000. The recent market downturn has allowed us to add what we believe are high quality companies in every broad sector at very attractive value metrics.
Taxable Fixed Income
- We are focused on portfolio construction post-credit-impairment as caused by the shutdown of the American economy.
- The portfolio is increasing credit quality and exposure to Technology.
- The portfolio maintains a duration in the 4.5-year range as we believe the front-end of the yield curve provides little yield opportunity.
- We are targeting bonds in the 3-5 year range that have the probability of being supported by the Fed in their anticipated move to purchase fallen angels.
- As the Fed has yet to make a corporate bond purchase, we continue to look at how the market processes this new Fed intervention and adjust accordingly to the “don’t fight the Fed” mantra.
Tax-Free Fixed Income
- Our primary attention has centered on reducing risk, increasing liquidity, and maintaining long-term income. To do so, we have focused on adding what we believe are high quality and essential service and critical infrastructure bonds such as water and wastewater credits to the portfolio allocation. We feel these are reliable holdings that provide critical services to customers and should be less impacted by the negative effects of the coronavirus pandemic.
- In addition, we have been increasing portfolio weightings towards local school district holdings as we believe that the property tax bases supporting these positions are more stable compared to state general obligation bonds back by sales tax revenues.
- Most of the portfolio is allocated to higher coupon holdings, such as bonds offering 5% coupons and 4% coupons, which accomplishes two goals in our view – 1) reduces portfolio duration and 2) provides faster return of capital to investors in the form of periodic income.
- Lastly, we have been avoiding what we believe are troubled lower quality credits such as bonds attached to convention centers, stadiums, tourism, and shopping centers in an effort to minimize portfolio risk and strengthen credit quality.
Clark Capital’s Top-Down, Quantitative Strategies
Our top-down, relative strength strategies came into April in a risk-on position and benefited from the strongest monthly performance in the S&P 500 since 1987. The Navigator® Style Opportunity portfolio was allocated to large-cap growth and the S&P 500, enjoying the bounce back from the March lows, as the longstanding trend in growth remained intact. On March 27th, the Navigator® Fixed Income Total Return (FITR) strategy shifted from defensive to risk-on, prior to the Federal Reserve’s announcement of their support for investment grade and fallen angel debt. High yield enjoyed a huge rally on April 9th when the Fed stated that it would buy corporate bond ETFs, including high yield ETFs.
The Navigator® Global Tactical portfolio, which shifts from equity risk-on to risk-off in tandem with the FITR credit-based risk models, came into the year fully invested in equity. It then turned defensive alongside FITR, and went fully back into equity on March 27th, just four days after the low in the S&P 500. The strategy is currently invested in 70% U.S. equity and 30% international equity ETFs.
Below are strategy updates from April:
Alternative
- The portfolio added to its gold and gold miners exposure in March and early April, eventually reducing gold after it hit a multi-year resistance.
- Equities are generally underweight, with a larger-than-normal cash buffer.
- We recently added non-correlating assets like inverse Treasury ETFs and a market neutral ETF, while reducing MLP Pipelines and Energy exposure.
Fixed Income Total Return
- On April 9th, high yield enjoyed a huge rally when the Fed stated that it would buy corporate bond ETFs, including high yield ETFs. Since then, high yield has weakened, and our model has moved to only mildly positive.
- Market and economic volatility remain high, so we could turn defensive within a relatively short period. However, every time that high yield has looked like it would break down, it has rallied back, and with wide spreads still above 2016 peaks, we believe that could continue.
Style Opportunity
- The portfolio has seen little activity, as determined by our ETF rankings.
- Large-cap growth and the S&P 500 Index remain near the top of our rankings. With the rankings stable, the portfolio has stuck with large-cap growth and the S&P 500, and is enjoying the bounce back from the March lows.
- Mid-cap growth is the first aggressive/risk-on ETF to strengthen enough to have a buy point in view.
The views expressed are those of the author(s) and do not necessarily reflect the views of Clark Capital Management Group. The opinions referenced are as of the date of publication and are subject to change due to changes in the market or economic conditions and may not necessarily come to pass. There is no guarantee of the future performance of any Clark Capital investments portfolio. Material presented has been derived from sources considered to be reliable, but the accuracy and completeness cannot be guaranteed. Nothing herein should be construed as a solicitation, recommendation or an offer to buy, sell or hold any securities, other investments or to adopt any investment strategy or strategies. For educational use only. This information is not intended to serve as investment advice. This material is not intended to be relied upon as a forecast or research. The investment or strategy discussed may not be suitable for all investors. Investors must make their own decisions based on their specific investment objectives and financial circumstances. Past performance does not guarantee future results.
The S&P 500 Index is a stock market index that tracks the stocks of 500 large-cap U.S. companies.
The Russell 2000 Index measures the performance of the 2000 smallest U.S. companies based on total market capitalization in the Russell 3000, which represents approximately 11% of Russell 3000 total market capitalization.
Fixed income securities are subject to certain risks including, but not limited to: interest rate (changes in interest rates may cause a decline in market value of an investment), credit, payment, call (some bonds allow the issuer to call a bond for redemption before it matures), and extension (principal repayments may not occur as quickly as anticipated, causing the expected maturity of a security to increase).
This document may contain certain information that constitutes forward-looking statements which can be identified by the use of forward-looking terminology such as “may,” “expect,” “will,” “hope,” “forecast,” “intend,” “target,” “believe,” and/or comparable terminology (or the negative thereof). Forward looking statements cannot be guaranteed. No assurance, representation, or warranty is made by any person that any of Clark Capital’s assumptions, expectations, objectives, and/or goals will be achieved. Nothing contained in this document may be relied upon as a guarantee, promise, assurance, or representation as to the future.
Clark Capital Management Group, Inc. is an investment adviser registered with the U.S. Securities and Exchange Commission. Registration does not imply a certain level of skill or training. More information about Clark Capital’s advisory services and fees can be found in its Form ADV which is available upon request. CCM-1188
![]()