
September 21, 2021 | As we approach the 4th quarter, there are many headwinds affecting the markets. Between the Federal Reserve’s beginning of bond purchase tapering, slower economic data, peak earnings growth, the upcoming debt limit, and China’s Evergrande crisis, the problems are starting to mount.
Let’s start with China. The Chinese equity markets have been hit hard in recent weeks due to their slowing economy and numerous regulations imposed on high-tech companies as part of the government’s “common prosperity” initiative. The drop in stock prices in recent days has been caused by the looming collapse of Evergrande. The MSCI China Index peaked at a record high on February 17th and is down 30.3% since. The news around Evergrande is nothing new. The problems it and other highly levered Chinese property companies are afflicted with have been around for years. For example, the government implemented policies in 2020 aiming to bring down leverage in the property sector to avoid a systemic crisis.
Until recently, Evergrande was China’s second-largest property developer. It has $355 billion of assets across 1,300 developments, many located in China’s lower-tier cities. It also carries massive debt as the company’s liabilities exceed $300 billion. Due to its practice of borrowing in the short-term markets to fund longer-term liabilities, it is facing a liquidity crunch as lenders have disappeared and its bonds are trading at $0.20 on the dollar.
There is a lot of talk about whether this is a Lehman Brothers moment or a Long-Term Capital Management (LTCM) type scenario. Lehman Brothers was allowed to fail and took down the entire financial system. LTCM was bailed out, and the markets experienced a quick bear market. Chinese government officials are well aware of the headlines comparing Evergrande to Lehman Brothers. They should also know the consequences of letting the firm fail. Other financial institutions will be impacted if Evergrande defaults on its debt, and the ripple effects of this are not fully known. China’s property developers have been a very important source of economic growth and employment in China. So, we think the Chinese authorities will eventually step in and restructure the company to mitigate collateral damage.
This week is the FOMC meeting, and it is widely expected that they will announce that the tapering of bond purchases will begin in November. Consensus is that they will taper purchases by $15 billion per month, which would end in the middle of 2022. We don’t think the developing scenario in China and fear of contagion will delay the taper announcement, but we will find out on Wednesday. Anecdotally, the Fed is still pumping money into the system. Just last week the Fed’s balance sheet exploded higher by $91 billion. Could it be that the Fed was adding liquidity to stem any potential contagion from China? We believe that a continued surge in COVID cases would have a larger impact on the Fed’s pace and timing of tapering.
The U.S. markets did suffer a bout of volatility and sharp declines across the board on Monday before staging a decent rally into the close. The S&P 500 has been down in 9 of the past 11 sessions. Even so, the S&P 500 is only down 3.90% from its closing high on September 2nd. In addition, the S&P 500 has gone 212 trading days since experiencing a 5% or greater correction. To put that into perspective, since 1979, the market has experienced a 5% correction every 54 trading days on average. We believe we have been in a remarkably stable environment aided by the Federal Reserve’s liquidity measures. The broader market has actually been in somewhat of a corrective mode for several months. The Russell 2000 Index of small-cap stocks peaked in March, has traded sideways within a 10% trading range, and is off 7.1% from its peak.
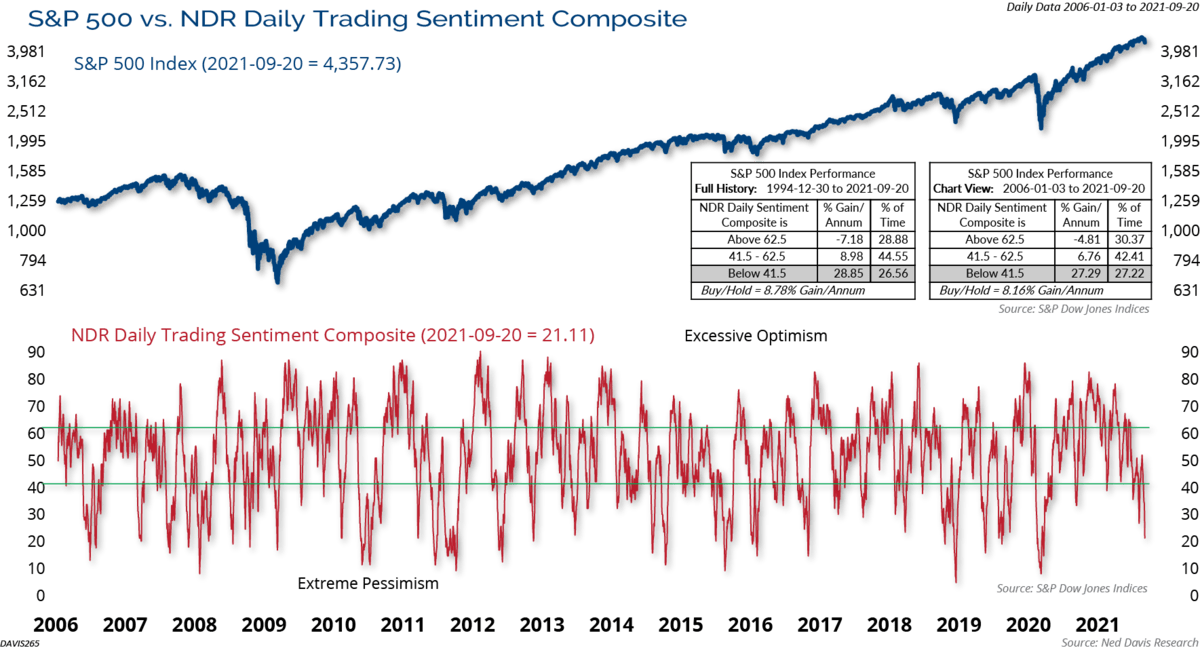
The impact of the broader market consolidation and Monday’s declines have the market now trading in a short-term oversold condition with signs of pessimistic investor sentiment. According to the American Institute of Individual Investors (AAII), only 22.4% of individual investors are bullish compared to 56.9% of investors that were bullish in early April. In addition, as shown in the chart below, the Ned David Research (NDR) Daily Trading Sentiment Composite fell into the pessimistic range after Monday’s drop on the Evergrande news.
In credit, the linkages between what’s going on in China and broader dollar credit markets are tenuous at best. While it makes sense for credit spreads to widen on broader risk appetite pausing, it’s hard to describe this selloff as being credit driven. Credit has been very stable with U.S. high yield and investment grade credit spreads low and stable, and high yield credit indices were trading at or near all-time highs prior to Monday’s decline. If there is going to be a broader impact across asset classes from the China property market stress, we would expect that to be reflected with weakness across credit, and we are not seeing evidence of that yet.
Finally, the market is in the weakest seasonal period of the year, which extends into mid-October. Given the usual weak seasonal trends, we believe the market is more vulnerable to short-term shocks and volatility, and we may see more of it over the next couple weeks. However, as long as credit remains firm and stable, we would view weakness as a buying opportunity as opposed to something to sell into.
As always, we believe that the surest way for clients to achieve financial success is to remain focused on their long-term goals and objectives and not short-term volatility in the markets. Please reach out to us with any questions.
The opinions expressed are exclusively the opinions of the author(s) and do not necessarily reflect the views of Clark Capital Management Group.
The opinions referenced are as of the date of publication and are subject to change due to changes in the market or economic conditions and may not necessarily come to pass. There is no guarantee of the future performance of any Clark Capital investments portfolio. Material presented has been derived from sources considered to be reliable, but the accuracy and completeness cannot be guaranteed. Nothing herein should be construed as a solicitation, recommendation or an offer to buy, sell or hold any securities, other investments or to adopt any investment strategy or strategies. For educational use only. This information is not intended to serve as investment advice. This material is not intended to be relied upon as a forecast or research.
The S&P 500 Index is a stock market index that measures the stock performance of 500 large companies listed on stock exchanges in the United States. An obligor rated ‘BBB’ has adequate capacity to meet its financial commitments. However, adverse economic conditions or changing circumstances are more likely to lead to a weakened capacity of the obligor to meet its financial commitments.
The Russell 2000 Index measures the performance of the 2000 smallest U.S. companies based on total market capitalization in the Russell 3000, which represents approximately 11% of Russell 3000 total market capitalization.
The MSCI China Index captures large and mid cap representation across China A shares, H shares, B shares, Red chips, P chips and foreign listings (e.g. ADRs). With 730 constituents, the index covers about 85% of this China equity universe. Currently, the index includes Large Cap A and Mid Cap A shares represented at 20% of their free float adjusted market capitalization.
NDR (Ned Daily Research) Daily Trading Sentiment Index is based on the S&P 500 Daily Sentiment Index which shows a short-term sentiment view of the S&P 500 Index
This document may contain certain information that constitutes forward-looking statements which can be identified by the use of forward-looking terminology such as “may,” “expect,” “will,” “hope,” “forecast,” “intend,” “target,” “believe,” and/or comparable terminology (or the negative thereof). Forward looking statements cannot be guaranteed. No assurance, representation, or warranty is made by any person that any of Clark Capital’s assumptions, expectations, objectives, and/or goals will be achieved. Nothing contained in this document may be relied upon as a guarantee, promise, assurance, or representation as to the future.
Clark Capital Management Group, Inc. is an investment adviser registered with the U.S. Securities and Exchange Commission. Registration does not imply a certain level of skill or training. More information about Clark Capital’s advisory services and fees can be found in its Form ADV which is available upon request.
CCM-500
![]()