January 25, 2022 | In our 2022 Market Outlook we said, “We think we are transitioning from a year of recovery in 2021 to a year of headwinds and mean reversion in 2022.” We expected a weak first half of the year with elevated volatility and market corrections. To highlight that we said, “2022 is a mid-term election year and history suggests a choppy first half of the year followed by a second half recovery. So, we expect to see more volatility in 2022 than last year, with the potential for a 10-15% correction in the first half of the year.” We also highlighted a lot of risks including COVID, lofty valuations, the potential for a Fed policy error, and geopolitical risks with China and Russia. Those risks have bubbled to the surface with geopolitical tensions rising with Russia and China, and the markets are adjusting to the new reality of a less stimulative Federal Reserve. The result has been a return of volatility and market corrections as expected.
While the trading so far this year has caused a lot of investor angst, it is a good reminder that volatility is a characteristic of the market, and after a near record low year of volatility in 2021 and sharp market gains since the COVID lows, a return of volatility and corrections is normal. The table below highlights the frequency of market declines and shows that on average, every year the market suffers three 5% corrections, one 10% correction, and every three years, a decline of 20% or more.
| S&P 500 Declines | Occurrences Per Year | Frequency Average | Probability of Moving to Next Stage | Mean Decline |
|---|---|---|---|---|
| -5% of more | 3.4 | Every 14 weeks | 32% | -10.9% |
| -10% or more | 1.1 | Every Year | 45% | -19.5% |
| -15% or more | 0.5 | Every 2 years | 58% | -28.2% |
| -20% or more | 0.3 | Every 3 years | N/A | -35.7% |
The S&P 500 peaked on 1/3/22 and has since declined 8.25% through Friday’s close. Value stocks have outperformed during the recent declines with the Russell 1000 Value Index down 5.11% compared to the Russell 1000 Growth Index, which has lost 13.36% from its high. Other indices have suffered far steeper declines from their respective highs as froth has come out of the market. For example, the Russell 2000 Index of small-cap stocks has declined 18.44% and the Nasdaq Composite has dropped 14.18%. Concept capital investments have plunged even more, with the SPAC IPO Index down 41%, Bitcoin down 48%, and the ARK Innovation ETF down 53.9%. A lot of froth has come out of the market.
The pullback we have seen in stocks has not been accompanied by a significant deterioration in the credit markets. Credit has remained very resilient in the face of the equity market weakness. Lasting corrections in stocks are nearly always in tandem with a sell-off in high yield bonds. When that doesn’t occur, the pullbacks are usually short/shallow and prove to be buying opportunities. We think this is just normal volatility sparked by geopolitical fears and a revaluation of risk assets to changing Fed policy. We have done some selective tax loss harvesting, but even with this pullback, there are not a lot of losses to be harvested in our equity strategies.
I keep thinking about my kids asking, “Are we there yet?” on family road trips. I’m sure clients are asking a similar question about the market, “Have we hit a low yet?” There is a very good chance that the steep intraday declines we saw on Monday and subsequent reversal higher marks at least the beginning of a bottoming process. The CBOE Volatility Index surged to its highest level since 2020. However, volatility is likely to stay with us in the near term, especially with earnings season heating up, the FOMC meeting on Wednesday, and major geopolitical tensions around the world. In our opinion, it would be very normal for the market to test those intraday lows during a bottoming process.
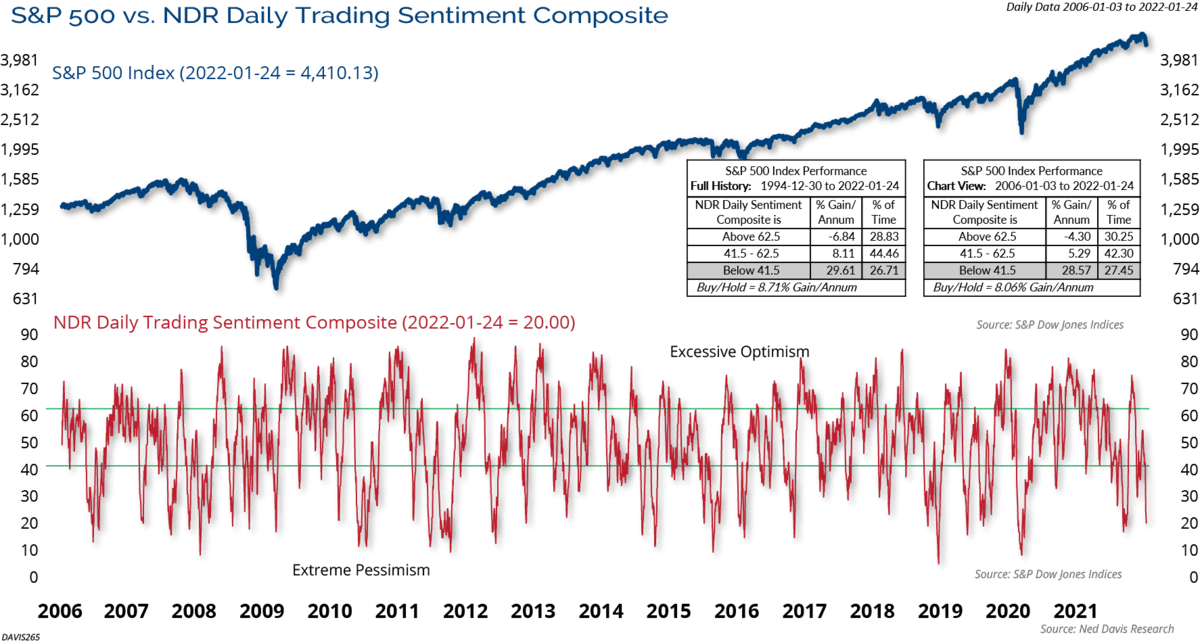
We believe several characteristics such as washed-out breadth, pessimistic sentiment, put/call ratios, and indiscriminate selling are constructive. For example, the Ned Davis Research Trading Sentiment Composite (below) is in the extreme pessimistic zone, which has been a hallmark of some lows in recent history. Other investor sentiment indicators confirm this, with the CBOE Equity put/call ratio surging to its highest level since the COVID Crash in 2020.
According to Bespoke Investment Group, the Nasdaq finished last week 3.3 standard deviations below its 50-day moving average. The last time the index was as oversold based on this measure was during the COVID crash in the second half of March 2020. Going further back to the end of the Financial Crisis, there have only been a handful of other times that the Nasdaq has been more oversold than it is now. Again, this doesn’t ensure an immediate recovery, but history illustrates that prior extremes such as this have led to above-average returns for the Nasdaq over the subsequent 3, 6, and 12-month periods.
The Federal Reserve meeting on Wednesday and their message coming out of that meeting is likely to move the markets. There are growing expectations in the market that the Fed will kick off raising rates with a 0.50% hike in March, hike rates at least four times this year, and start a balance sheet reduction. We would caution that in recent history (since Alan Greenspan became the Fed Chairman), the Fed has not started a rate hike cycle with a 0.50% hike. The market has turned hawkish on Fed policy and therefore, we don’t think it would take much for the Fed to give a slightly more dovish view than compared to market expectations. We will soon find out.
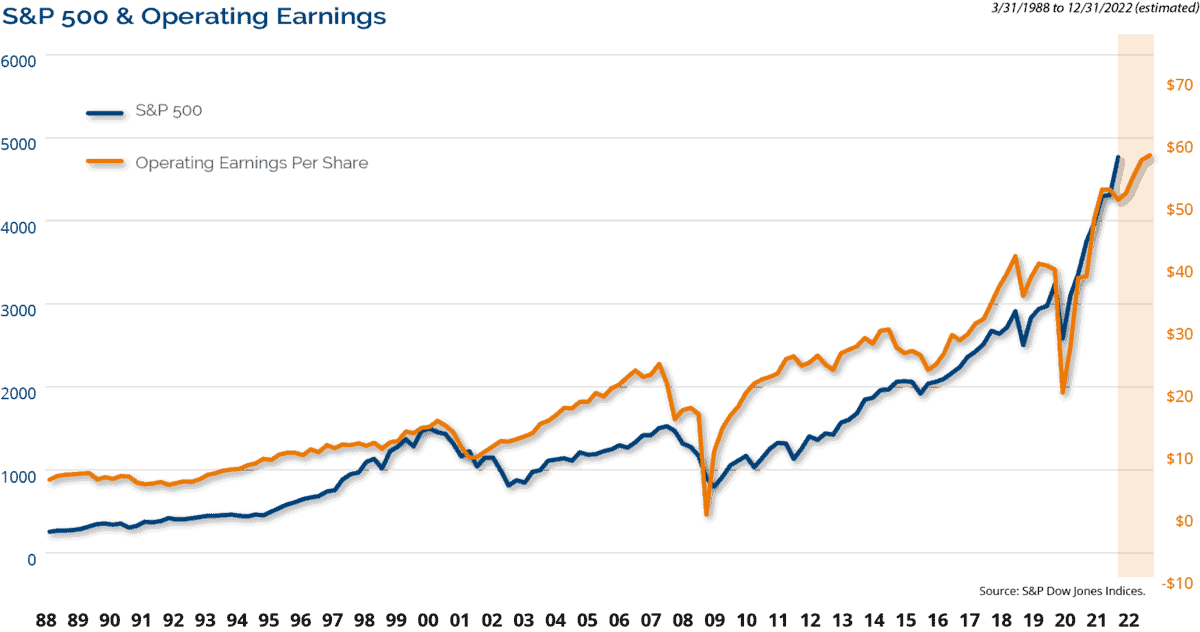
We believe the fundamental driver of business values (and stock prices) are earnings. In its most simplistic form, there are only two things that determine the price of a stock or a market: earnings and what investors are willing to pay for those earnings. This is illustrated in the graph below. Stock prices track earnings over time and the earnings outlook is still positive.
We think the most important takeaway from this is that market volatility is normal. As always, we believe that clients should be focused on their long-term goals and objectives, and not be derailed by short-term swings in the markets.
Looking for More Market Insights? Access Our 2022 Market Outlook Resource Center Here.
The opinions expressed are exclusively the opinions of the author(s) and do not necessarily reflect the views of Clark Capital Management Group.
The opinions referenced are as of the date of publication and are subject to change due to changes in the market or economic conditions and may not necessarily come to pass. There is no guarantee of the future performance of any Clark Capital investments portfolio. Material presented has been derived from sources considered to be reliable, but the accuracy and completeness cannot be guaranteed. Nothing herein should be construed as a solicitation, recommendation or an offer to buy, sell or hold any securities, other investments or to adopt any investment strategy or strategies. For educational use only. This information is not intended to serve as investment advice. This material is not intended to be relied upon as a forecast or research. Investing involves risk, including the loss of principal. The value of investments, and the income from them, can go down as well as up and you may get back less than the amount invested. Past performance is not indicative of future results.
The S&P 500 Index is a stock market index that measures the stock performance of 500 large companies listed on stock exchanges in the United States.
The Russell 1000 Value Index is a broadly diversified index predominantly made up of value stocks of large U.S. companies.
The Russell 1000 Growth Index a broadly diversified index predominantly made up of growth stocks of large U.S. companies.
The Nasdaq Composite is a stock market index that includes almost all stocks listed on the Nasdaq stock exchange.
The SPAC IPO Index is designed to track the aftermarket performance of Special Purpose Acquisition Companies (SPACs).
The CBOE Volatility Index is a popular measure of the stock market’s expectation of volatility based on S&P 500 index options.
The CBOE Equity Put/Call ratio includes index option and equity option. It’s a popular indicator for market sentiment.
The Russell 2000 Index measures the performance of the 2000 smallest U.S. companies based on total market capitalization in the Russell 3000, which represents approximately 11% of Russell 3000 total market capitalization.
The NDR (Ned Daily Research) Daily Trading Sentiment Index is based on the S&P 500 Daily Sentiment Index which shows a short-term sentiment view of the S&P 500 Index.
This document may contain certain information that constitutes forward-looking statements which can be identified by the use of forward-looking terminology such as “may,” “expect,” “will,” “hope,” “forecast,” “intend,” “target,” “believe,” and/or comparable terminology (or the negative thereof). Forward looking statements cannot be guaranteed. No assurance, representation, or warranty is made by any person that any of Clark Capital’s assumptions, expectations, objectives, and/or goals will be achieved. Nothing contained in this document may be relied upon as a guarantee, promise, assurance, or representation as to the future.
Clark Capital Management Group, Inc. is an investment adviser registered with the U.S. Securities and Exchange Commission. Registration does not imply a certain level of skill or training. More information about Clark Capital’s advisory services and fees can be found in its Form ADV which is available upon request.
CCM-500
![]()