
Another Solid Month of Stock and Bond Gains; Economic Data Causes Some Pause
HIGHLIGHTS:
- Stocks: The Dow Jones Industrial Average achieved new all-time highs in August, finally joining the S&P 500 and NASDAQ Composite with record levels in 2025.
- Bonds: Yields remained calm and generally trended lower in August, creating a solid backdrop for bond returns for the month. The 10-year U.S. Treasury, which closed July at 4.37%, moved lower to 4.23% by the end of August.
- U.S. Economy: Gross domestic product (GDP) was revised higher for the second quarter to 3.3%. However, a major revision in job numbers shocked the market in early August. The change not only cost the head of the BLS her job but also raised concerns that the labor market may not be as strong as previously thought.
- Federal Reserve: Despite the absence of an FOMC meeting, it was a noisy month for the Fed. In his Jackson Hole speech, Chair Powell indicated that a change in policy might be warranted given potential risks to the job market. The month ended with added drama, as President Trump moved to dismiss Fed Governor Lisa Cook, sparking a legal battle.
Equity Markets
See Table 1 for August 2025 and YTD results.
Table 1 | Equity Markets
| Index | 25-Aug | YTD |
| S&P 500 | 2.03% | 10.79% |
| S&P 500 Equal Weight | 2.69% | 8.69% |
| DJIA | 3.42% | 8.30% |
| Russell 3000 | 2.31% | 10.58% |
| NASDAQ Comp. | 1.65% | 11.60% |
| Russell 2000 | 7.14% | 7.06% |
| MSCI ACWI ex U.S. | 3.47% | 21.64% |
| MSCI Emerging Mkts Net | 1.28% | 19.02% |
The equity rally continued in August with major U.S. stock market indices reaching new highs. Small caps, as measured by the Russell 2000 Index, emerged as a new leader for the month, and the index moved solidly into positive territory year to date. However, small caps have still lagged so far in 2025 compared to their large-cap and international stock counterparts. After a powerful run since April lows, large-cap growth had more modest returns in August, but positive returns, nonetheless. Value outperformed growth during the month and closed the year-to-date gap. International stocks returned to positive territory in August after a modest decline in July. International stocks, both developed and emerging markets, continued to enjoy the clear leadership in equities in 2025.
Fixed Income
Bond results were solid in August. Rates generally moved lower during the month, which led to a positive backdrop for most bond sectors. In a month that saw stocks rally, it was not a surprise to see high-yield lead bonds higher. See Table 2 for bond index returns for August 2025 and YTD.
Table 2 | Fixed Income Markets
| Index | Aug-25 | YTD |
| Bloomberg U.S. Agg | 1.20% | 4.99% |
| Bloomberg U.S. Credit | 1.06% | 5.38% |
| Bloomberg U.S. High Yld | 1.25% | 6.35% |
| Bloomberg Muni | 0.87% | 0.32% |
| Bloomberg 30-year U.S. TSY | -0.10% | 0.73% |
| Bloomberg U.S. TSY | 1.06% | 4.48% |
Our expectation of a volatile rate environment has materialized so far in 2025, but rates have generally fallen this year and created solid returns in most bond categories. Notable exceptions are further out on the yield curve. The 10-year U.S. Treasury yield closed July at 4.37%, and it moved lower to close August at 4.23%, which supported bond prices. The 20-year U.S. Treasury sits at 4.86%, the exact level it closed 2024. The 30-year U.S. Treasury, which closed 2024 at 4.78%, has risen to 4.92%. Munis have lagged in 2025, but recent gains pushed this bond category into positive year-to-date territory, as well. In general, bonds have done their job in 2025 with solid gains through August helping offset some of this year’s equity market volatility.
We maintain our long-standing position favoring credit versus pure rate exposure in this interest rate environment. We also believe the role bonds play in a portfolio — to provide stable cash flow and to help offset the volatility of stocks in the long run — has not changed. Bond volatility provides opportunities for active bond managers, and in our opinion, having an active bond management approach makes sense in this environment. Furthermore, rates remain elevated and provide attractive opportunities for bond investors.
Economic Data Highlights and Outlook
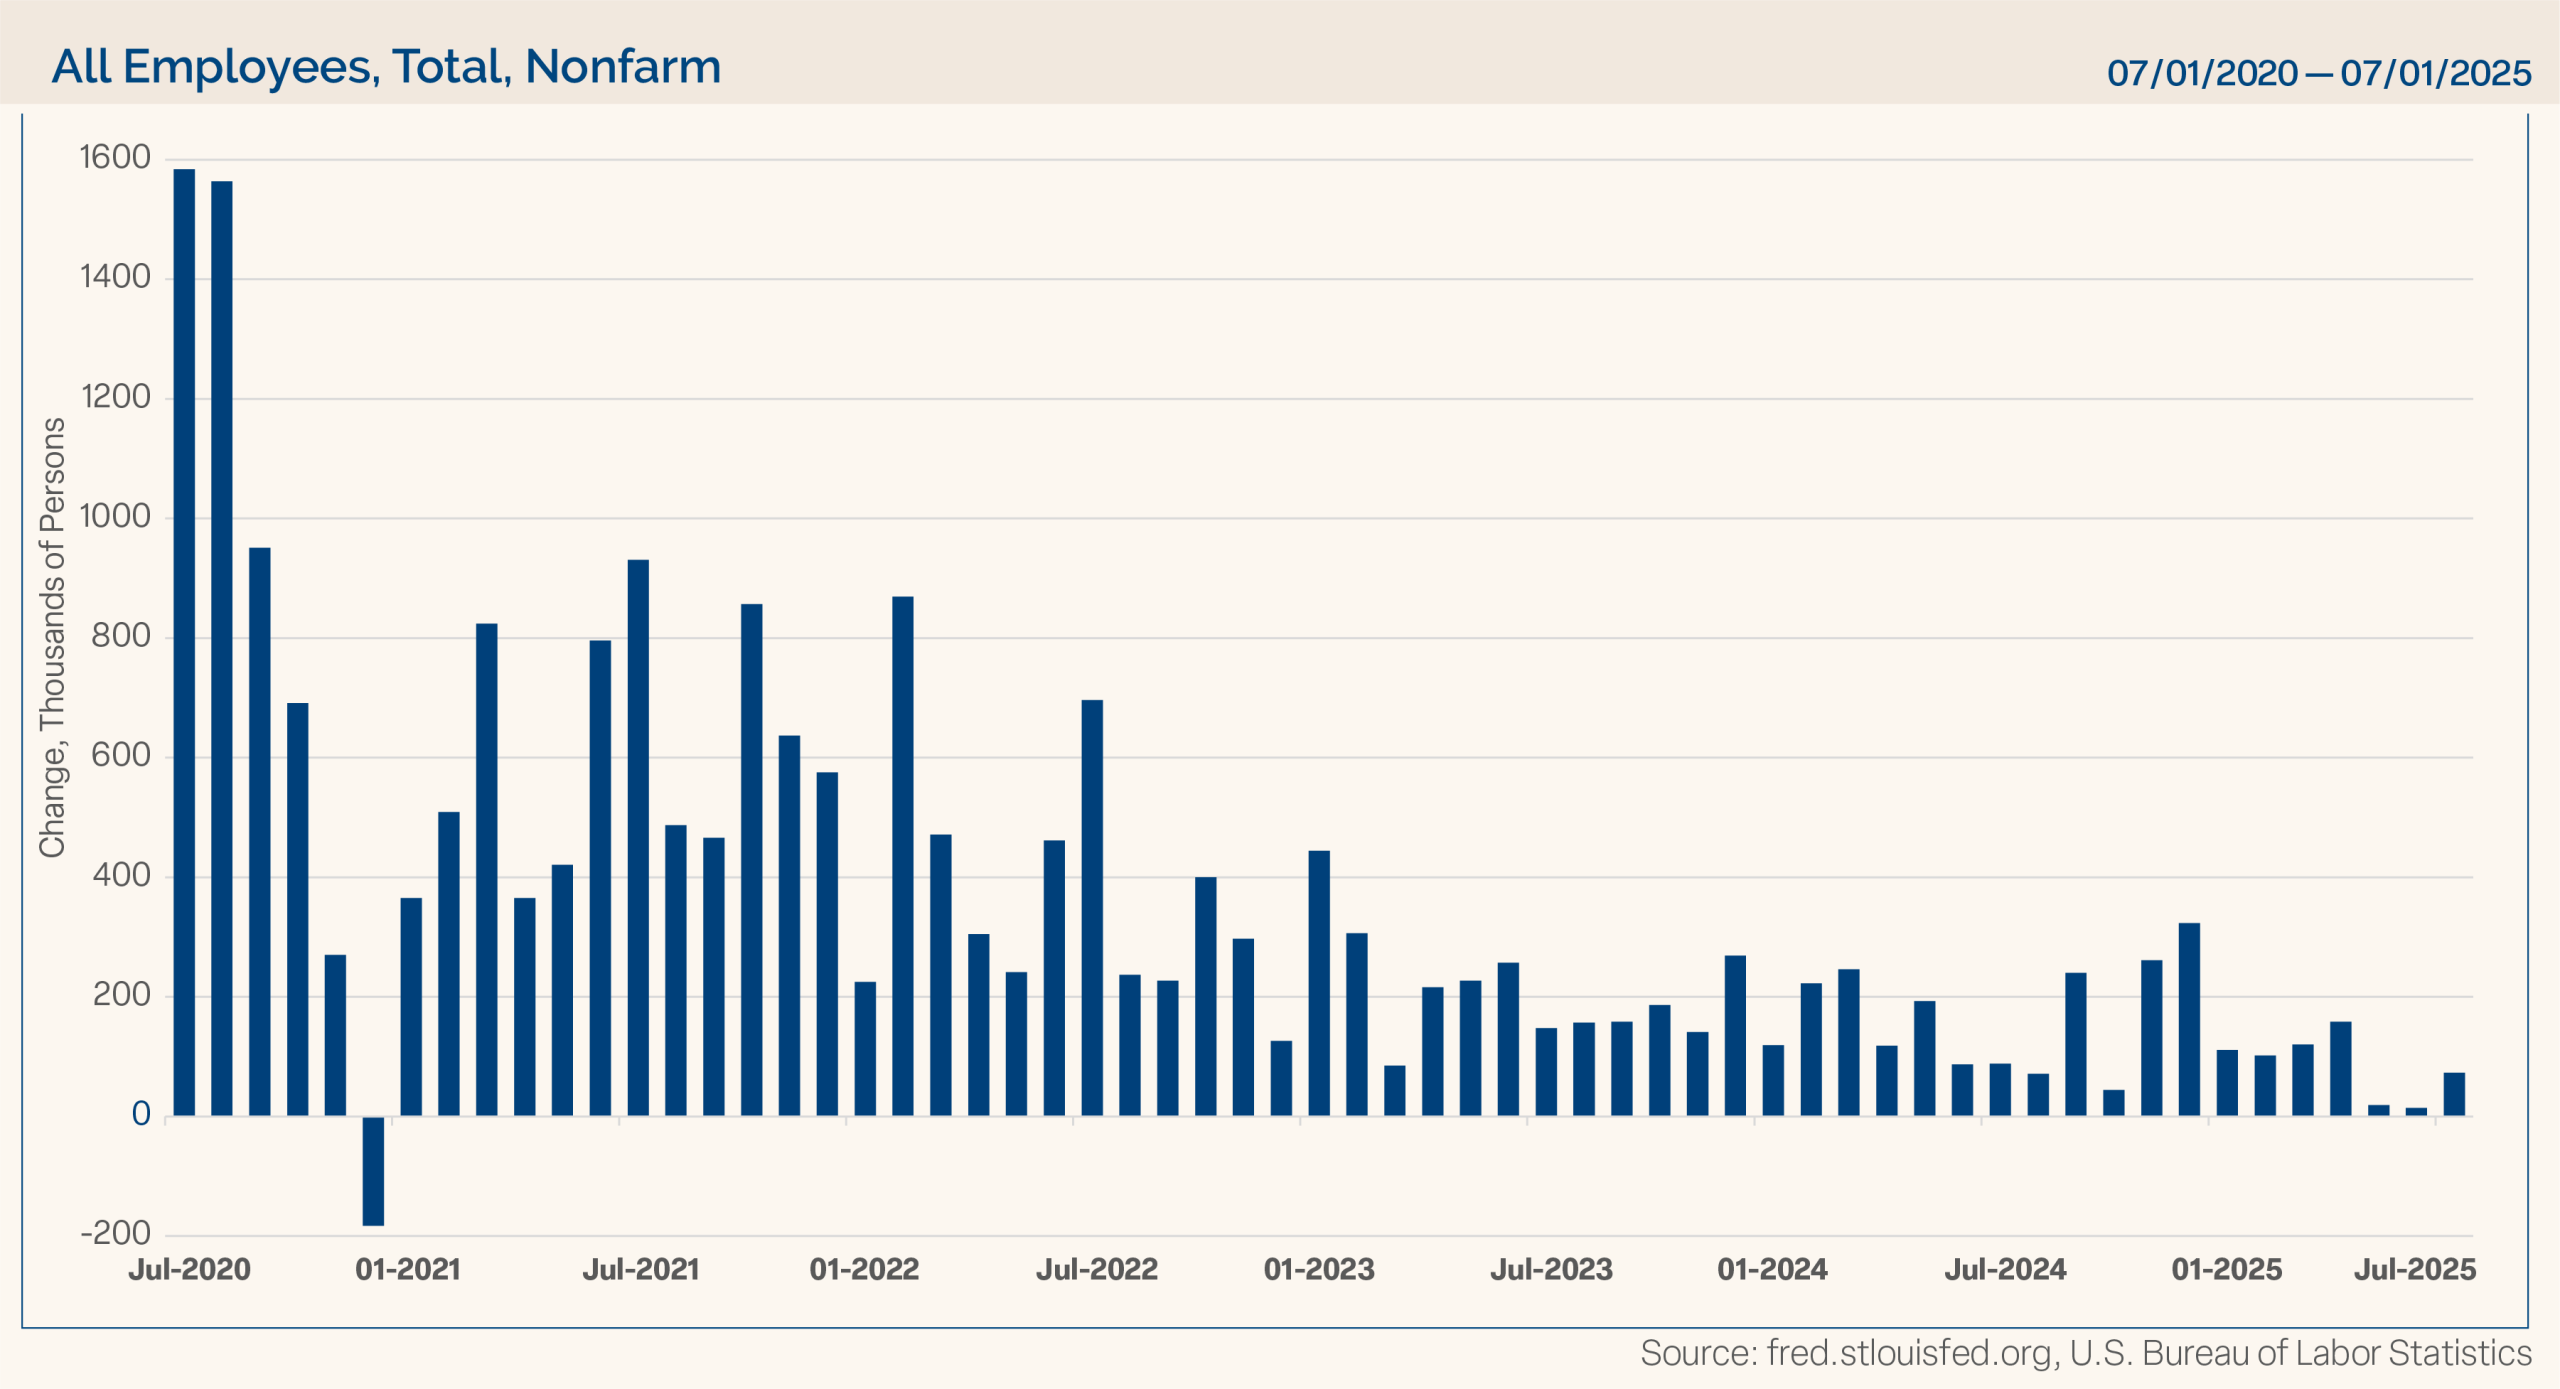
Jobs: The job market created huge headlines as July data was released in early August. Job additions in July were weaker than expected (73,000 versus estimates of 105,000), but the real story was the revisions to the prior two months. June data was revised lower to only 14,000 jobs created after an initial report of 147,000. Furthermore, the prior two months were revised lower by a total of 258,000 fewer job additions than previously reported. Although this weaker recent job market will likely help push the Fed closer to President Trump’s long-desired rate cuts, he reacted to these significant revisions by firing the head of the Bureau of Labor Statistics. With the role of consumer spending critical to the U.S. economy, monitoring job market data will be key in the months ahead to see if this recent weakness is deepening. Chart 1 shows that after the significant rebound in job additions following the pandemic, payroll gains have slowed in recent months and years.
Chart 1
Inflation: Inflation data readings were mixed in August. The headline Consumer Price Index (CPI) rose 0.2% for July, matching expectations, and came in better (lower) than expected on an annual basis at 2.7%. The core CPI rose an expected 0.3% for the month, but the annual number increased to 3.1%, slightly above expectations of 3% and June’s mark of 2.9%. The Producer Price Index (PPI) was much hotter than expected in July with much higher-than-expected monthly gains for both headline and core PPI. The annual gains were 3.3% and 3.7%, versus expectations of 2.5% and 3.0%, respectively. The PPI can often lead consumer prices as it captures price changes early in the production process. The Personal Consumption Expenditures (PCE) price index came in as expected across the board for July. However, the core PCE price index, the Fed’s preferred measure of inflation, rose 2.9% on an annual basis through July, up modestly from the 2.8% annual increase in June and still well above the Fed’s target inflation rate of 2%. Inflation and job market data are giving somewhat conflicting signals to the Fed, but the market’s expectation based on all the recent data is that the Fed will cut rates twice before the end of 2025. (Based on the CME FedWatch tool on 8/28/25. For more specific inflation data, please refer to the end of this report.)
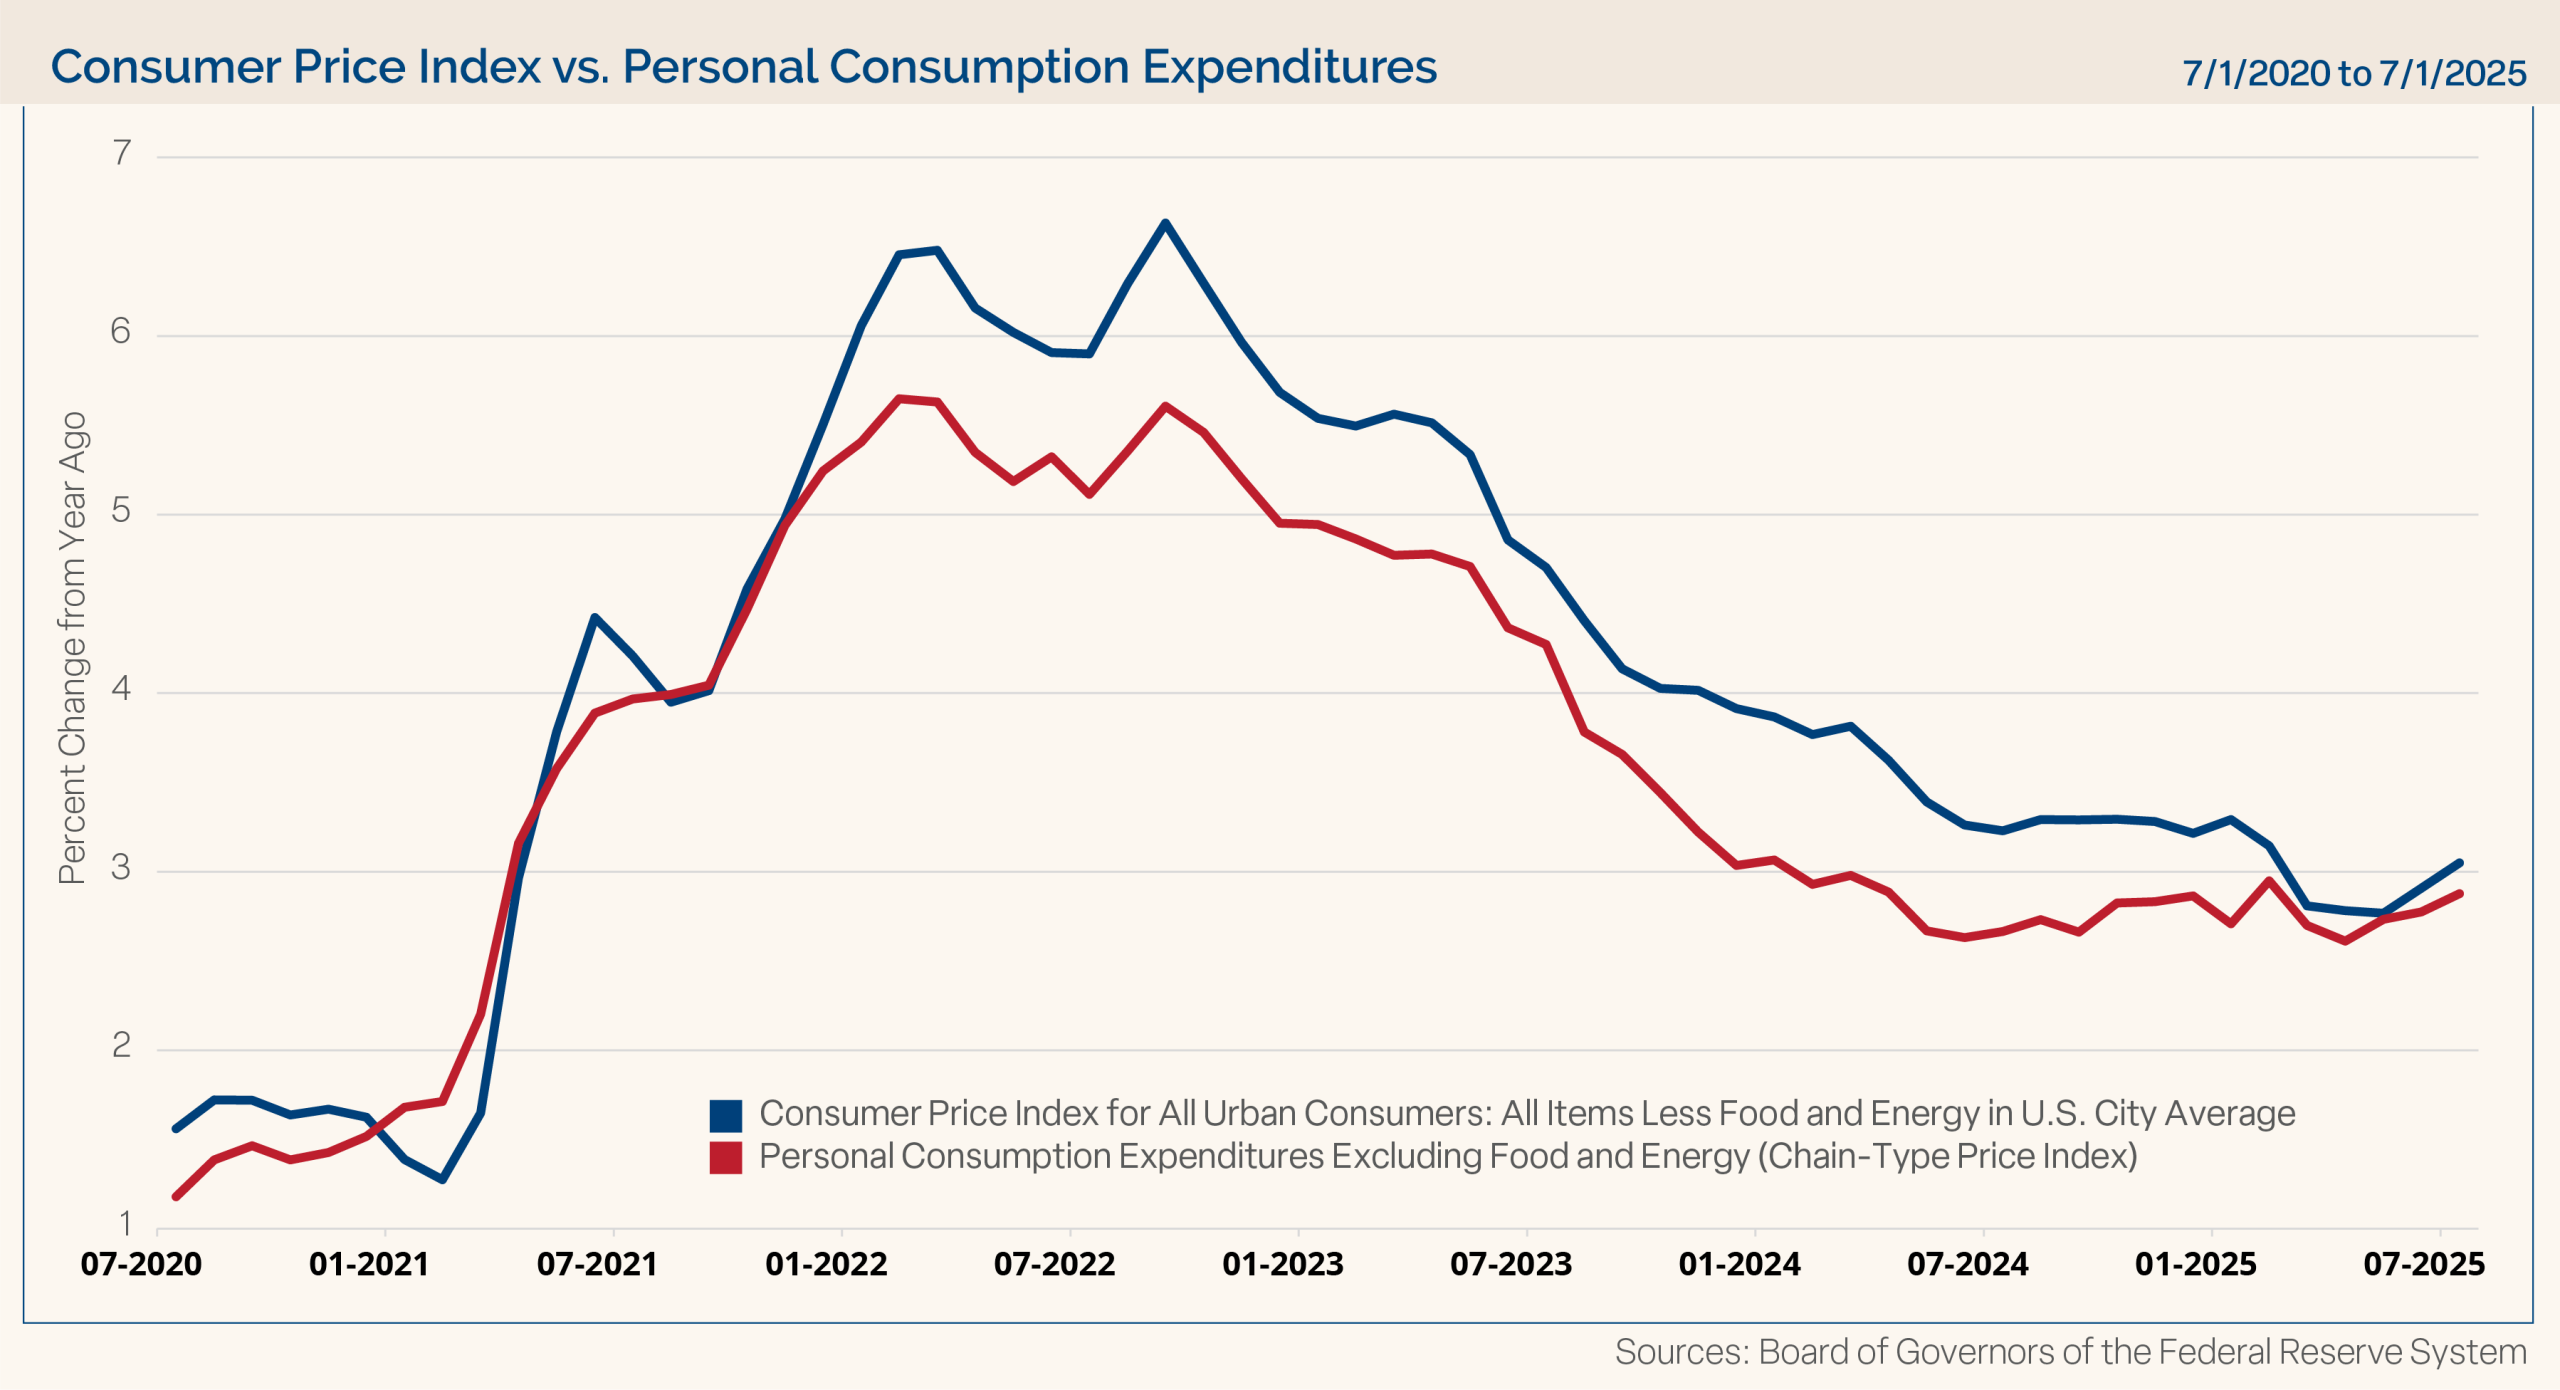
Tariff concerns have increased inflation fears, but we have not yet seen sustained evidence that prices are moving higher. With higher tariff rates kicking in for many countries in August, prices level data will be important to monitor in the coming months. Chart 2 shows the core CPI and core PCE price indices. Inflation levels are clearly off their highs from a few years ago, but the progress towards 2% does seem to be stalling in recent months as well.
Chart 2
GDP: After the -0.5% annualized decline in the first quarter, the economy bounced back in the second quarter, and the recovery in Q2 was even stronger than initially thought. The U.S. economy rose at a 3.3% annualized pace in the second quarter, besting expectations of 3.1% and the advance estimate of 3.0%. The improvement on this second reading was driven in part by stronger personal consumption than initially reported. (A third reading will be released in September.) The personal consumption expenditure component was better at a 1.6% annualized rate in Q2, exceeding the initial reading of 1.4% and much stronger than the weak 0.5% reading from the first quarter. Historically, it takes a lot to knock down U.S. consumers and spending tends to be resilient. As we acknowledged, the Q1 GDP number was heavily impacted by the spike in imports ahead of tariff concerns in April, which distorted the overall Q1 GDP reading. Likewise, the strong Q2 GDP number was distorted by the sharp drop in imports in Q2 compared to Q1, which was additive to GDP.
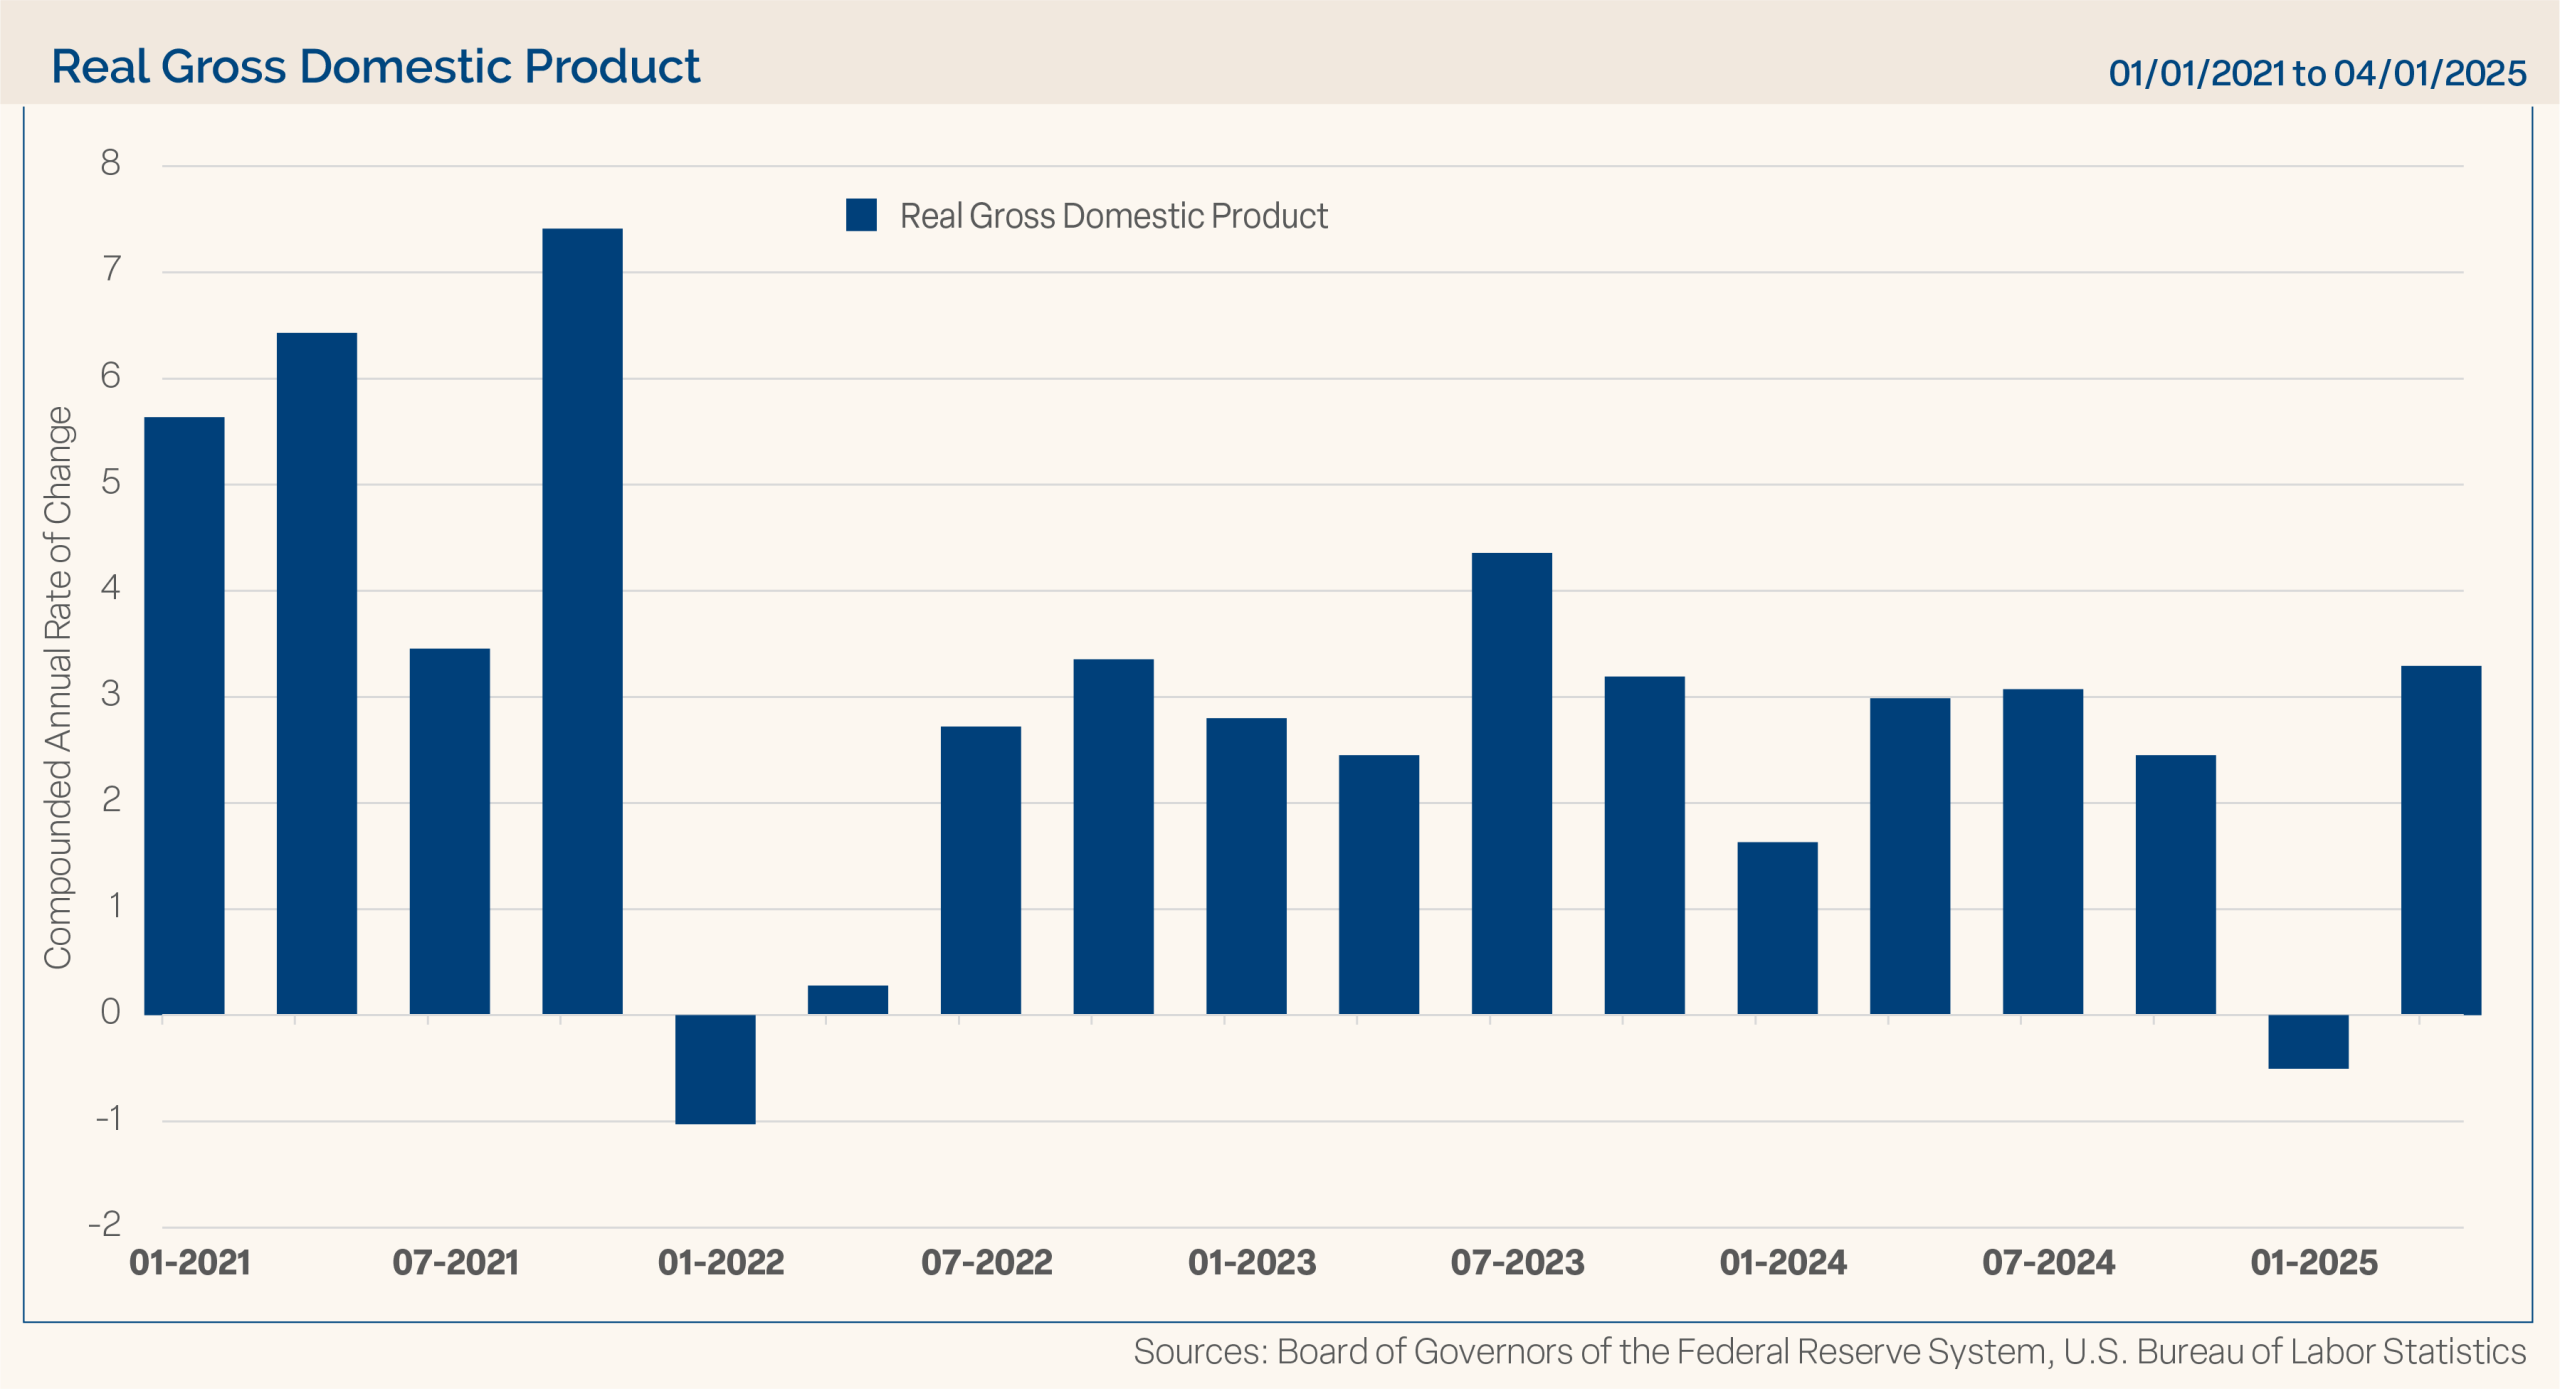
The Atlanta Fed GDP Now estimate shows expected Q3 2025 GDP to come in at a 3.5% annualized pace (as of 8/29/25). We at Clark Capital lowered our GDP expectation for 2025 to 1.5%, but we still stand firmly in the camp of expecting economic growth this year and believe a recession is a low probability event. Chart 3 shows recent GDP readings and the whipsaw in GDP during the first part of this year. After starting the year with the first negative GDP reading since Q1 2022, the rebound in the second quarter was the strongest growth since Q3 2023. Keep in mind that both readings were distorted by swings in imports.
Chart 3
Consumer Confidence: Not surprisingly, consumer confidence readings have moved off their lows from April and May when tariff concerns were dominating the news. As stocks have reached new highs and tariff fears have ameliorated, confidence has risen, but consumers still seem to have some lingering concerns. In April and May, the University of Michigan consumer sentiment reading fell dramatically hitting a level of 52.2 – a level rarely seen by this measure in its history. It bounced back nicely to 60.7 in its final reading for June, and it rose again to 61.7 in July. However, it stalled in August and moved down to 58.6 on a preliminary basis, which was lower than expectations of 62.0 and the prior month. The final reading for August came in at 58.2, reflecting moderating consumer confidence.
Other Economic Data Points: The ISM Manufacturing Index for July languished again with a reading of 48.0, which was below expectations of 49.5 and June’s mark of 49.0. The ISM Non-Manufacturing Index, which covers the much larger service industries in the U.S. economy, barely held on to a 50 or greater reading (the dividing line between expansion and contraction for the ISM indices) with a reading of 50.1. Expectations called for a higher level of expansion of 51.5, which would have been an improvement from the prior month’s level of 50.8. The slowing manufacturing and non-manufacturing activity that has developed recently is another likely side effect of tariff uncertainty. It also points to the vital role consumer spending has played in our economy as manufacturing has languished in recent years.
Housing data for July was mixed, but it leaned more positive. After a late May move higher in rates, the 10-year U.S. Treasury yield has been trending lower in recent months, which has likely aided recent housing stabilization. Housing starts, existing home sales, and new home sales all surpassed expectations in July. The preliminary building permits number was the only one of this group to miss expectations.
The leading economic indicators index fell by -0.1% in July as expected after coming off a -0.3% drop in June. Retail sales (ex auto and gas) were a bit light at a 0.2% monthly gain compared to an expected 0.3% advance; however, the prior month’s reading was revised to show stronger monthly growth of 0.8% compared to the initial reading of 0.6%. Retail sales data is not inflation adjusted, so that needs to be understood when reviewing this data.
Markets have proven to be strong since the tariff selloff lows. In what has been a rather unloved rally, stocks have successfully climbed the “wall of worry” as major equity indices have made new highs. Clarity around some of the tariff negotiations seems to be calming the markets, but many actual tariffs are now in effect, and their impact will be felt in the months ahead. Volatility came back in the first part of 2025 and while not welcome, it was understandable following two years of solid stock market returns and a new administration getting up and running. Volatility is a normal part of participating in the equity markets.
Bonds, for the most part, have done their job in 2025 by helping to offset a choppy stock market and providing solid gains year to date. Even munis, the laggard in bonds, have made solid gains recently. We believe the economy will grow in 2025, but at a more subdued pace than we thought to begin the year. The Fed looks poised to resume rate cuts later this year, especially after the speech by Fed Chair Powell in Jackson Hole. The weak job market report released on August 1 seems to have pushed the Fed closer to a rate cut move, and the market is expecting that course of action. Stock valuations have crept higher but not to an alarming level in our opinion, as earnings expectations have picked up once again in reaction to strong second quarter earnings and are now at record highs. We still see opportunities in the stock market during the second half of 2025 and elevated bond yields provide opportunities in fixed income as well. As always, we believe it is imperative for investors to stay focused on their long-term goals and not let short-term swings in the market derail them from their longer-term objectives.
Economic Data
| Event | Period | Estimate | Actual | Prior | Revised |
| ISM Manufacturing | July | 49.5 | 48 | 49 | — |
| ISM Services Index | July | 51.5 | 50.1 | 50.8 | — |
| Change in Nonfarm Payrolls | July | 105k | 73k | 147k | 14k |
| Unemployment Rate | July | 4.20% | 4.20% | 4.10% | — |
| Average Hourly Earnings YoY | July | 3.80% | 3.90% | 3.70% | 3.80% |
| JOLTS Job Openings | June | 7500k | 7437k | 7769k | 7712k |
| PPI Final Demand MoM | July | 0.20% | 0.90% | 0.00% | — |
| PPI Final Demand YoY | July | 2.50% | 3.30% | 2.30% | 2.40% |
| PPI Ex Food and Energy MoM | July | 0.20% | 0.90% | 0.00% | — |
| PPI Ex Food and Energy YoY | July | 3.00% | 3.70% | 2.60% | — |
| CPI MoM | July | 0.20% | 0.20% | 0.30% | — |
| CPI YoY | July | 2.80% | 2.70% | 2.70% | — |
| CPI Ex Food and Energy MoM | July | 0.30% | 0.30% | 0.20% | — |
| CPI Ex Food and Energy YoY | July | 3.00% | 3.10% | 2.90% | — |
| Retail Sales Ex Auto and Gas | July | 0.30% | 0.20% | 0.60% | 0.80% |
| Industrial Production MoM | July | 0.00% | -0.10% | 0.30% | 0.40% |
| Building Permits | July P | 1386k | 1354k | 1393k | __ |
| Housing Starts | July | 1297k | 1428k | 1321k | 1358k |
| New Home Sales | July | 630k | 652k | 627k | 656k |
| Existing Home Sales | July | 3.92m | 4.01m | 3.93m | — |
| Leading Index | July | -0.10% | -0.10% | -0.30% | — |
| Durable Goods Orders | July P | -3.80% | -2.80% | -9.40% | — |
| GDP Annualized QoQ | 2Q S | 3.10% | 3.30% | 3.00% | — |
| U. of Mich. Sentiment | Aug P | 62 | 58.6 | 61.7 | — |
| Personal Income | July | 0.40% | 0.40% | 0.30% | __ |
| Personal Spending | July | 0.50% | 0.50% | 0.30% | 0.40% |
| S&P CoreLogic CS 20-City YoY NSA | June | 2.09% | 2.14% | 2.79% | 2.81% |
Source: Bloomberg; P=Preliminary, T=Thirdly.
For illustrative purposes only. Past performance is not indicative of future results. Neither past actual, projections, nor other
forward looking statements regarding future financial performance of markets are only projections and actual events or results
may differ materially.
Forward looking statements cannot be guaranteed. Past performance is not indicative of future results. The opinions referenced are as of the date of publication and are subject to change due to changes in the market or economic conditions and may not necessarily come to pass. Material presented has been derived from sources considered to be reliable and has not been independently verified by us or our personnel. Nothing herein should be construed as a solicitation, recommendation or an offer to buy, sell or hold any securities, other investments or to adopt any investment strategy or strategies. Investors must make their own decisions based on their specific investment objectives and financial circumstances. Investing involves risk, including loss of principal.
Clark Capital Management Group is an investment adviser registered with the U.S. Securities and Exchange Commission. Registration does not imply a certain level of skill or training. More information about Clark Capital Management Group’s advisory services can be found in its Form ADV and/or Form CRS, which is available upon request.
The manager utilizes a proprietary investment model to assist with the construction of the strategy and to assist the manager with making investment decisions. Investments selected using this process may perform differently than expected as a result of the factors used in the model, the weight placed on each factor, and changes from the factors’ historical trends. There is no guarantee that Clark Capital’s use of a model will result in effective investment decisions.
Fixed income securities are subject to certain risks including, but not limited to: interest rate (changes in interest rates may cause a decline in market value or an investment), credit, prepayment, call (some bonds allow the issuer to call a bond for redemption before it matures), and extension (principal repayments may not occur as quickly as anticipated, causing the expected maturity of a security to increase).
Non-investment-grade debt securities (high-yield/junk bonds) may be subject to greater market fluctuations, risk of default or loss of income and principal than higher-rated securities.
The value of investments, and the income from them, can go down as well as up and you may get back less than the amount invested.
Equity securities are subject to price fluctuation and possible loss of principal. Stock markets tend to move in cycles, with periods of rising prices and periods of falling prices. Certain investment strategies tend to increase the total risk of an investment (relative to the broader market). Strategies that concentrate their investments in limited sectors are more vulnerable to adverse market, economic, regulatory, political, or other developments affecting those sectors.
JOLTS is a monthly report by the Bureau of Labor Statistics (BLS) of the U.S. Department of Labor counting job vacancies and separations, including the number of workers voluntarily quitting employment.
The Core Consumer Price Index (CPI) is a measure of the average change over time in the prices paid by urban consumers for a market basket of consumer goods and services.
The Core Producer Price Index (PPI) program measures the average change over time in the selling prices received by domestic producers for their output. The prices included in the PPI are from the first commercial transaction for many products and some services.
The PCE price index, released each month in the Personal Income and Outlays report, reflects changes in the prices of goods and services purchased by consumers in the United States.
References to market or composite indices, benchmarks or other measures of relative market performance over a specified period of time (each, an “index”) are provided for your information only. Reference to an index does not imply that the portfolio will achieve returns, volatility or other results similar to that index. The composition of the index may not reflect the manner in which a portfolio is constructed in relation to expected or achieved returns, portfolio guidelines, restrictions, sectors, correlations, concentrations, volatility or tracking error targets, all of which are subject to change.
Investors cannot invest directly in an index.
The Dow Jones Industrial Average® (The Dow®), is a price-weighted measure of 30 U.S. blue-chip companies. The index covers all industries except transportation and utilities.
The Bloomberg Barclays U.S. Municipal Index covers the USD-denominated long-term tax exempt bond market. The index has four main sectors: state and local general obligation bonds, revenue bonds, insured bonds and prerefunded bonds.
The Bloomberg US Treasury Index measures US dollar-denominated, fixed-rate, nominal debt issued by the US Treasury. Treasury bills are excluded by the maturity constraint, but are part of a separate Short Treasury Index.
The NASDAQ Composite is a stock market index of the common stocks and similar securities listed on the NASDAQ stock market.
The S&P 500 measures the performance of the 500 leading companies in leading industries of the U.S. economy, capturing 80% of U.S. equities.
The S&P 500® Equal Weight Index (EWI) is the equal-weight version of the widely-used S&P 500. The index includes the same constituents as the capitalization weighted S&P 500, but each company in the S&P 500 EWI is allocated a fixed weight or 0.2% of the index total at each quarterly rebalance.
The University of Michigan Consumer Sentiment Index rates the relative level of current and future economic conditions. There are two versions of this data released two weeks apart, preliminary and revised. The preliminary data tends to have a greater impact. The reading is compiled from a survey of around 500 consumers.
The Russell 1000 Index is a stock market index that tracks the highest- ranking 1,000 stocks in the Russell 3000 Index, which represent about 93% of the total market capitalization of that index.
The Russell 2000 Index is a small-cap stock market index that represents the bottom 2,000 stocks in the Russell 3000.
The Russell 3000 Index measures the performance of the 3,000 largest U.S. companies based on total market capitalization, which represents approximately 98% of the investable U.S. equity market.
Russell 1000 Growth Index tracks companies with higher price-to-book ratios, higher sales per share growth, and higher I/B/E/S forecast growth.
Russell 1000 Value Index tracks companies with lower price-to-book ratios and lower expected and historical growth rates. Russell’s value indexes focus more on dividend yield.
Nonfarm payrolls (NFPs) are the measure of the number of workers in the United States excluding farm workers and workers in a handful of other job classifications.
A municipal bond, commonly known as a muni, is a bond issued by state or local governments, or entities they create such as authorities and special districts.
The CBOE Volatility Index (VIX) is a real-time index that measures the expected volatility of the S&P 500 over the next 30 days.
The U.S. Treasury index is based on the recent auctions of U.S. Treasury bills. Occasionally it is based on the U.S. Treasury’s daily yield curve.
The 30 Year Treasury Rate is the yield received for investing in a US government issued treasury security that has a maturity of 30 years.
The Bloomberg Barclays U.S. Corporate High-Yield Index covers the U.S. dollar-denominated, non-investment grade, fixed-rate, taxable corporate bond market. Securities are classified as high-yield if the middle rating of Moody’s, Fitch, and S&P is Ba1/BB+/BB+ or below.
The Bloomberg Barclays U.S. Credit Index measures the investment grade, U.S. dollar denominated, fixed-rate taxable corporate and government related bond markets.
The Bloomberg Aggregate Bond Index or “the Agg” is a broad-based fixed-income index used by bond traders and the managers of mutual funds and exchange-traded funds (ETFs) as a benchmark to measure their relative performance.
The Bloomberg US Trsy Bellwether 30Y is a U.S. Treasury debt obligation that has a maturity of 30 years.
The ISM Non-Manufacturing Index is an index based on surveys of more than 400 non-manufacturing firms’ purchasing and supply executives, within 60 sectors across the nation, by the Institute of Supply Management (ISM). The ISM Non-Manufacturing Index tracks economic data, like the ISM Non-Manufacturing Business Activity Index. A composite diffusion index is created based on the data from these surveys, that monitors economic conditions of the nation.
ISM Manufacturing Index measures manufacturing activity based on a monthly survey, conducted by Institute for Supply Management (ISM), of purchasing managers at more than 300 manufacturing firms.
The MSCI Emerging Markets Index captures large and mid cap representation across 27 Emerging Markets (EM) countries.
The MSCI ACWI ex USA Index captures large and mid cap representation across 22 of 23 Developed Markets (DM) countries (excluding the US) and 27 Emerging Markets (EM) countries*. With 2,359 constituents, the index covers approximately 85% of the global equity opportunity set outside the US.
The S&P CoreLogic Case-Shiller 20-City Composite Home Price NSA Index seeks to measures the value of residential real estate in 20 major U.S. metropolitan areas. The U.S. Treasury index is based on the recent auctions of U.S. Treasury bills. Occasionally it is based on the U.S. Treasury’s daily yield curve.
The Leading Economic Index provides an early indication of significant turning points in the business cycle and where the economy is heading in the near term.
In the United States, the Core Personal Consumption Expenditure Price (CPE) Index provides a measure of the prices paid by people for domestic purchases of goods and services, excluding the prices of food and energy.
The Conference Board’s Leading Indexes are the key elements in an analytic system designed to signal peaks and troughs in the business cycle. The leading, coincident, and lagging economic indexes are essentially composite averages of several individual leading, coincident, or lagging indicators. They are constructed to summarize and reveal common turning point patterns in economic data in a clearer and more convincing manner than any individual component – primarily because they smooth out some of the volatility of individual components.
Gross domestic product (GDP) is the standard measure of the value added created through the production of goods and
services in a country during a certain period.