
Bonds Gain, While Late-Month Weakness Takes Stocks Lower
HIGHLIGHTS:
- Stocks: The S&P 500 reached a new all-time high in late February. However, stocks moved lower from that point, which pushed February results into the red.
- Bonds: As stocks declined in February, bonds gained as rates fell rather sharply. After rising to around 4.8% in early January, the 10-year U.S. Treasury yield closed February at 4.24%.
- U.S. Economy: Economic data released in February (largely covering January) showed ongoing signs of economic growth, but some concerns around the consumer emerged. Consumer confidence readings fell driven in part by concerns of ongoing inflation issues.
- Federal Reserve: After the FOMC left policy rates unchanged in January, no meeting occurred in February. The market is expecting a slower rate-cut cycle in 2025 with three expected cuts. (Per CME FedWatch tool as of 3/3/25.)
EQUITY MARKETS
After the S&P 500 hit a new all-time high on February 19, U.S. stocks slid lower and ended the month in negative territory. However, the S&P 500 is still positive year to date. See Table 1 for February 2025, YTD, and calendar year 2024 results.
Table 1 | Equity Markets
| Index | Feb-25 | YTD | 2024 |
| S&P 500 | -1.30% | 1.44% | 25.02% |
| S&P 500 Equal Weight | -0.61% | 2.87% | 13.01% |
| DJIA | -1.39% | 3.32% | 14.99 |
| Russell 3000 | -1.92% | 1.18% | 23.81% |
| NASDAQ Comp. | -3.91% | -2.31% | 29.57% |
| Russell 2000 | -5.35% | -2.87% | 11.54% |
| MSCI ACWI ex U.S. | 1.39% | 5.47% | 5.53% |
| MSCI Emerging Mkts Net | 0.48% | 2.28% | 7.50% |
Reflecting small caps and large-cap growth being particularly weak, the Russell 2000 and NASDAQ Composite were the hardest hit indices in February and are the two indices down so far this year. The equal-weighted S&P 500 Index outpaced its large-cap weighted counterpart in February on a relative basis, but it was still down for the month. Developed international stocks had a second consecutive positive month of gains. After years of underperformance compared to U.S. stocks, the MSCI ACWI ex. U.S. Index has started the year with the strongest results of the indices measured on Table 1 — nearly matching its results for all of 2024. Emerging market stocks also rose in January and February, but they still lagged developed international markets. Clearly, 2024 turned out to be another year with large-cap growth leadership, but that pocket of the market has struggled to begin 2025.
Fixed Income
The almost relentless rise in rates experienced during the fourth quarter of 2024 and into early January has reversed since that point. The 10-year U.S. Treasury yield ended 2024 and January 2025 at 4.58%. However, that does not tell the whole story as rates rose to start the year and closed at a high of 4.79% on January 13. From that point, rates have fallen sharply and ended February at 4.24%. This decline in rates since those January highs has been a solid tailwind for bond returns. Outside of high yield, all indices in the table below have better returns so far this year compared to all of 2024. See Table 2 for bond index returns for February 2025, YTD, and calendar year 2024.
Table 2 | Fixed Income Markets
| Index | Feb-2025 | YTD | 2024 |
| Bloomberg U.S. Agg | 2.20% | 2.74% | 1.25% |
| Bloomberg U.S. Credit | 2.03% | 2.61% | 2.03% |
| Bloomberg U.S. High Yld | 0.67% | 2.05% | 8.19% |
| Bloomberg Muni | 0.99% | 1.50% | 1.05% |
| Bloomberg 30-year U.S. TSY | 5.59% | 5.76% | -8.09 |
| Bloomberg U.S. TSY | 2.16% | 2.68% | 0.58% |
Source: Morningstar. For illustrative purposes only. Past performance is not indicative of future results. Indexes are unmanaged and have been provided for comparison purposes only. No fees or expenses are reflected. You cannot invest directly in an index.
In February, the more rate sensitive pockets of bonds, like U.S. Treasuries, had the strongest returns as rates fell sharply. High-yield bonds had some of the strongest results last year and in January, but those returns moderated in February, and they lagged other areas of the bond market. In our 2025 outlook, we put an upper end range on the 10-year U.S. Treasury yield at 5%. Clearly, we did not hit that level early in January, but yields were moving in that direction until the mid-month reversal. We believe rates on the front end of the yield curve will be pressured lower as the Fed (albeit more slowly) cuts rates. Longer rates will remain more volatile, but with broader pressure as well to the downside. Overall, the decline in rates has set up a solid backdrop for bond returns to begin 2025.
We maintain our long-standing position favoring credit versus pure rate exposure in this interest rate environment. We also believe the role bonds play in a portfolio — to provide stable cash flow and to help offset the volatility of stocks in the long run — has not changed. Furthermore, we believe that bond yields remain attractive. In our opinion, having an active bond management approach makes sense in these volatile times.
Economic Data Highlights and Outlook
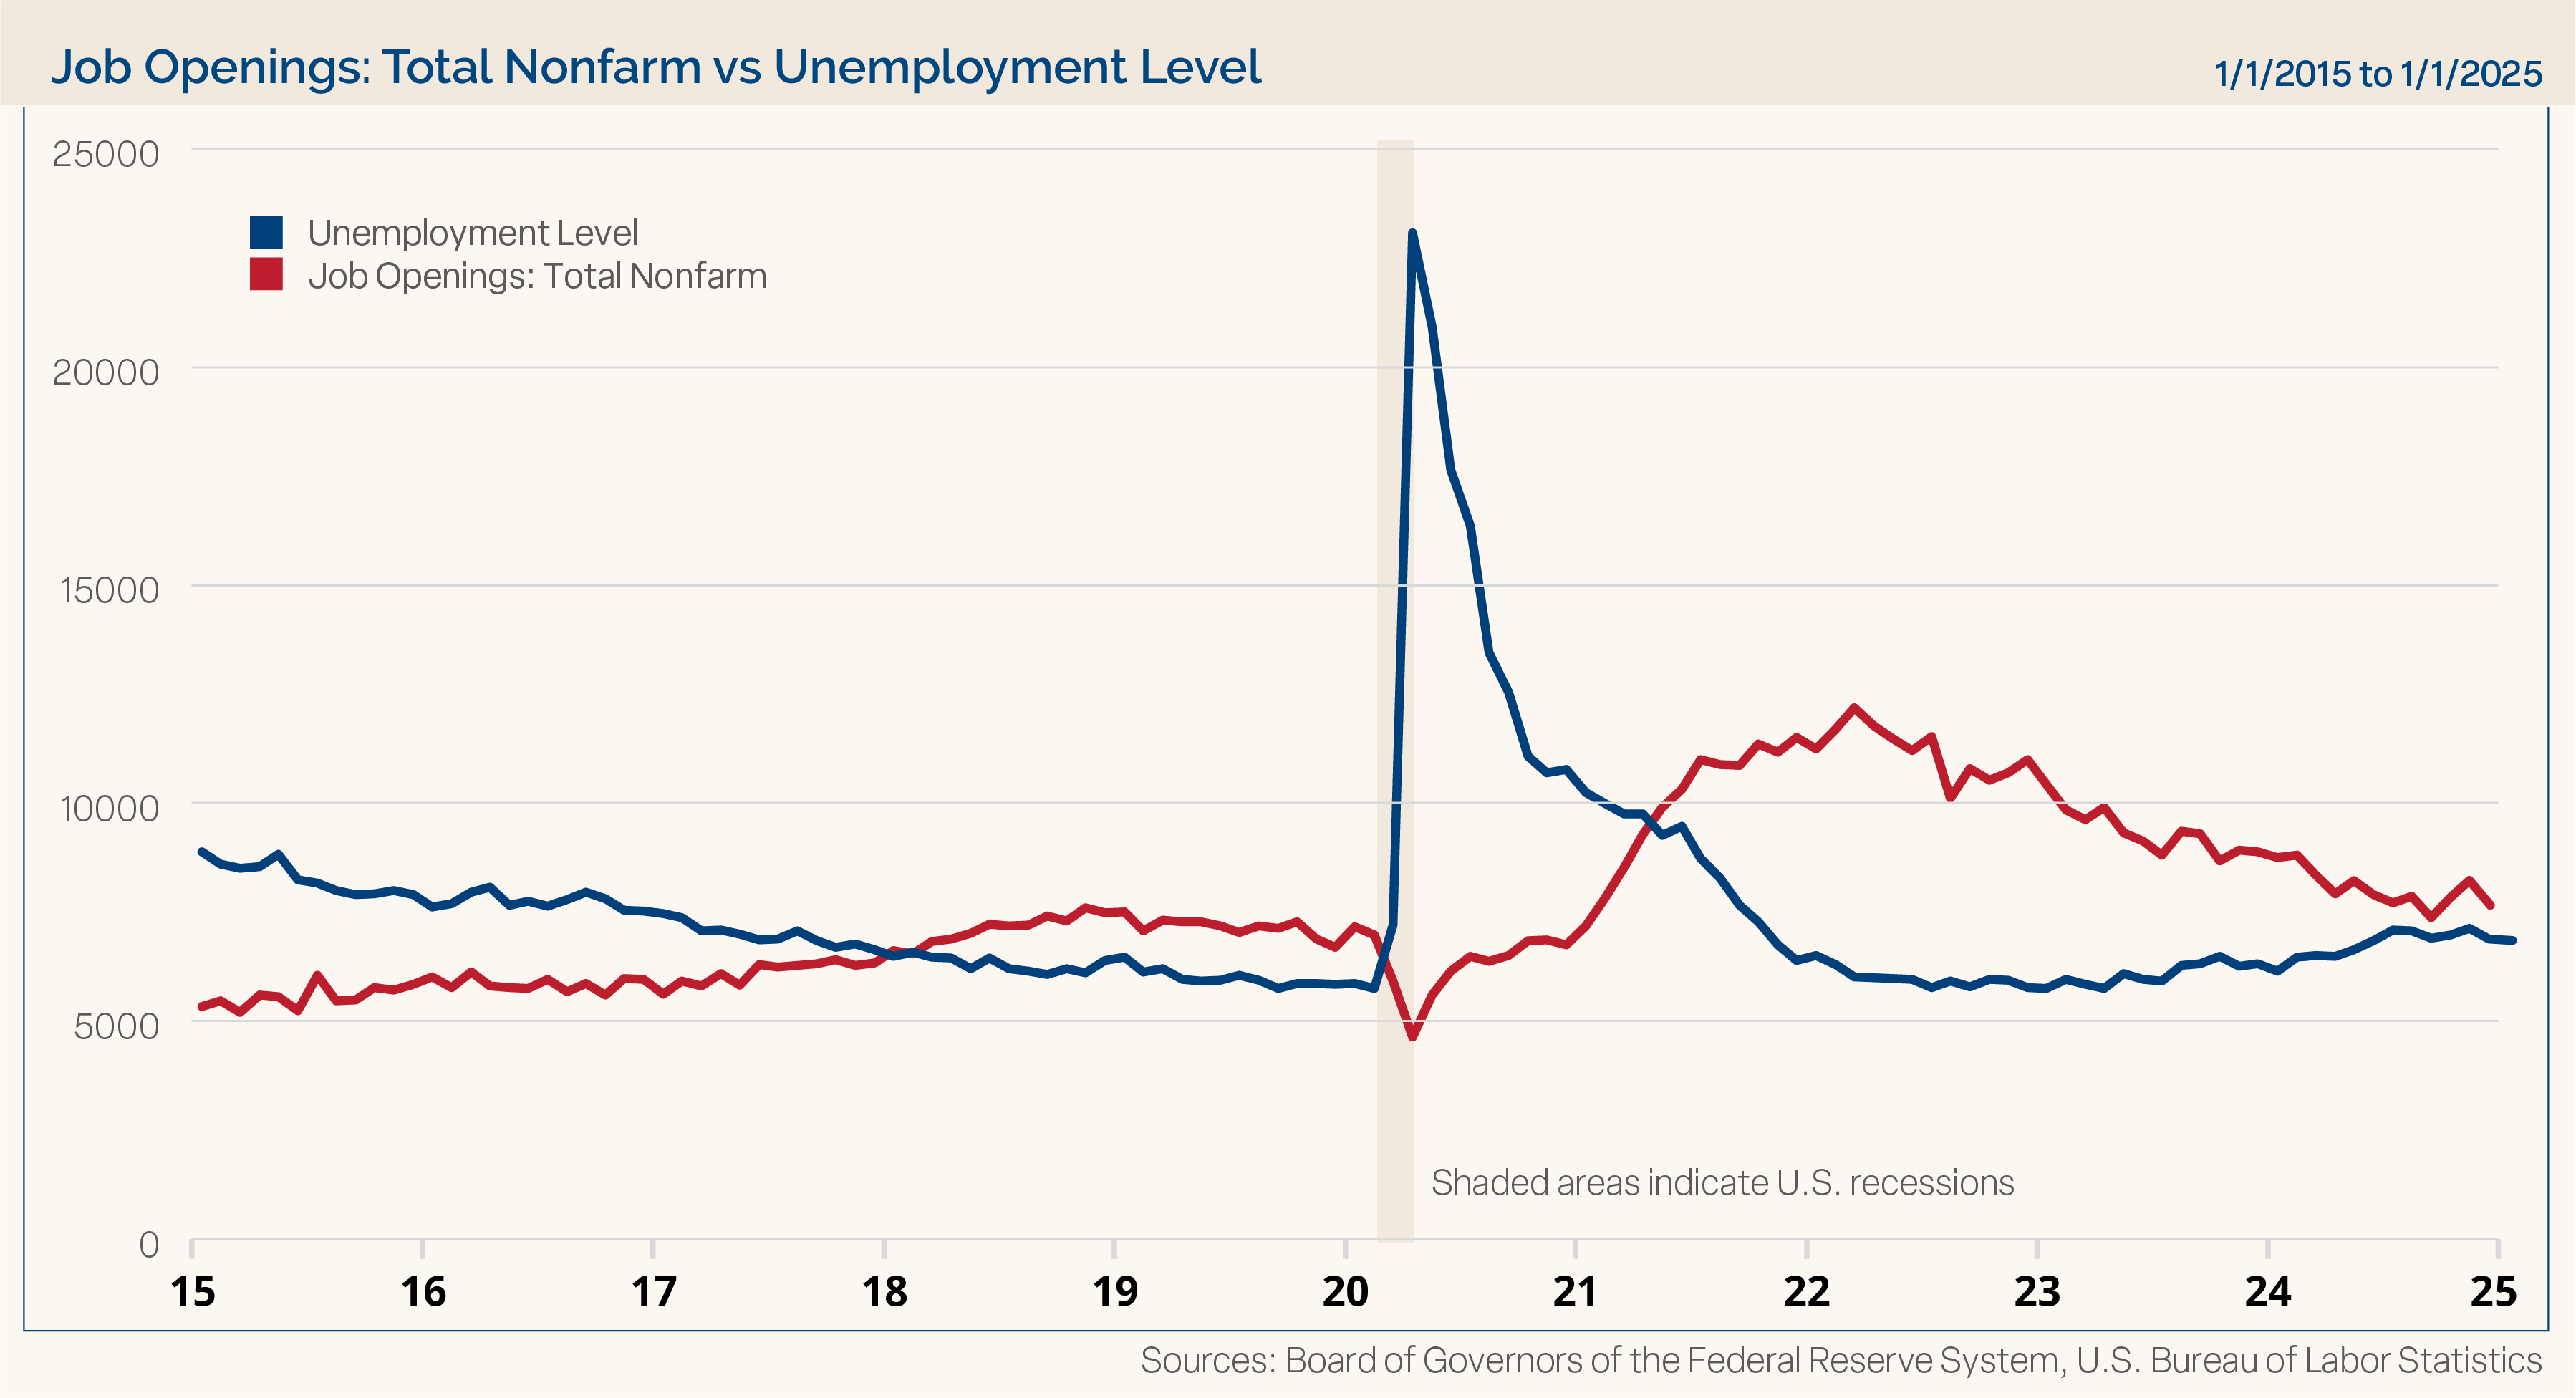
Jobs: Nonfarm payroll additions were weaker than expected to start the new year. At 143,000 additions, this reading was below expectations of 175,000 for January. However, job gains were revised higher for December to 307,000 compared to the initial reading of 256,000. The unemployment rate fell unexpectedly to 4.0% from its prior month level of 4.1%. One data point we are monitoring is job openings compared to the unemployment level. Job openings fell to 7.6 million in December compared to expectations of 8.0 million and the prior month’s level of 8.156 million. The unemployment level in January was below 6.9 million, so we still have a condition where there are more job openings than unemployed people in the U.S., but that ratio has closed over the last few years. Chart 1 shows the number of unemployed compared to the number of job openings in the U.S.
Chart 1
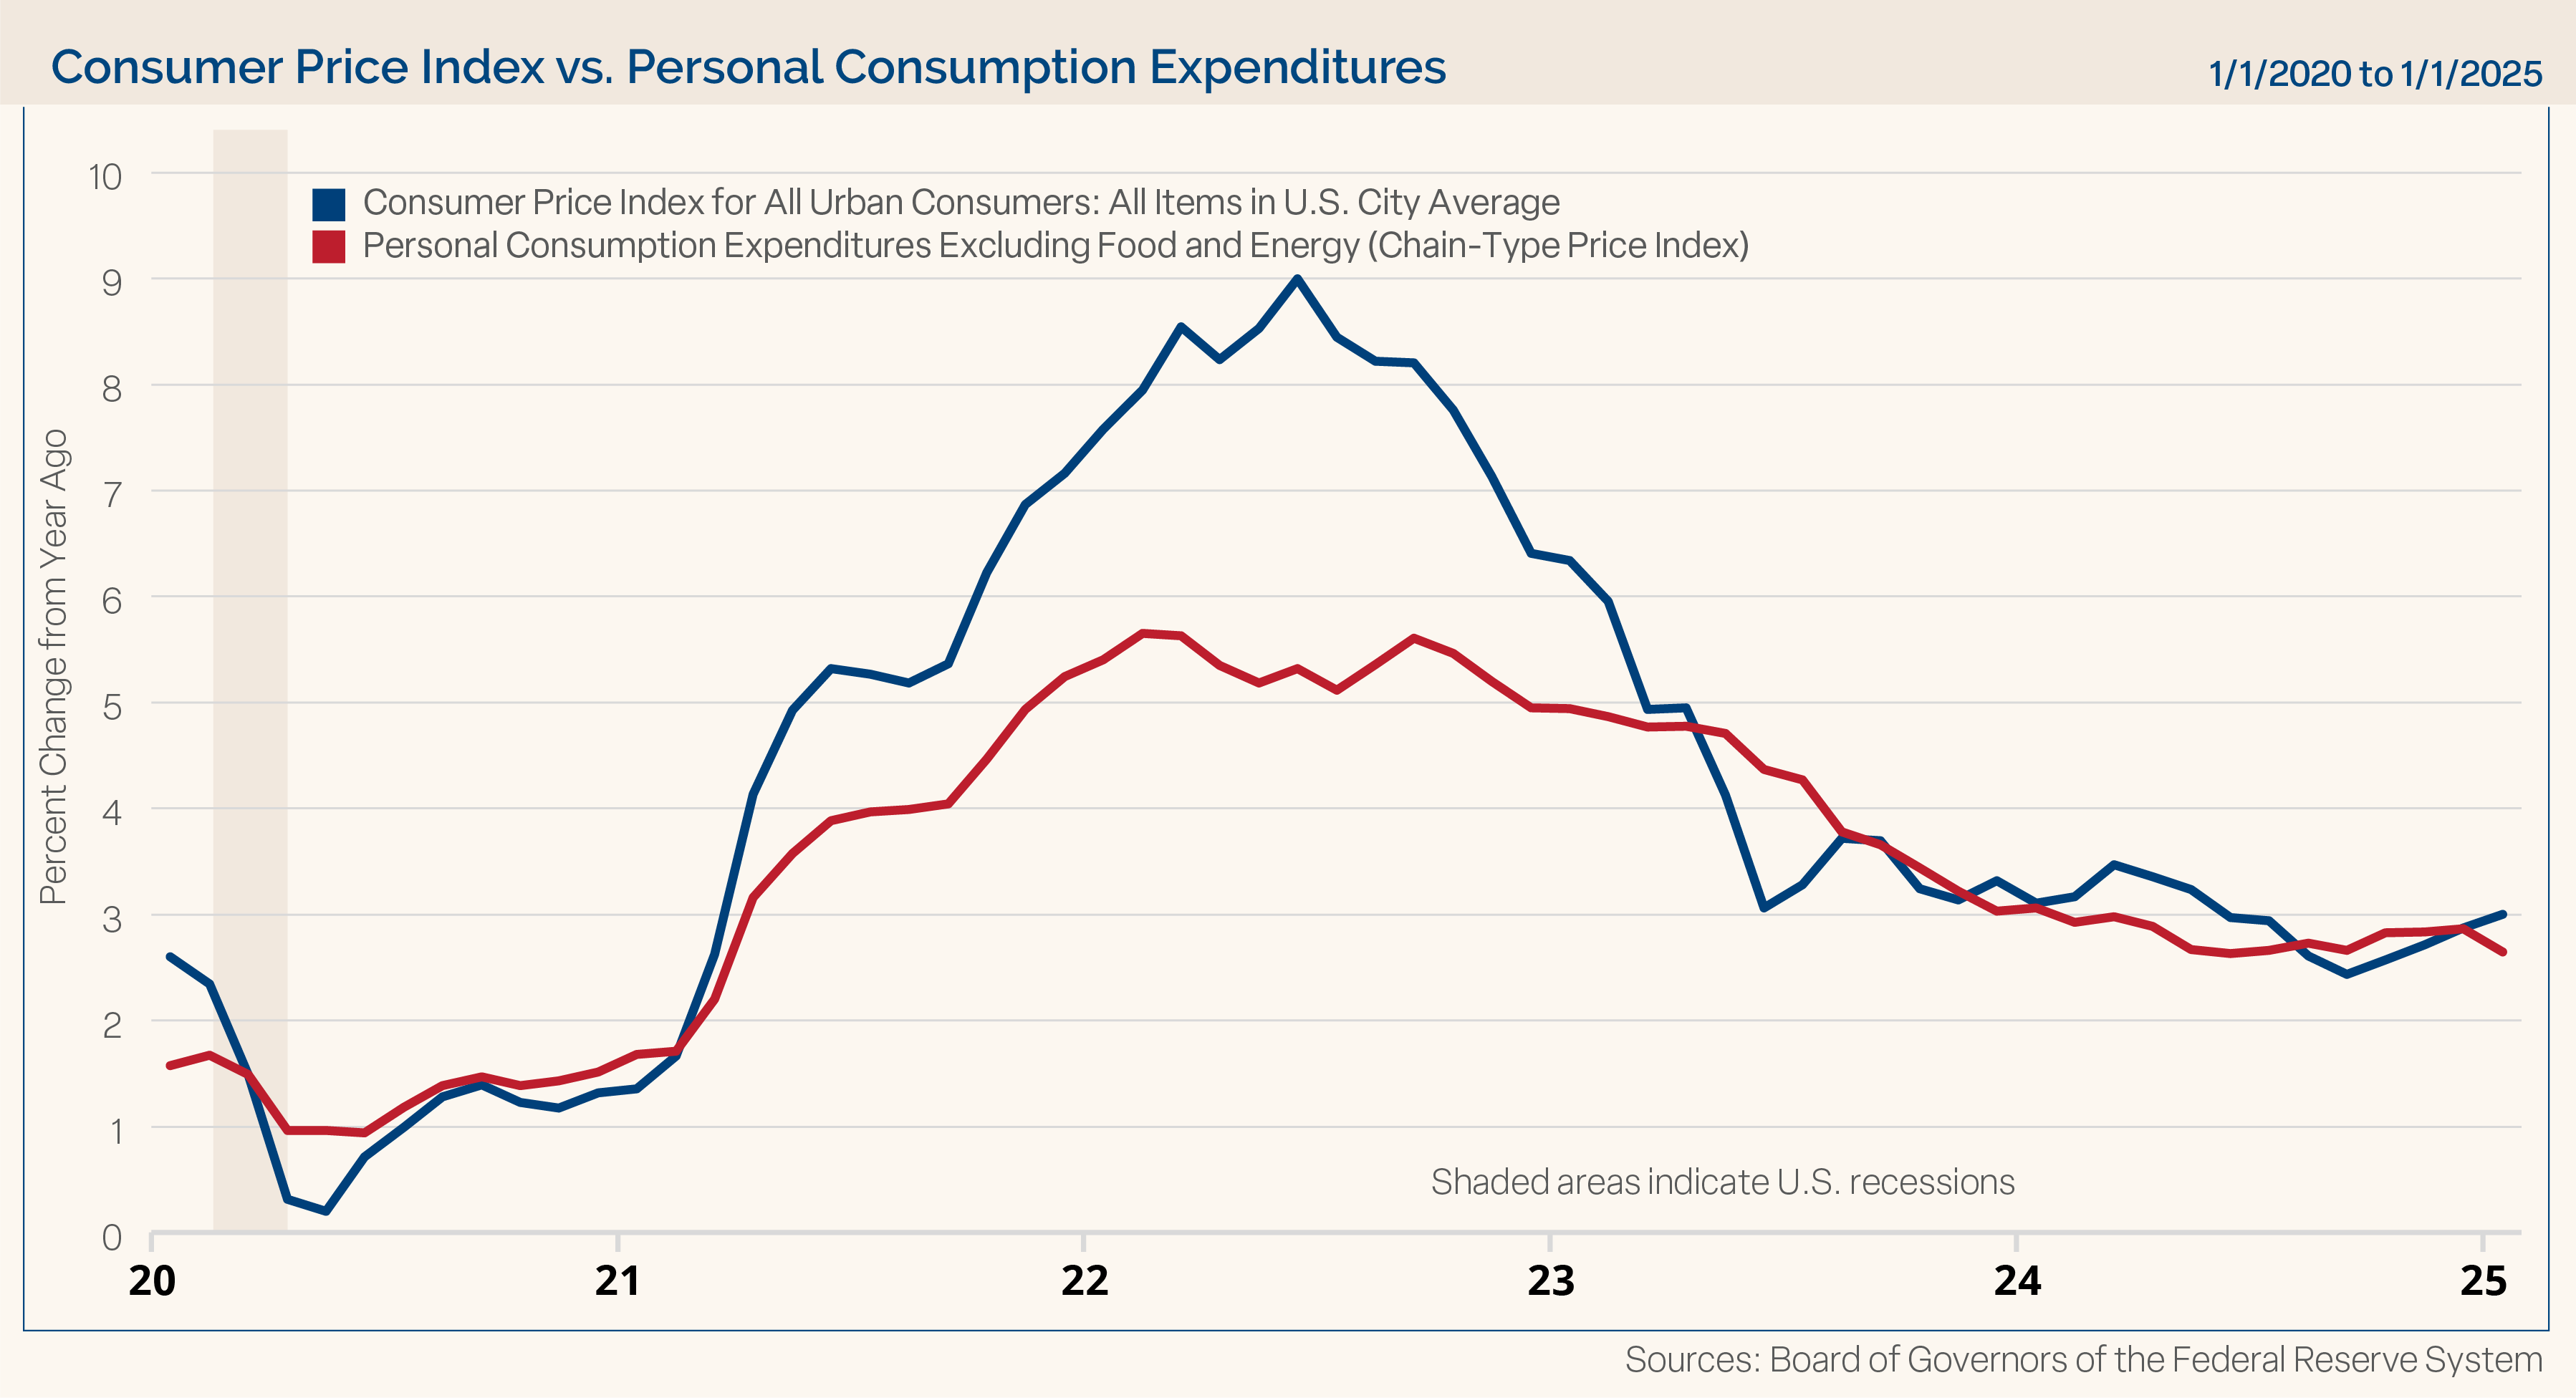
Inflation: January inflation data, released in the first half of February, was hotter than expected. The consumer price index (CPI) was higher at both a headline and core level in January on a month-over-month and year-over-year basis. The producer price index (PPI) was higher on a headline basis for the month (in line with the core ), and the year-over-year readings exceeded expectations as well. Notably, prior month readings were revised rather meaningfully higher across the board for the PPI as well. However, the Personal Consumption Expenditure (PCE) price index – the preferred inflation measure of the Fed — was in line with expectations on a core and headline basis for both the annual and monthly readings. The core PCE price index reading fell to 2.6% on a year-over-year basis in January, which was better than the prior month at a revised 2.9%. The headline PCE price index annual reading declined to 2.5% for January from 2.6% the prior month. (For more specific data, please refer to the end of this report.)
Overall, we believe inflation continues to make progress toward the Fed’s ultimate stated goal of around 2% for the core PCE price index reading. We expect this path to be bumpy, but we believe the trend continues to show progress. Readings last month were also bumpy, and we will get those types of data points from time to time. Tariff talk, the price of eggs and other headlines have dominated recently and have spurred inflation fears, but we will wait to see if a real change in trend develops when it comes to inflation progress. Chart 2 shows the core CPI and PCE price indices.
Chart 2
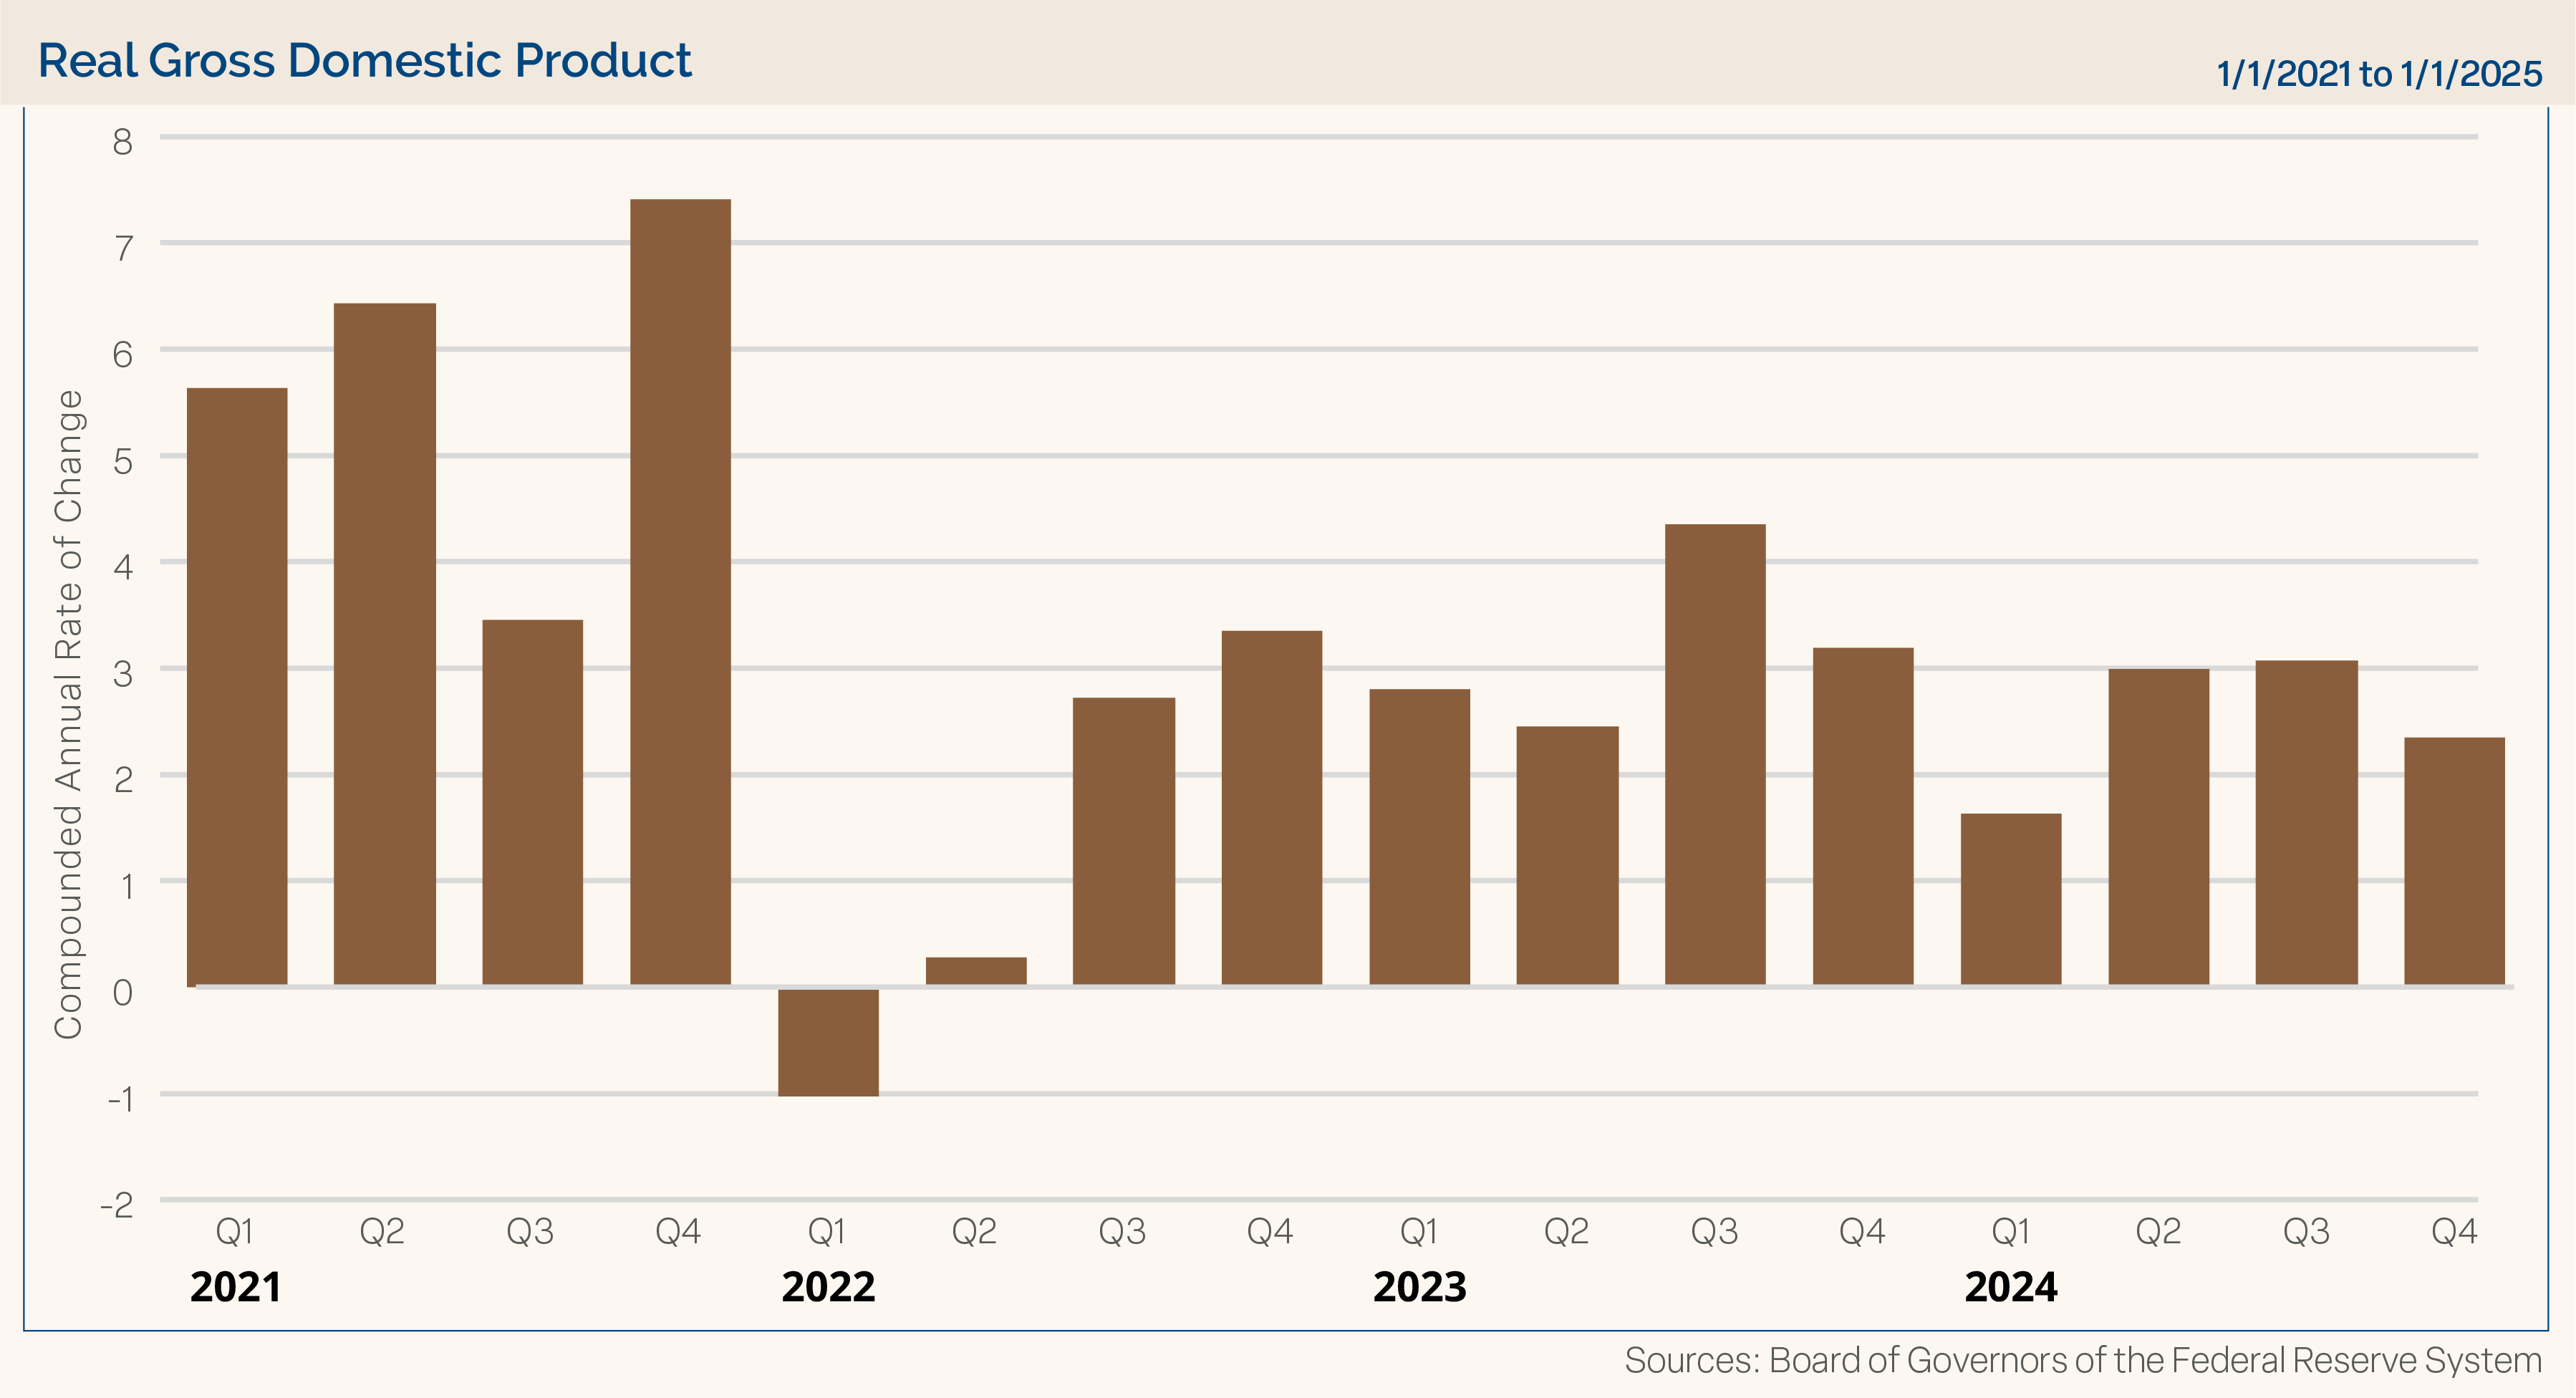
GDP: The second reading of Q4 2024 GDP came in as expected at 2.3%. The Atlanta Fed GDP Now estimate for the first quarter 2025 reading stands at a -2.8% decline (as of 3/3/25). This reading has been very volatile to start the year. After an initial estimated reading of 2.9%, it rose to 3.9% only to have negative readings over the last two updates. Clark Capital expects GDP growth to be around 2.5% in 2025 — likely slower than the growth we had in 2024 but still above our long-term trend expectation in the low 2% range. Chart 3 shows GDP readings from 2021 through the second estimate of Q4 2024.
Chart 3
Other Economic Data Points: The ISM Manufacturing reading for January was 50.9, surpassing estimates of 50.0 and moving into expansion territory for the first time in more than two years. A month is not a trend, but it was a welcome sign to see this reading indicate the manufacturing sector is expanding. The ISM Manufacturing reading stayed above 50 at 50.3 for February, but below expectations of 50.7. The ISM Non-Manufacturing Index, which covers the much larger service industries in the U.S. economy, disappointed with a reading of 52.8 compared to estimates of 54.0, but this reading stayed comfortably in expansion territory above 50.
Housing, which has faced a headwind from higher rates in recent months, was somewhat mixed based on data reported in February. Existing home sales, new home sales and housing starts fell below expectations in January. However, building permits were better than expected. Housing starts, new and existing home sales for December were all revised higher compared to initial estimates. Interest rates dropped meaningfully since their 2025 highs from early January, and it will be interesting to see if housing gets a tailwind from lower rates in the months ahead.
Retail sales (ex. auto and gas) fell sharply in January by -0.5% when a gain of 0.3% was expected. The preliminary University of Michigan Sentiment reading for January fell to 67.8 compared to expectations of 71.8. Consumers appeared less confident about conditions coming into the new year, and that was reflected in both what they said (confidence readings) and what they did (retail spending). In particular, higher inflation expectations impacted the consumer confidence reading, which for the 1-year inflation expectation rose from 3.3% to 4.3%. This trend will be important to monitor with consumer spending having a central role in the U.S. economy. The Conference Board’s Leading Index at -0.3% was worse than expectations of -0.1%, although December data was revised to show a 0.1% increase compared to the prior reading of a -0.1% decline.
Late February and early March ushered in some volatility to the stock market. Tariff talk and ongoing inflation concerns appear to be sending confidence lower, and markets have reacted to this development. We will monitor what policies are implemented and how the market and economy react to those policies in 2025, but chasing news headlines is ill-advised in a very fluid environment. Focusing on market fundamentals, we are seeing an economy that we believe is growing at a solid clip, a Fed that is cutting interest rates, a fairly reasonably valued stock market, and S&P 500 companies that are expected to grow their earnings in 2025 and 2026. We like that fundamental backdrop. As always, we believe it is imperative for investors to stay focused on their long-term goals and not let short-term swings in the market derail them from their longer-term objectives.
Clark Capital’s Top-Down, Quantitative Strategies
Credit has handled the market turbulence in stride. High yield bond indices ended the month at new all-time highs, credit spreads remain contained, and financial conditions have eased, with Treasury yields and the dollar declining. The credit models that drive our tactical models, including Fixed Income Total Return and Global Tactical, remain risk-on and those strategies are positioned accordingly.
Clark Capital’s Bottom-Up, Fundamental Strategies
Despite the macro drama coming from Washington, D.C., corporate earnings have come in strong. Over 97% of the S&P 500 Index reported, with 75% reporting positive EPS surprises and 63% positive revenue surprises. Year to date through February 18, more than 80 S&P 500 Index companies announced dividend increases. Our equity portfolios continue holding companies we view as anti-fragile and that continue to see strong business momentum. The largest sector weights across our equity portfolios remain Technology and Financial Services.
Within the Taxable Bond portfolio, we focused on extending the overall duration of the strategy. The reinvesting of maturities and coupon payments into 5-year and longer bonds continued. With rates expected to remain in this lower range for the foreseeable future, we believe this reinvestment will position the portfolio well over the next few months.
ECONOMIC DATA
| Event | Period | Estimate | Actual | Prior | Revised |
| ISM Manufacturing | Jan | 50.0 | 50.9 | 49.3 | 49.2 |
| ISM Services Index | Jan | 54.0 | 52.8 | 54.1 | 54 |
| Change in Nonfarm Payrolls | Jan | 175k | 143k | 256k | 307k |
| Unemployment Rate | Jan | 4.1% | 4.0% | 4.1% | — |
| Average Hourly Earnings YoY | Jan | 3.8% | 4.1% | 3.9% | 4.1% |
| JOLTS Job Openings | Dec | 8000k | 7600k | 8098k | 8156k |
| PPI Final Demand MoM | Jan | 0.3% | 0.4% | 0.2% | 0.5% |
| PPI Final Demand YoY | Jan | 3.3% | 3.5% | 3.3% | 3.5% |
| PPI Ex Food and Energy MoM | Jan | 0.3% | 0.3% | 0.0% | 0.4% |
| PPI Ex Food and Energy YoY | Jan | 3.3% | 3.6% | 3.5% | 3.7% |
| CPI MoM | Jan | 0.3% | 0.5% | 0.4% | — |
| CPI YoY | Jan | 2.9% | 3.0% | 2.9% | — |
| CPI Ex Food and Energy MoM | Jan | 0.3% | 0.4% | 0.2% | — |
| CPI Ex Food and Energy YoY | Jan | 3.1% | 3.3% | 3.2% | — |
| Retail Sales Ex Auto and Gas | Jan | 0.3% | -0.5% | 0.3% | 0.5% |
| Industrial Production MoM | Jan | 0.3% | 0.5% | 0.9% | 1.0% |
| Building Permits | Jan P | 1460k | 1483k | 1482k | — |
| Housing Starts | Jan | 1390k | 1366k | 1499k | 1515k |
| New Home Sales | Jan | 680k | 657k | 698k | 734k |
| Existing Home Sales | Jan | 4.13m | 4.08m | 4.24m | 4.29m |
| Leading Index | Jan | -0.1% | -0.3% | -0.1% | 0.1% |
| Durable Goods Orders | Jan P | 2.0% | 3.1% | -2.2% | -1.8% |
| GDP Annualized QoQ | 4Q S | 74 | 73.2 | 74 | — |
| U. of Mich. Sentiment | Feb P | 71.8 | 67.8 | 71.1 | — |
| Personal Income | Jan | 0.4% | 0.9% | 0.4% | — |
| Personal Spending | Jan | 0.2% | -0.2% | 0.7% | 0.8% |
| S&P CoreLogic CS 20-City YoY NSA | Dec | 4.41% | 4.48% | 4.33% | 4.35% |
—Source: Bloomberg: P=Preliminary
“Forward looking statements cannot be guaranteed. Past performance is not indicative of future results. The opinions referenced are as of the date of publication and are subject to change due to changes in the market or economic conditions and may not necessarily come to pass. Material presented has been derived from sources considered to be reliable and has not been independently verified by us or our personnel. Nothing herein should be construed as a solicitation, recommendation or an offer to buy, sell or hold any securities, other investments or to adopt any investment strategy or strategies. Investors must make their own decisions based on their specific investment objectives and financial circumstances. Investing involves risk, including loss of principal.
Clark Capital Management Group is an investment adviser registered with the U.S. Securities and Exchange Commission. Registration does not imply a certain level of skill or training. More information about Clark Capital Management Group’s advisory services can be found in its Form ADV which is available upon request.
The manager utilizes a proprietary investment model to assist with the construction of the strategy and to assist the manager with making investment decisions. Investments selected using this process may perform differently than expected as a result of the factors used in the model, the weight placed on each factor, and changes from the factors’ historical trends. There is no guarantee that Clark Capital’s use of a model will result in effective investment decisions.
Fixed income securities are subject to certain risks including, but not limited to: interest rate (changes in interest rates may cause a decline in market value or an investment), credit, prepayment, call (some bonds allow the issuer to call a bond for redemption before it matures), and extension (principal repayments may not occur as quickly as anticipated, causing the expected maturity of a security to increase).
Non-investment-grade debt securities (high-yield/junk bonds) may be subject to greater market fluctuations, risk of default or loss of income and principal than higher-rated securities.
The value of investments, and the income from them, can go down as well as up and you may get back less than the amount invested.
Equity securities are subject to price fluctuation and possible loss of principal. Stock markets tend to move in cycles, with periods of rising prices and periods of falling prices. Certain investment strategies tend to increase the total risk of an investment (relative to the broader market). Strategies that concentrate their investments in limited sectors are more vulnerable to adverse market, economic, regulatory, political, or other developments affecting those sectors.
JOLTS is a monthly report by the Bureau of Labor Statistics (BLS) of the U.S. Department of Labor counting job vacancies and separations, including the number of workers voluntarily quitting employment.
The Core Consumer Price Index (CPI) is a measure of the average change over time in the prices paid by urban consumers for a market basket of consumer goods and services.
The Core Producer Price Index (PPI) program measures the average change over time in the selling prices received by domestic producers for their output. The prices included in the PPI are from the first commercial transaction for many products and some services.
The PCE price index, released each month in the Personal Income and Outlays report, reflects changes in the prices of goods and services purchased by consumers in the United States.
References to market or composite indices, benchmarks or other measures of relative market performance over a specified period of time (each, an “index”) are provided for your information only. Reference to an index does not imply that the portfolio will achieve returns, volatility or other results similar to that index. The composition of the index may not reflect the manner in which a portfolio is constructed in relation to expected or achieved returns, portfolio guidelines, restrictions, sectors, correlations, concentrations, volatility or tracking error targets, all of which are subject to change. Investors cannot invest directly in an index.
The Dow Jones Industrial Average® (The Dow®), is a price-weighted measure of 30 U.S. blue-chip companies. The index covers all industries except transportation and utilities.
The Bloomberg Barclays U.S. Municipal Index covers the USD-denominated long-term tax exempt bond market. The index has four main sectors: state and local general obligation bonds, revenue bonds, insured bonds and prerefunded bonds.
The Bloomberg US Treasury Index measures US dollar-denominated, fixed-rate, nominal debt issued by the US Treasury. Treasury bills are excluded by the maturity constraint, but are part of a separate Short Treasury Index.
The NASDAQ Composite is a stock market index of the common stocks and similar securities listed on the NASDAQ stock market.
The S&P 500 measures the performance of the 500 leading companies in leading industries of the U.S. economy, capturing 80% of U.S. equities.
The S&P 500® Equal Weight Index (EWI) is the equal-weight version of the widely-used S&P 500. The index includes the same constituents as the capitalization weighted S&P 500, but each company in the S&P 500 EWI is allocated a fixed weight or 0.2% of the index total at each quarterly rebalance.
The University of Michigan Consumer Sentiment Index rates the relative level of current and future economic conditions. There are two versions of this data released two weeks apart, preliminary and revised. The preliminary data tends to have a greater impact. The reading is compiled from a survey of around 500 consumers.
The Russell 1000 Index is a stock market index that tracks the highest-ranking 1,000 stocks in the Russell 3000 Index, which represent about 93% of the total market capitalization of that index.
The Russell 2000 Index is a small-cap stock market index that represents the bottom 2,000 stocks in the Russell 3000.
The Russell 3000 Index measures the performance of the 3,000 largest U.S. companies based on total market capitalization, which represents approximately 98% of the investable U.S. equity market.
Nonfarm payrolls (NFPs) are the measure of the number of workers in the United States excluding farm workers and workers in a handful of other job classifications.
A municipal bond, commonly known as a muni, is a bond issued by state or local governments, or entities they create such as authorities and special districts.
The CBOE Volatility Index (VIX) is a real-time index that measures the expected volatility of the S&P 500 over the next 30 days.
The U.S. Treasury index is based on the recent auctions of U.S. Treasury bills. Occasionally it is based on the U.S. Treasury’s daily yield curve.
The 30 Year Treasury Rate is the yield received for investing in a US government issued treasury security that has a maturity of 30 years.
The Bloomberg Barclays U.S. Corporate High-Yield Index covers the U.S. dollar-denominated, non-investment grade, fixed-rate, taxable corporate bond market. Securities are classified as high-yield if the middle rating of Moody’s, Fitch, and S&P is Ba1/BB+/BB+ or below.
The Bloomberg Barclays U.S. Credit Index measures the investment grade, U.S. dollar denominated, fixed-rate taxable corporate and government related bond markets.
The Bloomberg Aggregate Bond Index or “the Agg” is a broad-based fixed-income index used by bond traders and the managers of mutual funds and exchange-traded funds (ETFs) as a benchmark to measure their relative performance.
The Bloomberg US Trsy Bellwethers 30Y is a U.S. Treasury debt obligation that has a maturity of 30 years.
The ISM Non-Manufacturing Index is an index based on surveys of more than 400 non-manufacturing firms’ purchasing and supply executives, within 60 sectors across the nation, by the Institute of Supply Management (ISM). The ISM Non-Manufacturing Index tracks economic data, like the ISM Non-Manufacturing Business Activity Index. A composite diffusion index is created based on the data from these surveys, that monitors economic conditions of the nation.
ISM Manufacturing Index measures manufacturing activity based on a monthly survey, conducted by Institute for Supply Management (ISM), of purchasing managers at more than 300 manufacturing firms.
The MSCI Emerging Markets Index captures large and mid cap representation across 27 Emerging Markets (EM) countries.
The MSCI ACWI ex USA Index captures large and mid cap representation across 22 of 23 Developed Markets (DM) countries (excluding the US) and 27 Emerging Markets (EM) countries*. With 2,359 constituents, the index covers approximately 85% of the global equity opportunity set outside the US.
The S&P CoreLogic Case-Shiller 20-City Composite Home Price NSA Index seeks to measures the value of residential real estate in 20 major U.S. metropolitan areas. The U.S. Treasury index is based on the recent auctions of U.S. Treasury bills. Occasionally it is based on the U.S. Treasury’s daily yield curve.
The Leading Economic Index provides an early indication of significant turning points in the business cycle and where the economy is heading in the near term.
In the United States, the Core Personal Consumption Expenditure Price (CPE) Index provides a measure of the prices paid by people for domestic purchases of goods and services, excluding the prices of food and energy.
The Conference Board’s Leading Indexes are the key elements in an analytic system designed to signal peaks and troughs in the business cycle. The leading, coincident, and lagging economic indexes are essentially composite averages of several individual leading, coincident, or lagging indicators. They are constructed to summarize and reveal common turning point patterns in economic data in a clearer and more convincing manner than any individual component – primarily because they smooth out some of the volatility of individual components.
Gross domestic product (GDP) is the standard measure of the value added created through the production of goods and services in a country during a certain period.