
AI Concerns and Rotation Shape Choppy February
HIGHLIGHTS:
- Stocks: Rotation is alive. Large-cap growth was one of the weakest pockets of stocks in February, while other areas advanced. The S&P 500 Index fell, but its equal-weighted counterpart rose, reflecting this rotational trade.
- Bonds: Yields dropped steadily in February, creating a positive tailwind for bonds. The 10-year U.S. Treasury closed February at 3.97%, its lowest closing level of the year, after ending January at 4.26%.
- U.S. Economy: Data was mixed to start the new year. The unemployment rate has fallen, but so too have job openings, while manufacturing perked up and wholesale prices rose.
- Federal Reserve: The FOMC did not meet in February. The market still expects two rates cuts in 2026, but no action is expected by the Fed until after the new Chair takes over the helm midyear.
Equity Markets
Rotation and the threat of AI to various industries were ongoing themes in February. Large-cap growth, which had been the clear winner in recent years, has struggled to start 2026, while value stocks and small caps have fared better. International stocks have maintained their leadership with a strong start to 2026. Clearly, the market was digesting the news of the U.S. strike against Iran as March began, and we will monitor those developments in the weeks ahead. See Table 1 for February, YTD, and 2025 returns.
Table 1 | Equity Markets
| Index | February 2026 | Q4 | YTD |
|---|---|---|---|
| S&P 500 | -0.76% | 0.68% | 17.88% |
| S&P 500 Equal Weight | 3.55% | 7.06% | 11.43% |
| DJIA | 0.31% | 2.12% | 14.92% |
| Russell 3000 | -0.48% | 1.07% | 17.15% |
| NASDAQ Comp. | -3.33% | -2.39% | 21.14% |
| Russell 2000 | 0.80% | 6.20% | 12.81% |
| MSCI ACWI ex U.S. | 5.02% | 11.30% | 32.39% |
| MSCI Emerging Mkts Net | 5.50% | 14.83% | 33.57% |
Table 1 is largely a mirror image of what we have come to expect in recent years. International stocks have maintained their recent leadership as small cap and more value-oriented stocks have started the year on solid footing. At the same time, large-cap growth has lagged. For the fourth month in a row, the equal-weight S&P 500 has fared much better than the widely followed market-cap weighted version of this index, reflecting the rally broadening away from the largest-cap technology companies. Outside of large-cap growth, equities have shown solid gains to begin 2026 after strong results in 2025.
International stocks once again led the equity markets. The broad measure of international stocks, the MSCI ACWI ex U.S., has already gained double-digits year to date, but it lags its emerging market counterpart, which has rallied even more to begin the year. The U.S. dollar weakened in January, but it strengthened in February leaving it only modestly weaker on the year. The strong results of international stocks were one of the key stories of 2025 after lagging U.S. stocks for the last several years, and that leadership continues.
Following the April lows, stocks had an impressive rally with little weakness along the way. Large-cap growth was one of the leading areas from those post-April lows, but that strength has faded over fears of excessive capital spending and the monetization of the AI build out. It is imperative to remember that stocks can be volatile, and pullbacks are normal and should be expected after such a strong rally. Furthermore, midterm election years and changes in Fed leadership are often associated with increased stock market volatility.
Fixed Income
Bond results were solid in February as rates fell. The 10-year U.S. Treasury closed below 4% for the first time this year on the last day of the month. See Table 2 for bond index returns for February, YTD, and 2025.
Table 2 | Fixed Income Markets
| Index | February 2026 | Q4 | YTD |
|---|---|---|---|
| Bloomberg U.S. Agg | 1.64% | 1.75% | 7.30% |
| Bloomberg U.S. Credit | 1.35% | 1.51% | 7.83% |
| Bloomberg U.S. High Yld | 0.19% | 0.69% | 8.62% |
| Bloomberg Muni | 1.25% | 2.20% | 4.25% |
| Bloomberg 30-year U.S. TSY | 4.55% | 3.94% | 3.73% |
| Bloomberg U.S. TSY | 1.82% | 1.72% | 6.32% |
No fees or expenses are reflected. You cannot invest directly in an index. Past performance is not indicative of future results.
The 10-year U.S. Treasury yield closed 2025 at 4.18%, rose to 4.26% at the end of January, but declined to 3.97% by February’s close. As a result, the more rate sensitive bond sectors showed the best results in February after lagging in January. Momentum continued in the muni space after that sector gained some relative strength in the latter part of 2025. During a choppier time for stocks, high-yield bonds struggled in February and lagged other bond categories. We believe the 10-year U.S. Treasury will be range bound this year between 3.5% and 4.5%, but pressure could exist on shorter-term yields as additional Fed rates cuts are expected in 2026 (albeit slowly).
We maintain our long-standing position favoring credit versus pure rate exposure in this interest rate environment. Credit spreads have remained near historic lows, but they widened in February as equities became more volatile. We believe the role bonds play in a portfolio, to provide stable cash flow and to help offset the volatility of stocks in the long run, has not changed. As the Fed resumes its rate-cutting cycle, we believe having an active bond management approach makes sense. Furthermore, rates remain elevated and, in our opinion, provides attractive opportunities for bond investors. We believe a positive backdrop still exists for bonds given our expectation of further rate cuts and moderating inflation.
Economic Data Highlights and Outlook
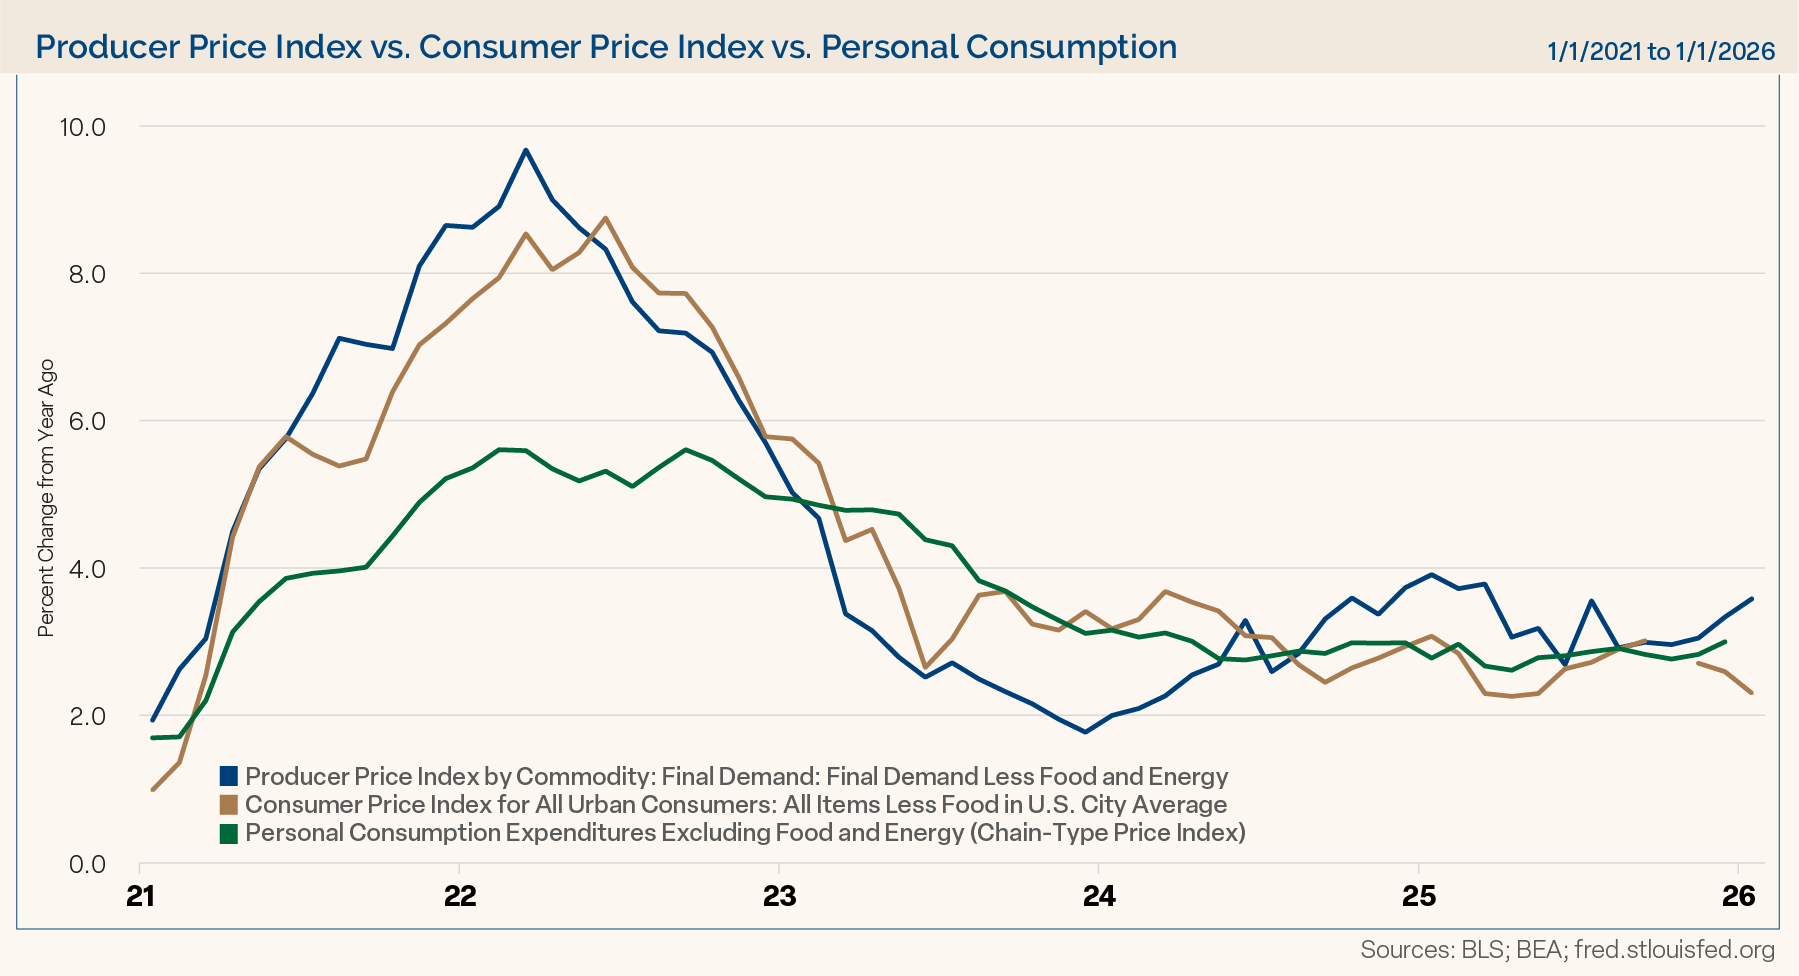
Economic data was mixed to kick off the new year. Inflation data epitomized the mixed nature of economic readings. The Producer Price Index (PPI) for January surprised to the upside for a second straight month. Both headline and core PPIs were expected to come in with 0.3% monthly increases. Instead, they recorded increases of 0.5% and 0.8%, respectively. This put the annual gains in wholesale prices at 2.9% (headline) and 3.6% (core), which were both well above expectations.
The Consumer Price Index (CPI) readings (both headline and core) were expected to increase by 0.3% on a monthly basis in January. Headline CPI was lower than expected at 0.2%, which dropped the annual gain to 2.4%, which was also lower (better) than expected. Core CPI matched expectations with a 0.3% monthly increase and a 2.5% annual gain.
The Personal Consumption Expenditures (PCE) price index (the preferred inflation measure of the Fed) increased by 0.4% in December on both a headline and core basis. Expectations called for increases of 0.3%, so the annual increases were 2.9% and 3.0%, respectively, both 0.1% above expectations. For the second straight month, wholesale prices rose more than expected, so we will have to see if this starts to flow into consumer pricing in the months ahead. However, at this point, consumer prices seem well contained, but with prices still above the Fed’s goal, the Fed might delay any rate-cut activity until later in the year. See Chart 1 for core inflation data.
Chart 1
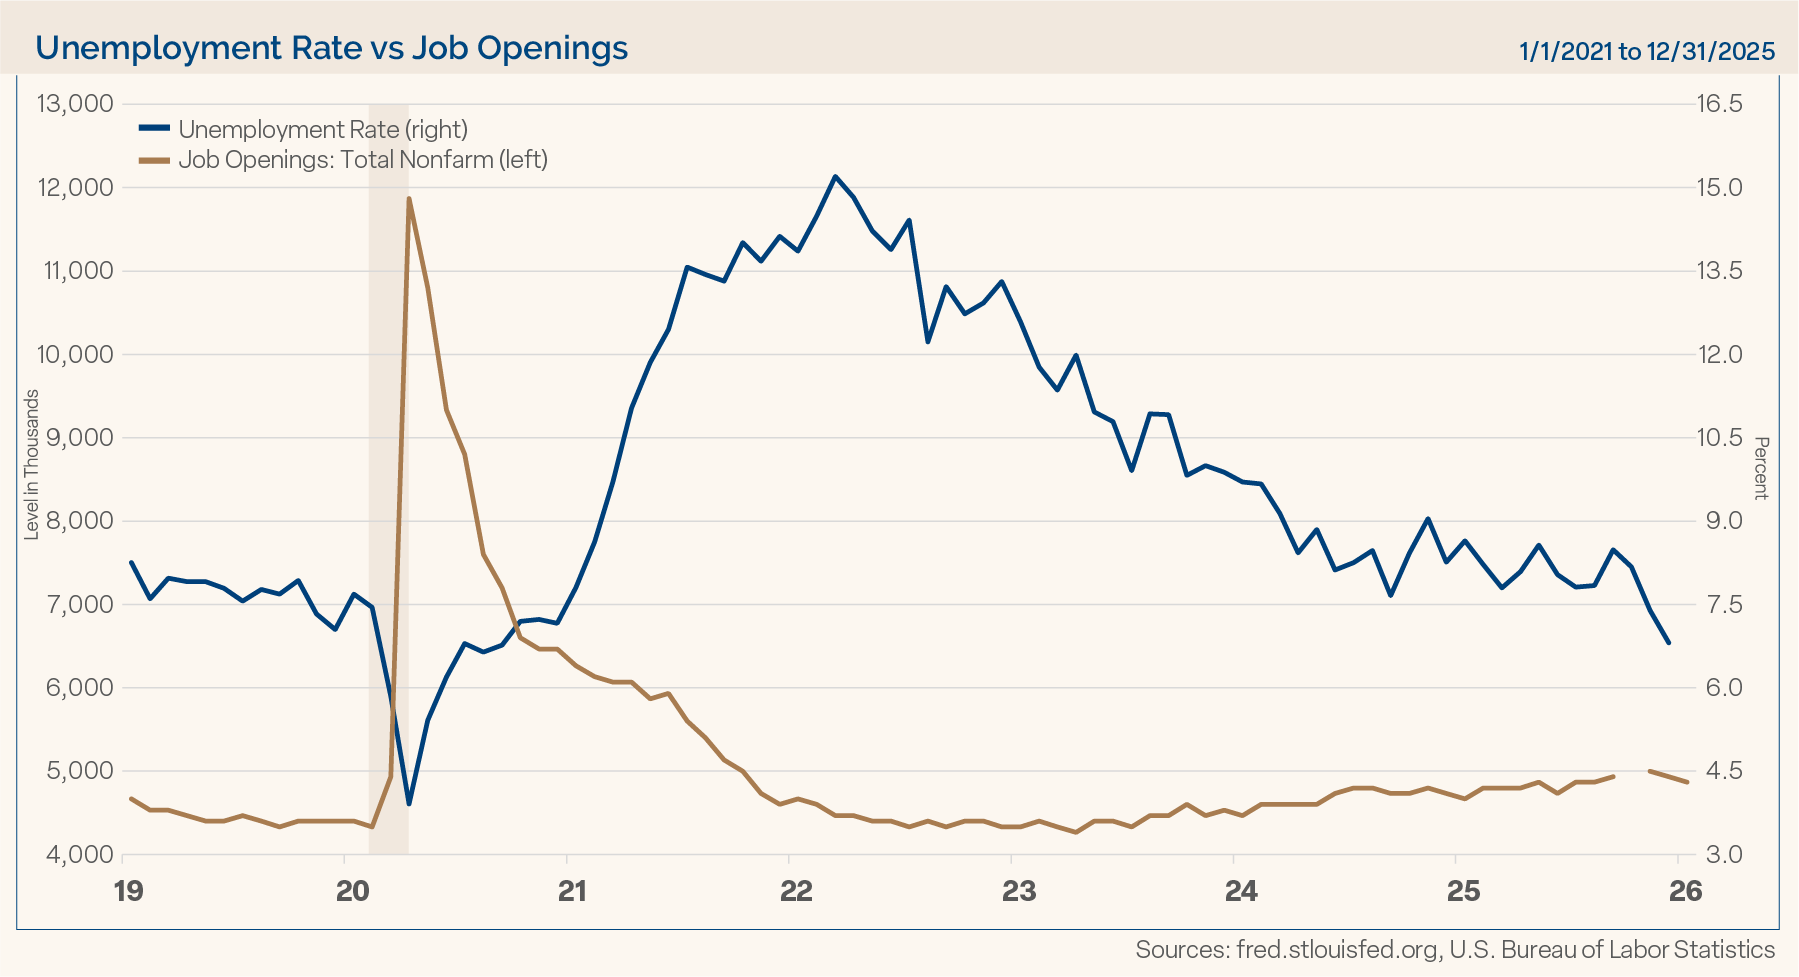
Payroll data was a source of good economic news in January, but the current “no hire, no fire” economic environment has some concerned about job-market health. In January, 130,000 people were added to payrolls, double expectations of 65,000. The unemployment rate fell to 4.3% from the prior level and expectations of 4.4%. However, job openings have declined over the last few years, and they dropped dramatically in December. The JOLTS reading of job openings for December showed just over 6.5 million openings compared to expectations of 7.25 million and the prior month’s revised lower mark of just above 6.9 million. This figure reflects the fewest number of job openings since 2020. See Chart 2 below that shows the slowly rising unemployment rate over the last few years (despite improvements in recent months) and the declining number of job openings.
Chart 2
The Institute for Supply Management (ISM) Manufacturing Index provided another piece of positive economic news to kick off the new year. For the first time since February 2025, this ISM reading reflected expansion at 52.6, easily surpassing expectations of 48.5. One month is not a trend, but we will see if manufacturing gains some momentum after being weak in recent years. In more good news, the February reading came in at 52.4, which surpassed expectations of 51.5 and reflected consecutive months of expansion.
The ISM Non-Manufacturing Index, which covers the much larger service industries in the U.S. economy, continued to reflect expansion. This reading came in at 53.8 for January compared to expectations of 53.5, which matched December’s revised lower reading of 53.8. Recall for the ISM indices, readings above 50 represent expansion and below 50 reflect contraction. It has been a while since both the manufacturing and services sectors simultaneously showed growth.
Consumer spending data was mixed in December. Retail sales excluding autos and gas were flat when a 0.4% monthly gain was expected. However, personal spending increased by 0.4% in December, slightly ahead of expectations of 0.3%. Furthermore, the personal consumption portion of the advance reading of Q4 GDP came in at a 2.4% annualized rate, which matched expectations but was slower than the Q3 contribution. Consumer sentiment readings have been rather weak for some time, but we have not seen that translate into a drop in consumer spending. Consumer spending will be important to monitor due to the central role that household consumption plays in the U.S. economy. We care about the “soft” data (like sentiment readings), but we care a lot more about “hard” data, which track what consumers do.
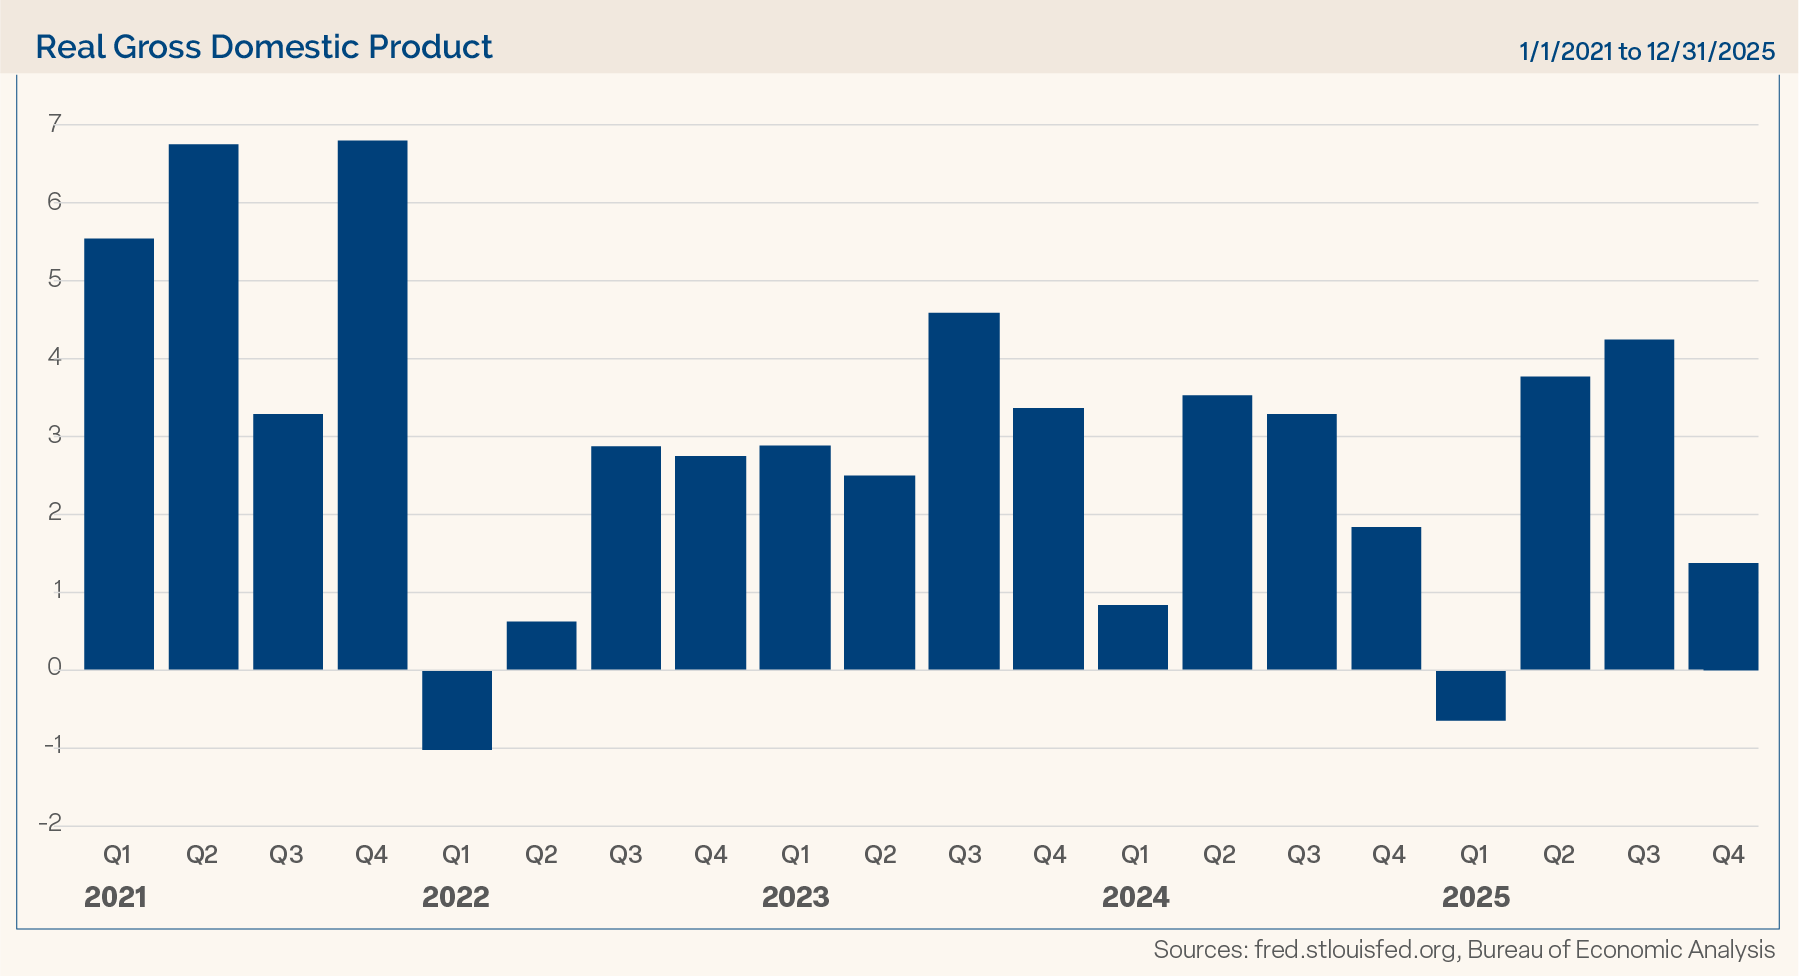
Digging further into the advanced reading of Q4 GDP, economic growth slowed to a 1.4% annualized pace versus expectations of 2.8%, but part of that weakness was caused by the longest government shutdown in U.S. history. This may prove to be a rather “noisy” GDP report due to the impact of the government shutdown, but it will be important to see what revisions are made to that report. The GDPNow forecast from the Atlanta Fed for Q1 2026 GDP shows the economy starting out 2026 on a strong note with a current estimate of 3.0% annualized growth (as of 2/27/26). Chart 3 below shows GDP in recent years and the two strong quarters in the middle of 2025 bookended by weaker quarters.
Chart 3
The Federal Reserve was rather quiet in February. There were no FOMC meetings and the market had little reaction to President Trump’s pick for the new Fed Chair, Kevin Warsh, which was made at the end of January. His confirmation process could bring about more news and volatility, but this became back page news during the month. Per the CME FedWatch tool on 2/27/26, the market is still pricing in only two rate cuts in 2026, both of which are expected to occur after the new Fed chair takes over leadership when Chair Jerome Powell’s term expires following the May FOMC meeting.
What did garner focus of the market in February was the Supreme Court’s rejection of President Trump’s tariffs using the International Emergency Economic Powers Act (IEEPA). President Trump immediately announced tariffs of 10% through Section 122 powers, but that only allows tariffs for 150 days unless extended by Congress. The ruling has caused uncertainty on tariffs, trade, and already negotiated trade deals. However, it seems clear that President Trump is determined to keep tariffs, a core tenet of his economic plans, in place through other mechanisms.
Tariff uncertainties and the role artificial intelligence will play in the economy caused some elevated volatility in the stock market in February. The general trade away from the large-cap tech companies and into other areas of capital markets continued during the month, but with some additional chop. Some industries like software were particularly scrutinized by the market regarding their vulnerability to AI. Private credit was another focus of the market as investors scrutinized the lending activity of those businesses. However, focusing on broader market fundamentals, analysts project S&P 500 earnings growth of 16%–17% in 2026. Small- and mid-cap earnings growth is also improving. Stock valuations in the U.S. sit at elevated levels when looking at large caps in particular, but strong earnings growth is supporting those valuations, and accelerating earnings growth is expected in 2026. Although the change in Fed leadership could cause some volatility, directionally the Fed is still in a rate cut cycle and that is unlikely to change based on current data. We still see opportunities in the stock and bond markets as we move into 2026. As always, we believe it is imperative for investors to stay focused on their long-term goals and not let short-term swings in the market, which could materialize at any time, derail them from their longer-term objectives.
Please Note: Most economic data has caught up from the government shutdown, however a few readings are still delayed and behind their typical schedule.
Economic Data
| Event | Period | Estimate | Actual | Prior | Revised |
|---|---|---|---|---|---|
| ISM Manufacturing | Jan | 48.5 | 52.6 | 47.9 | — |
| ISM Services Index | Jan | 53.5 | 53.8 | 54.4 | 53.8 |
| Change in Nonfarm Payrolls | Jan | 65k | 130k | 50k | 48k |
| Unemployment Rate | Jan | 4.40% | 4.30% | 4.40% | — |
| Average Hourly Earnings YoY | Jan | 3.70% | 3.70% | 3.80% | 3.70% |
| JOLTS Job Openings | Dec | 7250k | 6542k | 7146k | 6928k |
| PPI Final Demand MoM | Jan | 0.30% | 0.50% | 0.50% | 0.40% |
| PPI Final Demand YoY | Jan | 2.60% | 2.90% | 3.00% | — |
| PPI Ex Food and Energy MoM | Jan | 0.30% | 0.80% | 0.70% | 0.60% |
| PPI Ex Food and Energy YoY | Jan | 3.00% | 3.60% | 3.30% | — |
| CPI MoM | Jan | 0.30% | 0.20% | 0.30% | — |
| CPI YoY | Jan | 2.50% | 2.40% | 2.70% | — |
| CPI Ex Food and Energy MoM | Jan | 0.30% | 0.30% | 0.20% | — |
| CPI Ex Food and Energy YoY | Jan | 2.50% | 2.50% | 2.60% | — |
| Retail Sales Ex Auto and Gas | Dec | 0.40% | 0.00% | 0.40% | 0.30% |
| Industrial Production MoM | Jan | 0.40% | 0.70% | 0.40% | 0.20% |
| Building Permits | Dec P | 1400k | 1448k | 1388k | __ |
| Housing Starts | Dec | 1304k | 1404k | 1322k | — |
| New Home Sales | Dec | 730k | 745k | 758k | — |
| Existing Home Sales | Jan | 4.15m | 3.91m | 4.35m | 4.27m |
| Leading Index | Dec | -0.20% | -0.20% | -0.30% | — |
| Durable Goods Orders | Dec P | -2.00% | -1.40% | 5.30% | 5.40% |
| GDP Annualized QoQ | 4Q A | 2.80% | 1.40% | 4.40% | — |
| U. of Mich. Sentiment | Feb P | 55 | 57.3 | 56.4 | — |
| Personal Income | Dec | 0.30% | 0.30% | 0.30% | 0.40% |
| Personal Spending | Dec | 0.30% | 0.40% | 0.50% | 0.40% |
| S&P Cotality CS 20-City YoY NSA | Dec | 1.30% | 1.38% | 1.39% | 1.42% |
For illustrative purposes only. Past performance is not indicative of future results. Neither past actual, projections, nor other forward looking statements regarding future financial performance of markets are only projections and actual events or results may differ materially.
Disclosures
Forward looking statements cannot be guaranteed. Past performance is not indicative of future results. The opinions referenced are as of the date of publication and are subject to change due to changes in the market or economic conditions and may not necessarily come to pass. Material presented has been derived from sources considered to be reliable and has not been independently verified by us or our personnel. Nothing herein should be construed as a solicitation, recommendation or an offer to buy, sell or hold any securities, other investments or to adopt any investment strategy or strategies. Investors must make their own decisions based on their specific investment objectives and financial circumstances. Investing involves risk, including loss of principal.
Clark Capital Management Group is an investment adviser registered with the U.S. Securities and Exchange Commission. Registration does not imply a certain level of skill or training. More information about Clark Capital Management Group’s advisory services can be found in its Form ADV and/or Form CRS, which are available upon request.
The manager utilizes a proprietary investment model to assist with the construction of the strategy and to assist the manager with making investment decisions. Investments selected using this process may perform differently than expected as a result of the factors used in the model, the weight placed on each factor, and changes from the factors’ historical trends. There is no guarantee that Clark Capital’s use of a model will result in effective investment decisions.
Fixed income securities are subject to certain risks including, but not limited to: interest rate (changes in interest rates may cause a decline in market value or an investment), credit, prepayment, call (some bonds allow the issuer to call a bond for redemption before it matures), and extension (principal repayments may not occur as quickly as anticipated, causing the expected maturity of a security to increase).
Non-investment-grade debt securities (high-yield/junk bonds) may be subject to greater market fluctuations, risk of default or loss of income and principal than higher-rated securities.
The value of investments, and the income from them, can go down as well as up and you may get back less than the amount invested.
Equity securities are subject to price fluctuation and possible loss of principal. Stock markets tend to move in cycles, with periods of rising prices and periods of falling prices. Certain investment strategies tend to increase the total risk of an investment (relative to the broader market). Strategies that concentrate their investments in limited sectors are more vulnerable to adverse market, economic, regulatory, political, or other developments affecting those sectors.
JOLTS is a monthly report by the Bureau of Labor Statistics (BLS) of the U.S. Department of Labor counting job vacancies and separations, including the number of workers voluntarily quitting employment.
The Core Consumer Price Index (CPI) is a measure of the average change over time in the prices paid by urban consumers for a market basket of consumer goods and services.
The Core Producer Price Index (PPI) program measures the average change over time in the selling prices received by domestic producers for their output. The prices included in the PPI are from the first commercial transaction for many products and some services.
The PCE price index, released each month in the Personal Income and Outlays report, reflects changes in the prices of goods and services purchased by consumers in the United States.
References to market or composite indices, benchmarks or other measures of relative market performance over a specified period of time (each, an “index”) are provided for your information only. Reference to an index does not imply that the portfolio will achieve returns, volatility or other results similar to that index. The composition of the index may not reflect the manner in which a portfolio is constructed in relation to expected or achieved returns, portfolio guidelines, restrictions, sectors, correlations, concentrations, volatility or tracking error targets, all of which are subject to change. Investors cannot invest directly in an index.
The Dow Jones Industrial Average® (The Dow®), is a price-weighted measure of 30 U.S. blue-chip companies.
The index covers all industries except transportation and utilities.
The Bloomberg Barclays U.S. Municipal Index covers the USD-denominated long-term tax exempt bond market. The index has four main sectors: state and local general obligation bonds, revenue bonds, insured bonds and prerefunded bonds.
The Bloomberg US Treasury Index measures US dollar-denominated, fixed-rate, nominal debt issued by the US Treasury. Treasury bills are excluded by the maturity constraint, but are part of a separate Short Treasury Index.
The NASDAQ Composite is a stock market index of the common stocks and similar securities listed on the NASDAQ
stock market.
The S&P 500 measures the performance of the 500 leading companies in leading industries of the U.S. economy, capturing 80% of U.S. equities.
The S&P 500® Equal Weight Index (EWI) is the equal-weight version of the widely-used S&P 500. The index includes the same constituents as the capitalization weighted S&P 500, but each company in the S&P 500 EWI is allocated a fixed weight or 0.2% of the index total at each quarterly rebalance.
The University of Michigan Consumer Sentiment Index rates the relative level of current and future economic conditions. There are two versions of this data released two weeks apart, preliminary and revised. The preliminary data tends to have
a greater impact. The reading is compiled from a survey of around 500 consumers.
The Russell 1000 Index is a stock market index that tracks the highest-ranking 1,000 stocks in the Russell 3000 Index, which represent about 93% of the total market capitalization of that index.
The Russell 2000 Index is a small-cap stock market index that represents the bottom 2,000 stocks in the Russell 3000.
The Russell 3000 Index measures the performance of the 3,000 largest U.S. companies based on total market capitalization, which represents approximately 98% of the investable U.S. equity market.
Russell 1000 Growth Index tracks companies with higher price-to-book ratios, higher sales per share growth, and higher I/B/E/S forecast growth.
Russell 1000 Value Index tracks companies with lower price-to-book ratios and lower expected and historical growth rates. Russell’s value indexes focus more on dividend yield.
Nonfarm payrolls (NFPs) are the measure of the number of workers in the United States excluding farm workers and workers in a handful of other job classifications.
A municipal bond, commonly known as a muni, is a bond issued by state or local governments, or entities they create such as authorities and special districts.
The CBOE Volatility Index (VIX) is a real-time index that measures the expected volatility of the S&P 500 over the next
30 days.
The U.S. Treasury index is based on the recent auctions of U.S. Treasury bills. Occasionally it is based on the U.S. Treasury’s daily yield curve.
The 30 Year Treasury Rate is the yield received for investing in a US government issued treasury security that has a maturity of 30 years.
The Bloomberg Barclays U.S. Corporate High-Yield Index covers the U.S. dollar-denominated, non-investment grade, fixed-rate, taxable corporate bond market. Securities are classified as high-yield if the middle rating of Moody’s, Fitch,
and S&P is Ba1/BB+/BB+ or below.
The Bloomberg Barclays U.S. Credit Index measures the investment grade, U.S. dollar denominated, fixed-rate taxable corporate and government related bond markets.
The Bloomberg Aggregate Bond Index or “the Agg” is a broad-based fixed-income index used by bond traders and the managers of mutual funds and exchange-traded funds (ETFs) as a benchmark to measure their relative performance.
The Bloomberg US Trsy Bellwether 30Y is a U.S. Treasury debt obligation that has a maturity of 30 years.
The ISM Non-Manufacturing Index is an index based on surveys of more than 400 non-manufacturing firms’ purchasing and supply executives, within 60 sectors across the nation, by the Institute of Supply Management (ISM). The ISM Non-Manufacturing Index tracks economic data, like the ISM Non-Manufacturing Business Activity Index. A composite diffusion index is created based on the data from these surveys, that monitors economic conditions of the nation.
ISM Manufacturing Index measures manufacturing activity based on a monthly survey, conducted by Institute for Supply Management (ISM), of purchasing managers at more than 300 manufacturing firms.
The MSCI Emerging Markets Index captures large and mid cap representation across 27 Emerging Markets (EM) countries.
The MSCI ACWI ex USA Index captures large and mid cap representation across 22 of 23 Developed Markets (DM) countries (excluding the US) and 27 Emerging Markets (EM) countries*. With 2,359 constituents, the index covers approximately 85% of the global equity opportunity set outside the US.
The S&P CoreLogic Case-Shiller 20-City Composite Home Price NSA Index seeks to measures the value of residential real estate in 20 major U.S. metropolitan areas. The U.S. Treasury index is based on the recent auctions of U.S. Treasury bills. Occasionally it is based on the U.S. Treasury’s daily yield curve.
The Leading Economic Index provides an early indication of significant turning points in the business cycle and where the economy is heading in the near term.
In the United States, the Core Personal Consumption Expenditure Price (CPE) Index provides a measure of the prices paid by people for domestic purchases of goods and services, excluding the prices of food and energy.
The Conference Board’s Leading Indexes are the key elements in an analytic system designed to signal peaks and troughs in the business cycle. The leading, coincident, and lagging economic indexes are essentially composite averages of several individual leading, coincident, or lagging indicators. They are constructed to summarize and reveal common turning point patterns in economic data in a clearer and more convincing manner than any individual component – primarily because they smooth out some of the volatility of individual components.
Gross domestic product (GDP) is the standard measure of the value added created through the production of goods and services in a country during a certain period.