
Broadening Continues as Small Caps, Value, and International Shine; Large Growth Pauses
HIGHLIGHTS:
- Stocks: Outside of large-cap growth, stocks started the year with solid gains. The S&P 500 posted a new all-time high, hitting the 7000 mark for the first time ever, but its equal-weighted counterpart fared better over the entire month.
- Bonds: The broad bond indices advanced in January after a solid year of returns in 2025. Although the Agg was only up modestly, munis continued their recent momentum from Q4 with among the best bond gains in January.
- U.S. Economy: The U.S. economy seems to be starting the new year on solid footing. Consumers are still spending despite weak confidence data, and the broader economy continues to grow.
- Federal Reserve: The FOMC met in January and, as expected, ended the streak of three straight meetings with rate cuts. Only two rate cuts are expected in 2026 per the CME FedWatch tool as of February 2, 2026. Kevin Warsh was nominated as the new Fed Chair and the market will watch the transition to him leading the Fed closely in the months ahead.
Equity Markets
Stocks were choppier in January, but most areas of the market showed gains. The one laggard was large-cap growth, which was strong in recent years and for most of 2025, but trailed other stock indices. See Table 1 for January, Q4, and 2025 returns.
Table 1 | Equity Markets
| Index | January 2026 | Q4 | YTD |
|---|---|---|---|
| S&P 500 | 1.45% | 2.66% | 17.88% |
| S&P 500 Equal Weight | 3.39% | 1.39% | 11.43% |
| DJIA | 1.80% | 4.03% | 14.92% |
| Russell 3000 | 1.55% | 2.40% | 17.15% |
| NASDAQ Comp. | 0.97% | 2.72% | 21.14% |
| Russell 2000 | 5.35% | 2.19% | 12.81% |
| MSCI ACWI ex U.S. | 5.98% | 5.05% | 32.39% |
| MSCI Emerging Mkts Net | 8.85% | 4.73% | 33.57% |
After declining in December, the Nasdaq Composite turned in a gain to start the new year, but with a sub-1% return, it lagged other areas of the equity markets. The equal-weight S&P 500 fared better than the widely followed market-cap weighted version of this index for the third month in a row, reflecting the rally broadening beyond just the largest-cap tech names. Small caps started the year with some of the strongest returns for U.S. stocks, gaining more than 5%. Joining in those solid gains were value stocks, which outperformed growth. Outside of large-cap growth, equites showed solid gains to begin 2026 after strong results in 2025.
International stocks led the equity markets once again. The broad measure of international stocks, the MSCI ACWI ex U.S., outperformed U.S. stocks for the month following stellar outperformance in 2025. Emerging market stocks were even stronger to begin the new year with the best gains of any index on Table 1. U.S. dollar weakness aided those international results. The strong results of international stocks were one of the headline stories of 2025 after lagging U.S. stocks for the last several years. International leadership has continued to begin 2026.
Following the April lows, stocks have had an impressive rally with little weakness along the way. It is imperative to remember that stocks can be volatile, and pullbacks are not unusual and would not be unexpected moving into a midterm election year and a transition to new leadership at the Federal Reserve.
Fixed Income
Bond results were mixed in January. Rates rose modestly during the month, which created a headwind for bonds. While bonds did their job in 2025 with solid gains and helped offset some of the equity market volatility, 2026 started out modestly for bonds. See Table 2 for bond index returns for January, Q4, and 2025.
Table 2 | Fixed Income Markets
| Index | January 2026 | Q4 | YTD |
|---|---|---|---|
| Bloomberg U.S. Agg | 6.85% | 1.10% | 7.30% |
| Bloomberg U.S. Credit | 0.16% | 0.87% | 7.83% |
| Bloomberg U.S. High Yld | 0.51% | 1.31% | 8.62% |
| Bloomberg Muni | 0.94% | 1.56% | 4.25% |
| Bloomberg 30-year U.S. TSY | -0.59% | -0.50% | 3.73% |
| Bloomberg U.S. TSY | -0.09% | 0.90% | 6.32% |
The 10-year U.S. Treasury yield closed 2025 at 4.18% and rose to 4.26% at the end of January. This rise created a modest headwind for the more interest rate sensitive bond sectors, like U.S. Treasuries. Although munis lagged most other bond sectors in 2025, they showed the best relative performance for the fourth quarter as this pocket of bonds came on strong late in 2025. That momentum continued with munis producing some of the best results in bonds in January. High yield bonds also started the year on solid footing, while other sectors like the Agg and Credit showed modest returns to begin 2026. We believe the 10-year U.S. Treasury will be range bound this year between 3.5% and 4.5%, but pressure could exist on shorter-term rates as additional rates cuts (albeit slowly) are expected in 2026.
We maintain our longstanding position favoring credit versus pure rate exposure in this interest rate environment. Credit spreads have remained near historic lows as corporate bonds have outperformed Treasuries of late. We also believe the role bonds play in a portfolio, to provide stable cash flow and to help offset the volatility of stocks in the long run, has not changed. As the Fed resumes its rate-cutting cycle, we believe having an active bond management approach makes sense. Furthermore, rates remain elevated and in our view, provide attractive opportunities for bond investors. With rate cuts likely continuing during the year, a positive backdrop still exists for bonds in 2026, in our opinion.
Economic Data Highlights and Outlook
Economic data has largely caught up from the government shutdown, although some readings, like GDP, are still delayed. We will monitor how the potential partial government shutdown at the end of January impacts data set to be released in February, but it is expected to be much less impactful.
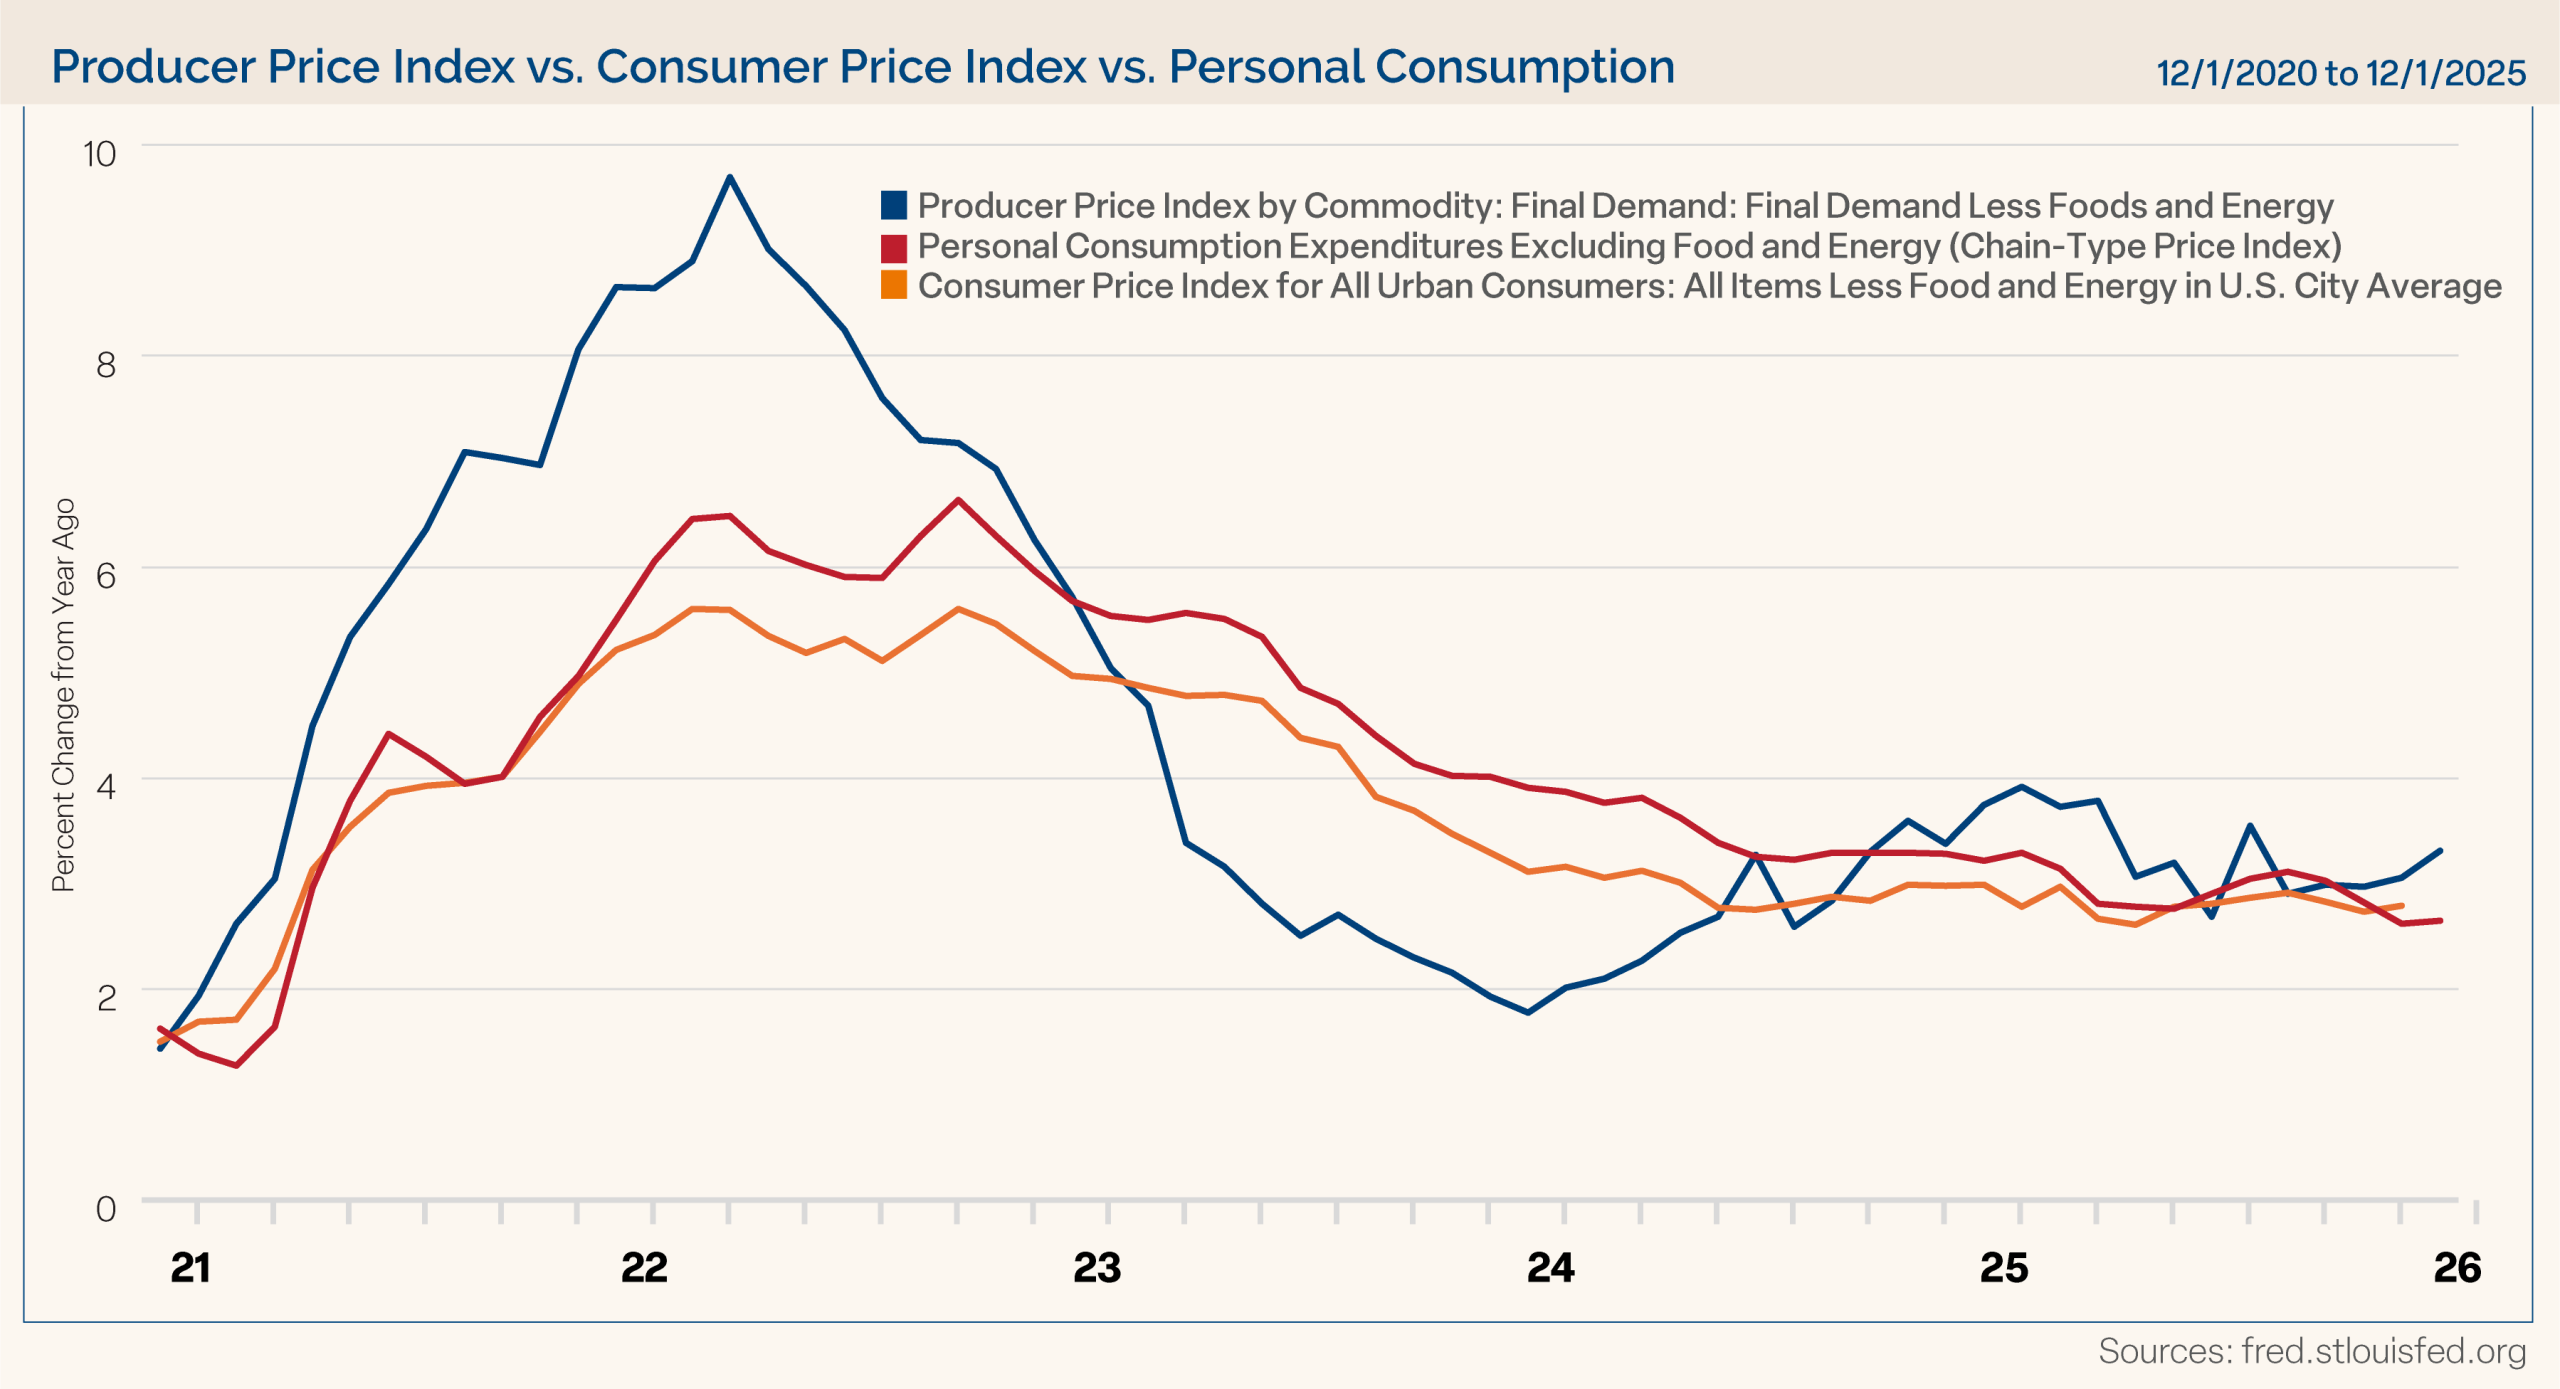
Inflation data continues to look largely contained on the consumer front, but the Producer Price Index (PPI) closed out the month with an upside surprise. The headline Consumer Price Index (CPI) and the core CPI for December came in at 2.7% and 2.6%, respectively with the core PPI reading modestly better than expectations of 2.7%. The Personal Consumption Expenditures (PCE) price index, the preferred inflation measure of the Fed, is now updated through November, and both the headline and core readings showed an annual increase of 2.8% as expected. PPI was released twice during the month (covering October, November, and December data), and the latest December reading was above expectations. Headline PPI rose 0.5% for the month and core PPI increased 0.7%, both exceeding expectations of a 0.2% gain. On a year-over-year basis, PPI was up 3.0% (compared to expectations of 2.8%) and core PPI rose 3.3% (versus estimates of 2.9%). While one month is not a trend, we will monitor whether wholesale prices start to put pressure on the consumer side of inflation, but at this point, inflation has been contained at a level where the Fed felt comfortable cutting rates to close out 2025. See Chart 1 for core inflation data. Please note the PCE reading is through November, while CPI and PPI are through December.
Chart 1
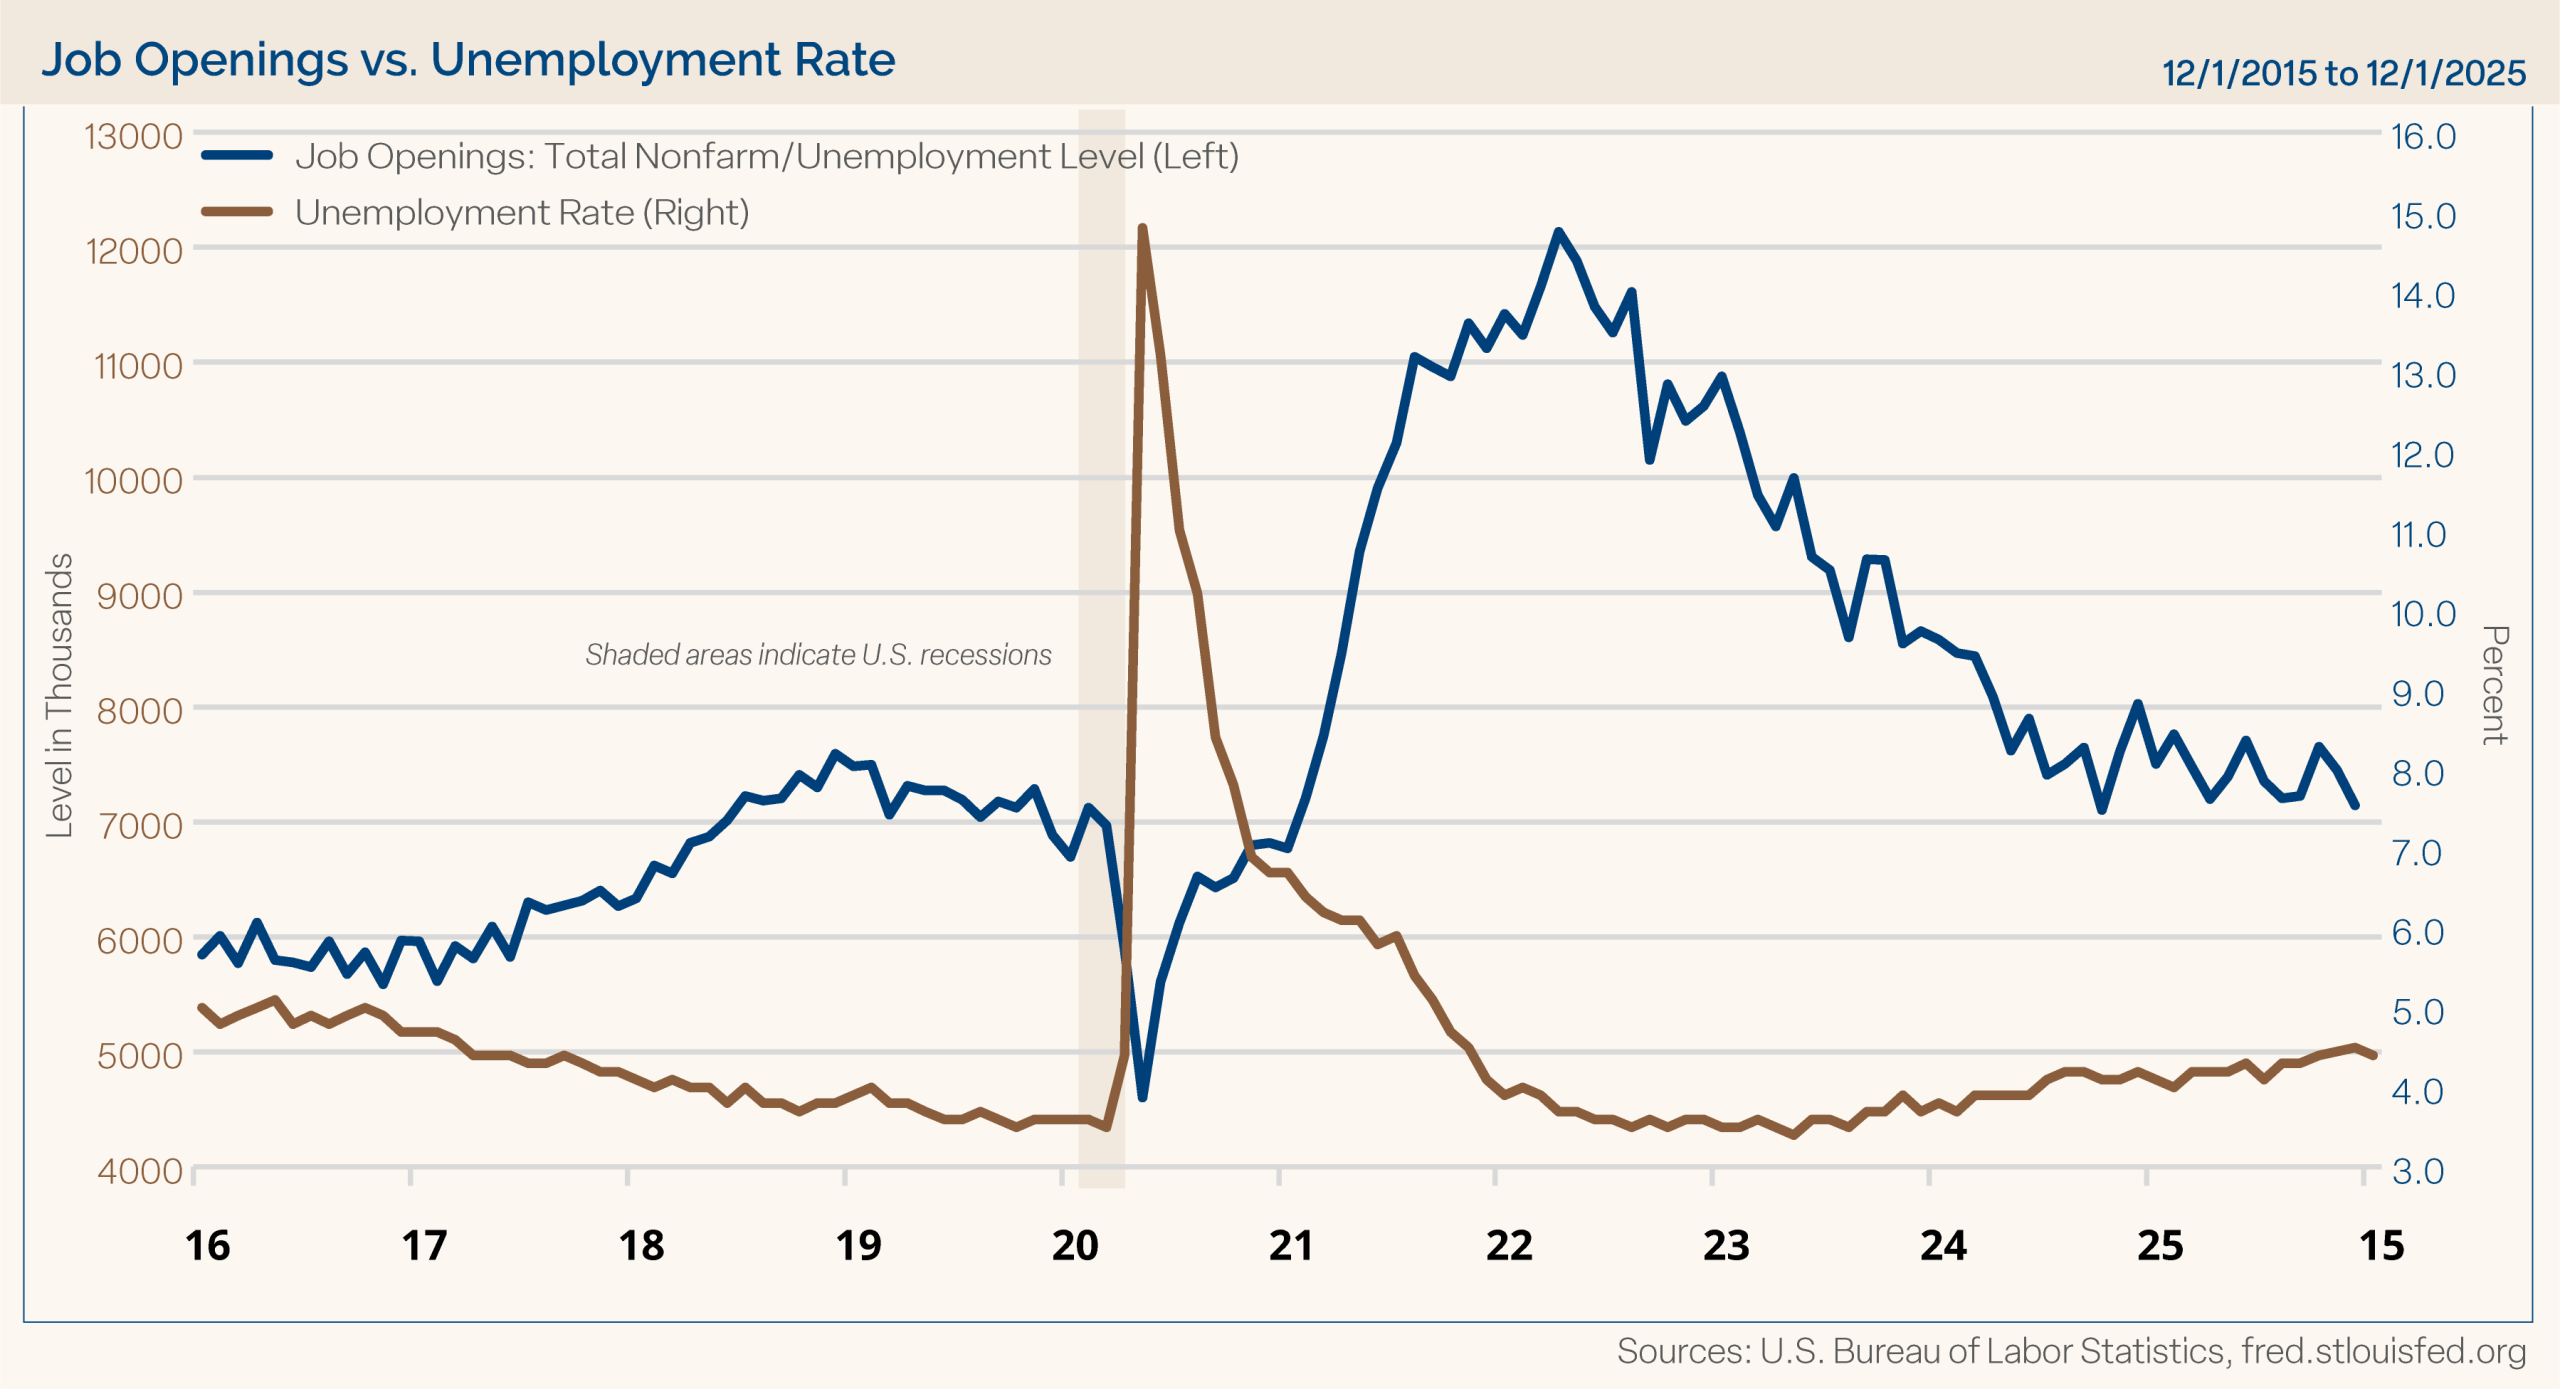
Payroll data continues to largely reflect the current “no hire, no fire” economic environment. In December, only 50,000 people were added to payrolls, falling short of expectations of 70,000. Job additions for November were revised down as well. Job openings have declined over the last few years as well, and employers are being more selective in their hiring. The latest JOLTS reading of job openings for November was at the second lowest level since December 2020. However, the unemployment rate dropped to 4.4% in December when it was expected to come in at 4.5%. Please see Chart 2 below showing the slowly rising unemployment rate and the slowly declining number of job openings. (The employment situation report is now going to be delayed for January due to the government shutdown at the beginning of February.)
Chart 2
The Institute for Supply Management (ISM) Manufacturing Index continued to reflect contraction with a reading of 47.9 in December. Expectations called for a modest increase in this index to 48.4 from the prior month’s revised reading of 48.0. (This reading came in above expectations at 52.6 for January breaking a 10-month streak below 50.) The ISM Non-Manufacturing Index, which covers the much larger service industries in the U.S. economy, has been stronger of late. This reading came in at 54.4 for December compared to expectations of 52.2 and November’s revised mark of 52.4. Recall for the ISM indices, readings above 50 represent expansion and below 50 reflect contraction.
Consumer sentiment data has been quite negative, but that has not translated into less consumer spending, so broader economic data remains solid. We care about the “soft” data (like sentiment readings), but we care a lot more about “hard” data, which track what consumers actually do. The preliminary University of Michigan Consumer Sentiment survey for January remained subdued at 54, but it was a modest improvement from recent months, which marked multi-year lows. The final reading for January improved to 56.4. At the same time, retail sales (ex auto and gas) had monthly gains of 0.4% in October and again in November. Personal spending increased 0.5% in November from October. Chart 3 below shows the advance retail sales reading, which has continued to climb higher despite confidence readings slumping in recent months. (Please note the University of Michigan reading on the chart is delayed by one month, so it stops at the December reading of 52.9).
Chart 3
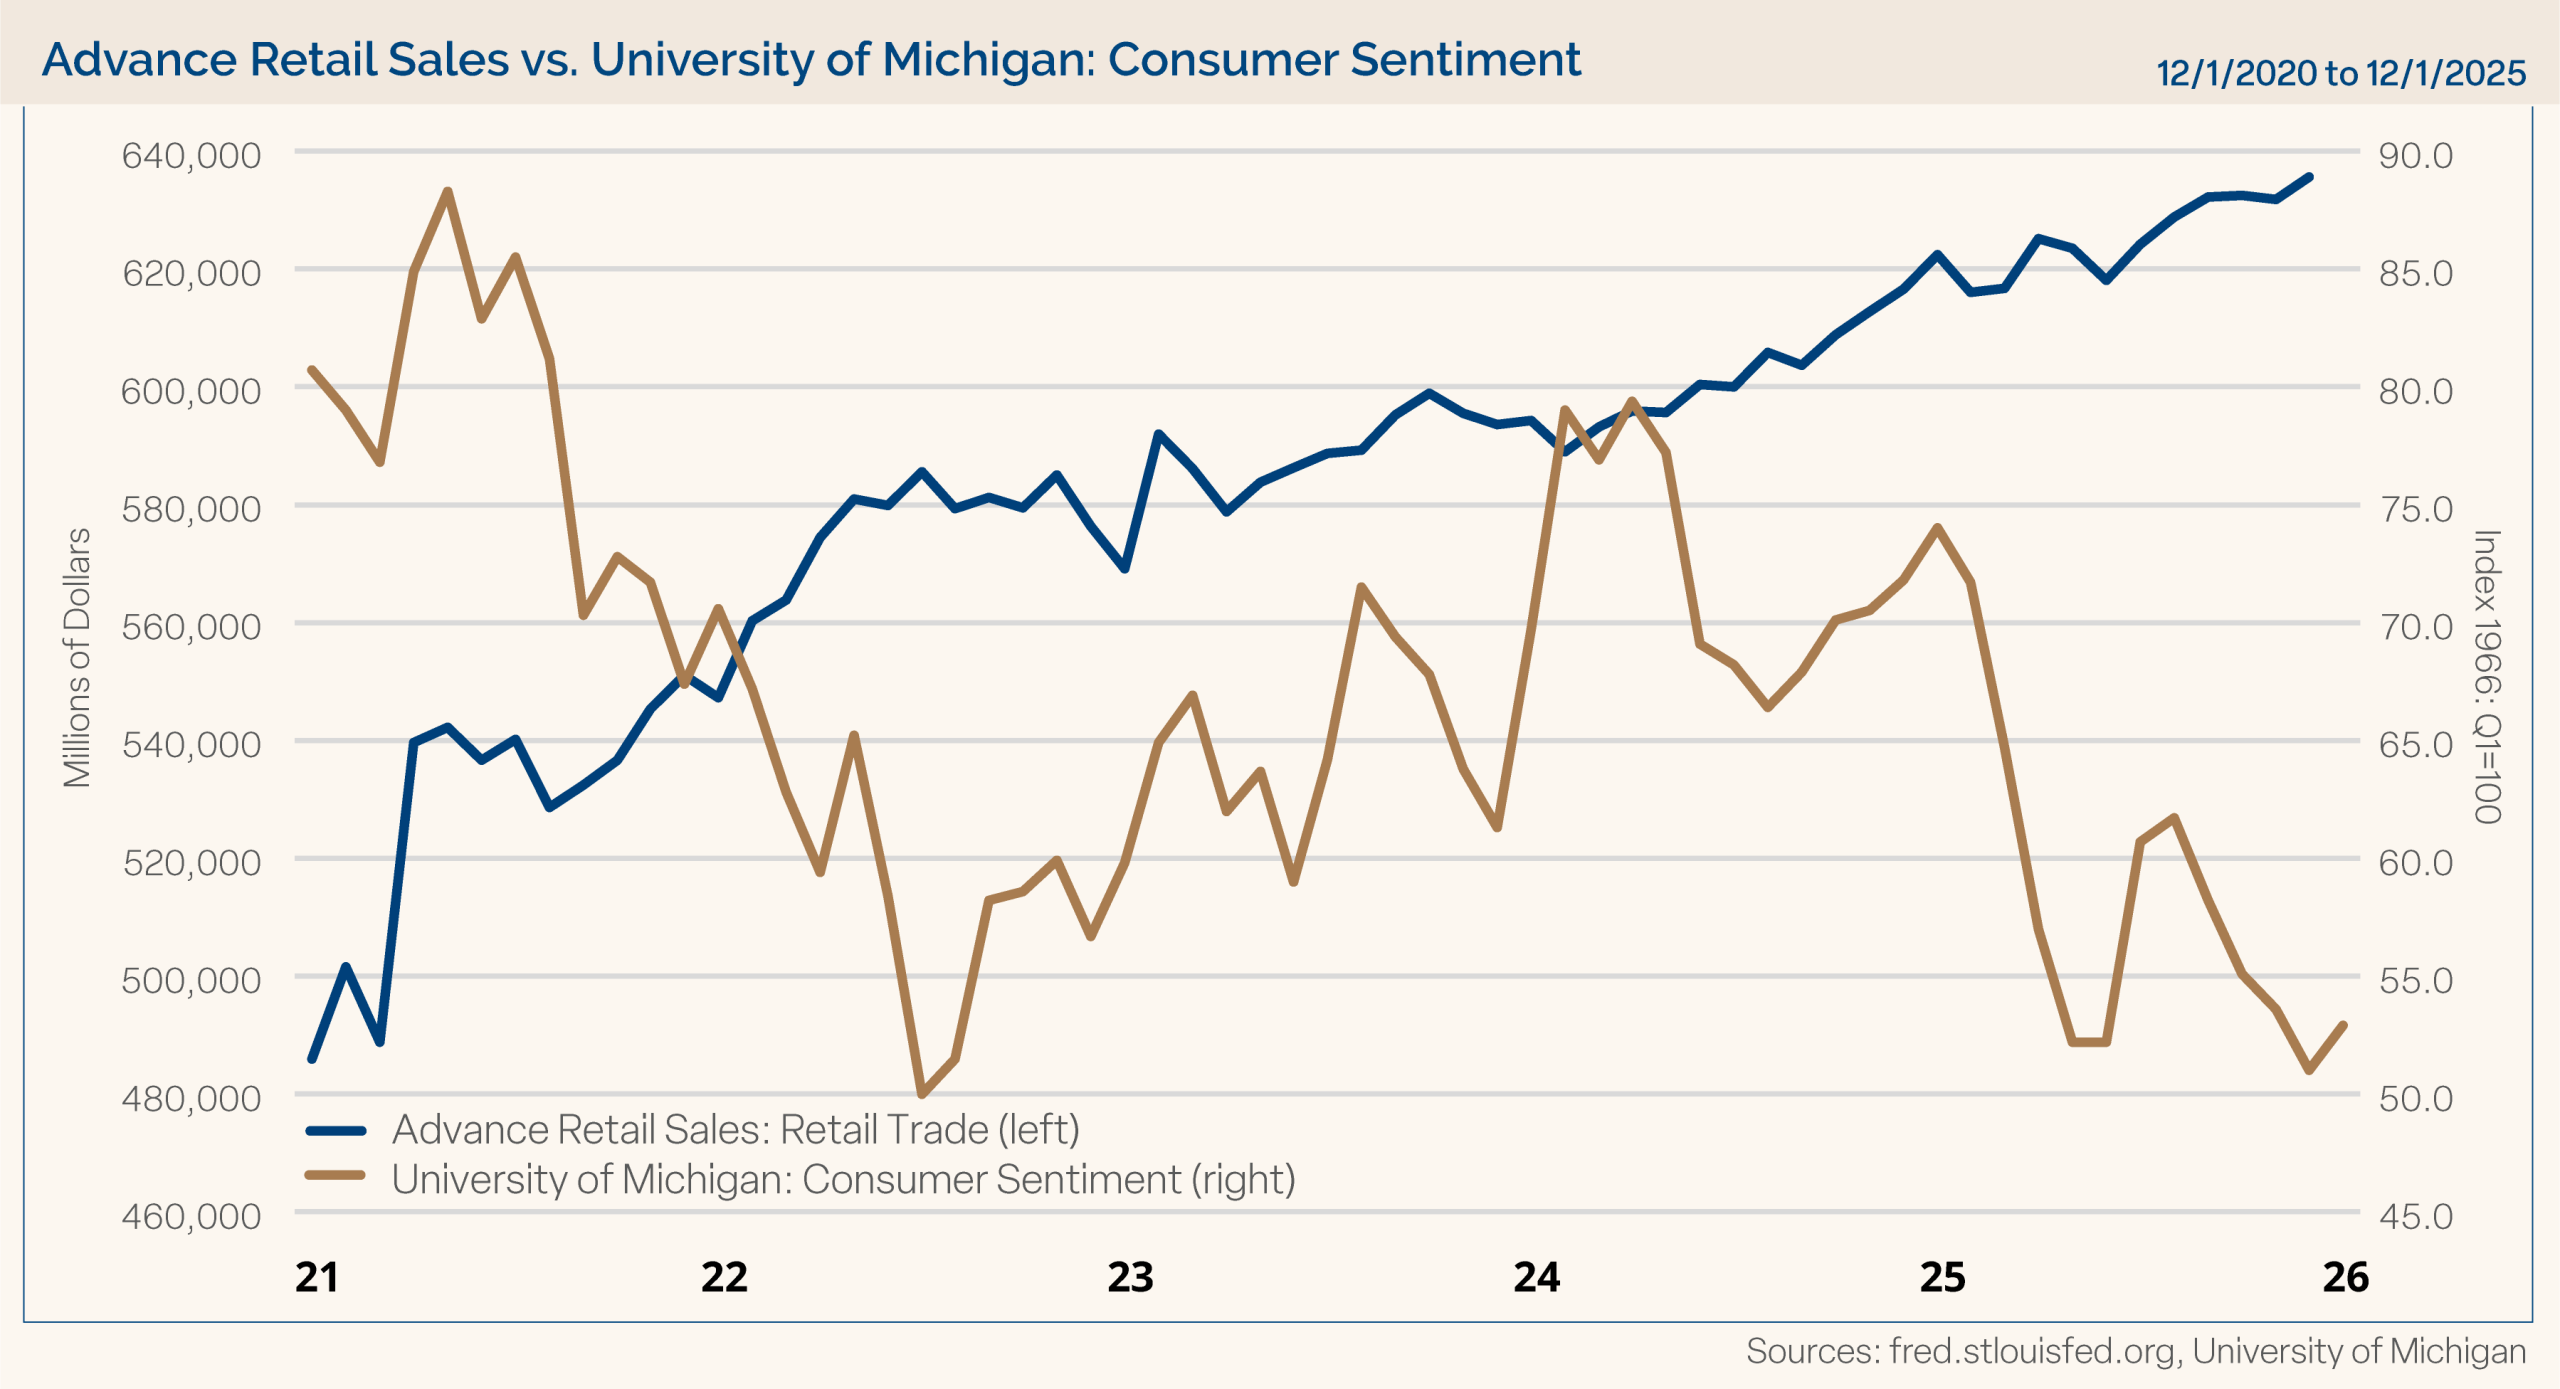
For illustrative purposes only. Past performance is not indicative of future results.
The revised reading of Q3 GDP was released in January, and it rose modestly to a 4.4% annualized growth rate from an already strong level of 4.3%. On a normal schedule, the preliminary reading of Q4 GDP would have been released in late January, but that has been delayed until February 20. The GDPNow forecast from the Atlanta Fed for Q4 GDP dropped in its latest reading from a very strong level of 5.4% to now an expected annual growth rate of 4.2% as of January 29, 2026.
The Federal Reserve met for the first time in 2026 on January 28–29 and, as expected, held rates steady at this meeting following rate cuts at the prior three FOMC meetings to close out 2025. The market had little reaction to this widely expected pause in rate cuts. However, the next day, President Trump announced his pick for the new Fed Chair to be Kevin Warsh. Warsh has previously served on the Board of Governors on the Fed, and his pick seemed to provide initial comfort to the market for ongoing Fed independence, but the market continues to digest his nomination. Rate cut probabilities remained unchanged after the Fed meeting and Warsh’s nomination. Per the CME FedWatch tool on January 30, the market is pricing in the next rate cut at the June FOMC meeting (which should be Warsh’s first as Chair) and only one additional after that before the end of the year.
Clearly, markets proved resilient in 2025. The new year started with geopolitical news surrounding the U.S. operation in Venezuela and President’s Trump desire to control Greenland, which caused some volatility to kick off 2026. However, focusing on market fundamentals, expectations are for earnings to grow about 17% for the S&P 500 companies in 2026. Small- and mid-cap companies are seeing earnings growth momentum as well. Stock valuations in the U.S. have crept higher and sit at elevated levels when looking at large caps in particular. However, valuations have not grown too alarming, in our opinion, and are supported by record high earnings and accelerating earnings growth expectations for 2026. Furthermore, the U.S. economy was on solid footing heading into the new year and the Fed, which has already been in a rate cut cycle, will likely continue that in 2026 under new Fed leadership. We still see opportunities in the stock and bond market in 2026. As always, we believe it is imperative for investors to stay focused on their long-term goals and not let short-term swings in the market, which could materialize at any time, derail them from their longer-term objectives.
Please Note: Most economic data has caught up from the government shutdown, however a few readings are still delayed and behind their typical schedule.
Economic Data
| Event | Period | Estimate | Actual | Prior | Revised |
|---|---|---|---|---|---|
| ISM Manufacturing | Dec | 48.4 | 47.9 | 48.2 | 48 |
| ISM Services Index | Dec | 52.2 | 54.4 | 52.6 | 52.4 |
| Change in Nonfarm Payrolls | Dec | 70k | 50k | 64k | 56k |
| Unemployment Rate | Dec | 4.50% | 4.40% | 4.60% | 4.50% |
| Average Hourly Earnings YoY | Dec | 3.60% | 3.80% | 3.50% | 3.60% |
| JOLTS Job Openings | Nov | 7648k | 7146k | 7670k | 7449k |
| PPI Final Demand MoM | Dec | 0.20% | 0.50% | 0.20% | — |
| PPI Final Demand YoY | Dec | 2.80% | 3.00% | 3.00% | — |
| PPI Ex Food and Energy MoM | Dec | 0.20% | 0.70% | 0.00% | — |
| PPI Ex Food and Energy YoY | Dec | 2.90% | 3.30% | 3.00% | 3.10% |
| CPI MoM | Dec | 0.30% | 0.30% | — | — |
| CPI YoY | Dec | 2.70% | 2.70% | 2.70% | — |
| CPI Ex Food and Energy MoM | Dec | 0.30% | 0.20% | — | — |
| CPI Ex Food and Energy YoY | Dec | 2.70% | 2.60% | 2.60% | — |
| Retail Sales Ex Auto and Gas | Nov | 0.30% | 0.40% | 0.50% | 0.40% |
| Industrial Production MoM | Dec | 0.10% | 0.40% | 0.20% | 0.40% |
| Building Permits | Oct P | 1350k | 1412k | 1415k | __ |
| Housing Starts | Oct | 1330k | 1246k | 1306k | — |
| New Home Sales | Oct | 715k | 737k | 738k | — |
| Existing Home Sales | Dec | 4.22m | 4.35m | 4.13m | 4.14m |
| Leading Index | Nov | -0.20% | -0.30% | -0.10% | — |
| Durable Goods Orders | Nov P | 4.00% | 5.30% | -2.20% | -2.10% |
| GDP Annualized QoQ | 3Q T | 4.30% | 4.40% | 4.30% | — |
| U. of Mich. Sentiment | Jan P | 53.5 | 54 | 52.9 | — |
| Personal Income | Nov | 0.40% | 0.30% | 0.10% | — |
| Personal Spending | Nov | 0.50% | 0.50% | 0.50% | — |
| S&P Cotality CS 20-City YoY NSA | Nov | 1.20% | 1.39% | 1.31% | 1.32% |
Source: Bloomberg; P=Preliminary, T=Third Reading.
Forward looking statements cannot be guaranteed. Past performance is not indicative of future results. The opinions referenced are as of the date of publication and are subject to change due to changes in the market or economic conditions and may not necessarily come to pass. Material presented has been derived from sources considered to be reliable and has not been independently verified by us or our personnel. Nothing herein should be construed as a solicitation, recommendation or an offer to buy, sell or hold any securities, other investments or to adopt any investment strategy or strategies. Investors must make their own decisions based on their specific investment objectives and financial circumstances. Investing involves risk, including loss of principal.
Clark Capital Management Group is an investment adviser registered with the U.S. Securities and Exchange Commission. Registration does not imply a certain level of skill or training. More information about Clark Capital Management Group’s advisory services can be found in its Form ADV and/or Form CRS, which are available upon request.
The manager utilizes a proprietary investment model to assist with the construction of the strategy and to assist the manager with making investment decisions. Investments selected using this process may perform differently than expected as a result of the factors used in the model, the weight placed on each factor, and changes from the factors’ historical trends. There is no guarantee that Clark Capital’s use of a model will result in effective investment decisions.
Fixed income securities are subject to certain risks including, but not limited to: interest rate (changes in interest rates may cause a decline in market value or an investment), credit, prepayment, call (some bonds allow the issuer to call a bond for redemption before it matures), and extension (principal repayments may not occur as quickly as anticipated, causing the expected maturity of a security to increase).
Non-investment-grade debt securities (high-yield/junk bonds) may be subject to greater market fluctuations, risk of default or loss of income and principal than higher-rated securities.
The value of investments, and the income from them, can go down as well as up and you may get back less than the amount invested.
Equity securities are subject to price fluctuation and possible loss of principal. Stock markets tend to move in cycles, with periods of rising prices and periods of falling prices. Certain investment strategies tend to increase the total risk of an investment (relative to the broader market). Strategies that concentrate their investments in limited sectors are more vulnerable to adverse market, economic, regulatory, political, or other developments affecting those sectors.
JOLTS is a monthly report by the Bureau of Labor Statistics (BLS) of the U.S. Department of Labor counting job vacancies and separations, including the number of workers voluntarily quitting employment.
The Core Consumer Price Index (CPI) is a measure of the average change over time in the prices paid by urban consumers for a market basket of consumer goods and services.
The Core Producer Price Index (PPI) program measures the average change over time in the selling prices received by domestic producers for their output. The prices included in the PPI are from the first commercial transaction for many products and some services.
The PCE price index, released each month in the Personal Income and Outlays report, reflects changes in the prices of goods and services purchased by consumers in the United States.
References to market or composite indices, benchmarks or other measures of relative market performance over a specified period of time (each, an “index”) are provided for your information only. Reference to an index does not imply that the portfolio will achieve returns, volatility or other results similar to that index. The composition of the index may not reflect the manner in which a portfolio is constructed in relation to expected or achieved returns, portfolio guidelines, restrictions, sectors, correlations, concentrations, volatility or tracking error targets, all of which are subject to change. Investors cannot invest directly in an index.
The Dow Jones Industrial Average® (The Dow®), is a price-weighted measure of 30 U.S. blue-chip companies.
The index covers all industries except transportation and utilities.
The Bloomberg Barclays U.S. Municipal Index covers the USD-denominated long-term tax exempt bond market. The index has four main sectors: state and local general obligation bonds, revenue bonds, insured bonds and prerefunded bonds.
The Bloomberg US Treasury Index measures US dollar-denominated, fixed-rate, nominal debt issued by the US Treasury. Treasury bills are excluded by the maturity constraint, but are part of a separate Short Treasury Index.
The NASDAQ Composite is a stock market index of the common stocks and similar securities listed on the NASDAQ
stock market.
The S&P 500 measures the performance of the 500 leading companies in leading industries of the U.S. economy, capturing 80% of U.S. equities.
The S&P 500® Equal Weight Index (EWI) is the equal-weight version of the widely-used S&P 500. The index includes the same constituents as the capitalization weighted S&P 500, but each company in the S&P 500 EWI is allocated a fixed weight or 0.2% of the index total at each quarterly rebalance.
The University of Michigan Consumer Sentiment Index rates the relative level of current and future economic conditions. There are two versions of this data released two weeks apart, preliminary and revised. The preliminary data tends to have
a greater impact. The reading is compiled from a survey of around 500 consumers.
The Russell 1000 Index is a stock market index that tracks the highest-ranking 1,000 stocks in the Russell 3000 Index, which represent about 93% of the total market capitalization of that index.
The Russell 2000 Index is a small-cap stock market index that represents the bottom 2,000 stocks in the Russell 3000.
The Russell 3000 Index measures the performance of the 3,000 largest U.S. companies based on total market capitalization, which represents approximately 98% of the investable U.S. equity market.
Russell 1000 Growth Index tracks companies with higher price-to-book ratios, higher sales per share growth, and higher I/B/E/S forecast growth.
Russell 1000 Value Index tracks companies with lower price-to-book ratios and lower expected and historical growth rates. Russell’s value indexes focus more on dividend yield.
Nonfarm payrolls (NFPs) are the measure of the number of workers in the United States excluding farm workers and workers in a handful of other job classifications.
A municipal bond, commonly known as a muni, is a bond issued by state or local governments, or entities they create such as authorities and special districts.
The CBOE Volatility Index (VIX) is a real-time index that measures the expected volatility of the S&P 500 over the next
30 days.
The U.S. Treasury index is based on the recent auctions of U.S. Treasury bills. Occasionally it is based on the U.S. Treasury’s daily yield curve.
The 30 Year Treasury Rate is the yield received for investing in a US government issued treasury security that has a maturity of 30 years.
The Bloomberg Barclays U.S. Corporate High-Yield Index covers the U.S. dollar-denominated, non-investment grade, fixed-rate, taxable corporate bond market. Securities are classified as high-yield if the middle rating of Moody’s, Fitch,
and S&P is Ba1/BB+/BB+ or below.
The Bloomberg Barclays U.S. Credit Index measures the investment grade, U.S. dollar denominated, fixed-rate taxable corporate and government related bond markets.
The Bloomberg Aggregate Bond Index or “the Agg” is a broad-based fixed-income index used by bond traders and the managers of mutual funds and exchange-traded funds (ETFs) as a benchmark to measure their relative performance.
The Bloomberg US Trsy Bellwether 30Y is a U.S. Treasury debt obligation that has a maturity of 30 years.
The ISM Non-Manufacturing Index is an index based on surveys of more than 400 non-manufacturing firms’ purchasing and supply executives, within 60 sectors across the nation, by the Institute of Supply Management (ISM). The ISM Non-Manufacturing Index tracks economic data, like the ISM Non-Manufacturing Business Activity Index. A composite diffusion index is created based on the data from these surveys, that monitors economic conditions of the nation.
ISM Manufacturing Index measures manufacturing activity based on a monthly survey, conducted by Institute for Supply Management (ISM), of purchasing managers at more than 300 manufacturing firms.
The MSCI Emerging Markets Index captures large and mid cap representation across 27 Emerging Markets (EM) countries.
The MSCI ACWI ex USA Index captures large and mid cap representation across 22 of 23 Developed Markets (DM) countries (excluding the US) and 27 Emerging Markets (EM) countries*. With 2,359 constituents, the index covers approximately 85% of the global equity opportunity set outside the US.
The S&P CoreLogic Case-Shiller 20-City Composite Home Price NSA Index seeks to measures the value of residential real estate in 20 major U.S. metropolitan areas. The U.S. Treasury index is based on the recent auctions of U.S. Treasury bills. Occasionally it is based on the U.S. Treasury’s daily yield curve.
The Leading Economic Index provides an early indication of significant turning points in the business cycle and where the economy is heading in the near term.
In the United States, the Core Personal Consumption Expenditure Price (CPE) Index provides a measure of the prices paid by people for domestic purchases of goods and services, excluding the prices of food and energy.
The Conference Board’s Leading Indexes are the key elements in an analytic system designed to signal peaks and troughs in the business cycle. The leading, coincident, and lagging economic indexes are essentially composite averages of several individual leading, coincident, or lagging indicators. They are constructed to summarize and reveal common turning point patterns in economic data in a clearer and more convincing manner than any individual component – primarily because they smooth out some of the volatility of individual components.
Gross domestic product (GDP) is the standard measure of the value added created through the production of goods and services in a country during a certain period.