
Rotation, Rotation! Small-Caps and Value Come to Life as Bonds Advance
HIGHLIGHTS:
- Equities moved higher in July, but the nature of the rally changed character. Small-caps and value stocks rallied sharply while large-cap growth struggled, and volatility rose to the highest level since April.
- Bonds enjoyed gains once again in July as interest rates moved lower during the month. These gains pushed several of the bond indices into positive territory year to date. The 10-year U.S. Treasury yield closed the month at 4.09% after ending June at 4.36%.
- The U.S. economy continued to show slowing economic activity. Both ISM indices were below 50 in July and the unemployment rate ticked unexpectedly higher to 4.1%. However, the first reading of Q2 GDP growth showed a much stronger expansion than expected at a 2.8% annualized growth rate compared to estimates of 2.0%.
- The FOMC meeting that concluded on the last day of July resulted in no change to policy rates. We have now gone a full year since the last rate hike in July 2023, but the groundwork is being laid for a rate cut at the next FOMC meeting in September.
EQUITY MARKETS
Since the modest declines in stocks in April, equities have generally moved higher since that point. However, the character of the rally shifted markedly in July with small-caps staging a move higher and value stocks surpassing growth for the month.
New all-time highs were achieved for the S&P 500, Nasdaq Composite, and Dow Jones Industrial average in July, but their returns paled in comparison to the Russell 2000 Index, which is still below levels seen in 2021. See Table 1 for equity results for July 2024, year to date and calendar year 2023.
Table 1
| Index | 24-Jul | YTD | 2023 |
| S&P 500 | 1.22% | 16.70% | 26.29% |
| S&P 500 Equal Weight | 4.49% | 9.79% | 13.87% |
| DJIA | 4.51% | 9.52% | 16.18% |
| Russell 3000 | 1.86% | 15.67% | 25.96% |
| NASDAQ Comp. | -0.73% | 17.71% | 44.64% |
| Russell 2000 | 10.16% | 12.07% | 16.93% |
| MSCI ACWI ex U.S. | 2.32% | 8.14% | 15.62% |
| MSCI Emerging Mkts Net | 0.30% | 7.81% | 9.83% |
The leadership of large-cap growth, and specifically mega-cap Technology companies, took a back seat in July. While it is too early to determine if this is a new trend, the sharp move higher in small-caps seems to signify that at least some broadening might be occurring in the market. The NASDAQ being down during a month with the Russell 2000 Index is up more than 10% is a rare sight indeed. We will monitor rotation in the market in the weeks and months ahead.
We have often discussed the difference between the returns of the headline, market-cap-weighted S&P 500 Index compared to the equal-weighted version of the same stocks. After indicating for some time the leadership of the largest companies in the headline index, the change to small and mid-cap companies can be seen in July with the equal-weighted version surpassing the returns of the traditional S&P 500.
The “average” stock had a better run in July. An additional takeaway is the difference between the Russell 2000 Index and the S&P 500. We have been saying for some time how the S&P 500 is getting more mega-cap tech heavy and narrow in its return drivers — seeing the difference of almost 9% performance between these two indices tells us the S&P 500 reflects primarily larger companies and smaller stocks have very little impact to its results. Across market caps, value outperformed in July with one example being the Russell 1000 Value Index up 5.11% in July while the Russell 1000 Growth Index declined -1.70%.
Developed markets advanced and continue to show solid results so far this year, but emerging markets were more or less flat for the month and lost their leadership to the broader international markets.
We are acutely aware of the sharp declines across the board in equities over the first two trading days of August. We will continue to monitor those developments closely and the portfolio team will make necessary changes as they see fit during this time.
Fixed Income
After hitting the highest level of the year in April, the 10-year U.S. Treasury yield has declined for the last three months with some acceleration occurring in July. This move lower in rates has helped set up generally positive returns for bonds during this period. Most bond sectors have been able to push into positive territory after these recent gains. The 10-year U.S. Treasury closed last year at 3.88%.
Over the course of the first half of the year, it has risen as high as 4.7%, before settling lower in recent months. The yield ended April at 4.69% before closing at 4.51% and 4.36% in May and June, respectively. July ended with the yield declining to 4.09% (with August 1 seeing it close below 4% for the first time since February.) See Table 2 for fixed income index returns for July 2024, year to date, and calendar year 2023.
Table 2
| Index | 24-Jul | YTD | 2023 |
| Bloomberg U.S. Agg | 2.34% | 1.61% | 5.53% |
| Bloomberg U.S. Credit | 2.35% | 1.88% | 8.18% |
| Bloomberg U.S. High Yld | 1.94% | 4.58% | 13.44% |
| Bloomberg Muni | 0.91% | 0.50% | 6.40% |
| Bloomberg 30-year U.S. TSY | 3.64% | -2.78% | 1.93% |
| Bloomberg U.S. TSY | 2.19% | 1.31% | 4.05% |
The more rate-sensitive sectors (like longer-dated U.S. Treasuries) showed the strongest results in July as yields dropped, but the 30-year U.S. Treasury Index is still negative so far this year. High yield bonds often follow what is happening with stocks, so they posted another solid month of gains in July and have the clear lead of the bond indices year to date. At the start of the year, we said we thought the 10-year U.S. Treasury yield would be in a range between 3.25% and 4.5% in 2024 (acknowledging that we got above that level in April). The trend in rates has been lower since those April highs and we believe rates will continue to decline through the second half of this year. Furthermore, as the Fed is likely to begin to cut rates in the Fall, we believe front end rates could start to decline rather dramatically after remaining stubbornly high so far this year.
We maintain our long-standing position favoring credit versus pure rate exposure in this interest rate environment and that has served us well so far in 2024. We also believe the role bonds play in a portfolio, to provide stable cash flow and to help offset the volatility of stocks in the long run, has not changed. Furthermore, we believe that bond yields remain attractive, and we are seeing some of the best bond yields in years. In our opinion, having an active bond management approach makes sense in these volatile times.
Economic Data Highlights and Outlook
The soft landing scenario seems to be developing in the U.S. economy. Data released in July (largely covering June), continued to point to weaker economic growth. However, the first reading of Q2 2024 GDP exceeded expectations at a 2.8% annualized growth rate, compared to estimates of 2.0%. That initial reading showed Q2 growth was twice as strong as the 1.4% expansion during the first quarter. The streak of 6 straight quarters with GDP above 2% was broken in Q1 2024 but it still falls in line with the theme of slower growth, but growth nonetheless in the U.S. economy. Although preliminary, the second quarter reading would get us above that 2% mark once again.
The Atlanta Fed GDPNow estimate for economic growth (as of August 1) shows the economy running at an estimated 2.5% annualized growth rate for the third quarter. That is just above our Clark Capital GDP growth expectation for all of 2024 at 2.25%. We do expect growth to slow in 2024, but we also think the odds favor a soft landing and not a recession at this point.
The job market has recently shown mixed signals. Non-farm payrolls grew by 206,000 in June, surpassing expectations of 190,000. However, the unemployment rate rose unexpectedly to 4.1%, when it was expected to remain at the prior month’s level of 4.0%. The May unemployment rate at 4% was the first such reading that high in over 2 years. The level ticked higher to 4.1% in June, but that rate is still historically low. (In July, the unemployment rate moved unexpectedly higher again to 4.3% – just under a full percentage point off the recent low of 3.4% in April 2023.)
Average hourly earnings grew by 3.9% on an annual basis in June, which matched expectations but was down from the 4.1% annual gain in May. That might help reduce some of the pressure on inflation, but it also means modestly less spending power for consumers. Some moderation in the job market is not unexpected and could allow the Fed to cut rates more comfortably sooner rather than later. Job openings still outnumber the unemployed, but that gap continues to narrow. Chart 1 shows the number of unemployed people in the U.S. compared to job openings.
Chart 1
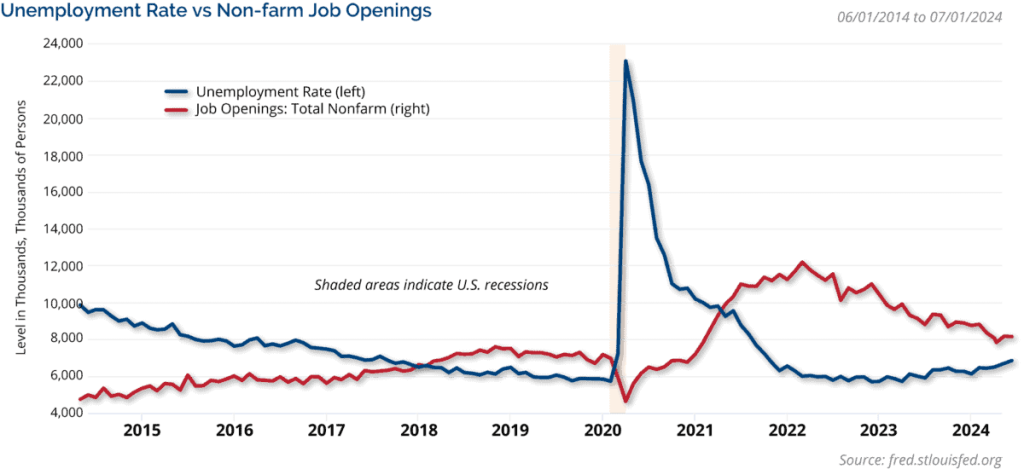
The imbalance between job openings and job seekers has improved, but at the same time, that means strength of the job seeker has diminished over the last few years. Some expected weakness in the job market with more unemployed and fewer job openings should be expected after the rate tightening cycle. However, at this stage, we would describe the recent job market weakness as some needed normalization. With the still solid position of the job market, we maintain our opinion that it seems unlikely that the economy would slow too drastically. We continue to expect that the economy will slow from its pace in 2023, but that it will still grow in 2024 resulting in a “soft landing.“
Even if a recession developed, we believe it would be mild due to the strength of the consumer. We believe opportunities exist in the stock and bond markets under either a slow growth or mild recession scenario, but we believe the odds favor a soft landing at this point.
The Consumer Price Index (CPI) was better than expected in June with a monthly decline of -0.1% compared to expectations of a 0.1% increase. The core CPI reading was up 0.1% compared to estimates of a 0.2% gain for the month. The resulting annual increases were 3.0% and 3.3%, respectively. However, the Producer Price Index (PPI) was higher than expected for the month of June and the year. The annual increase reflected a 2.6% gain on a headline basis compared to expectations of 2.3% and the core reading increased 3.0% versus expectations of 2.5%.
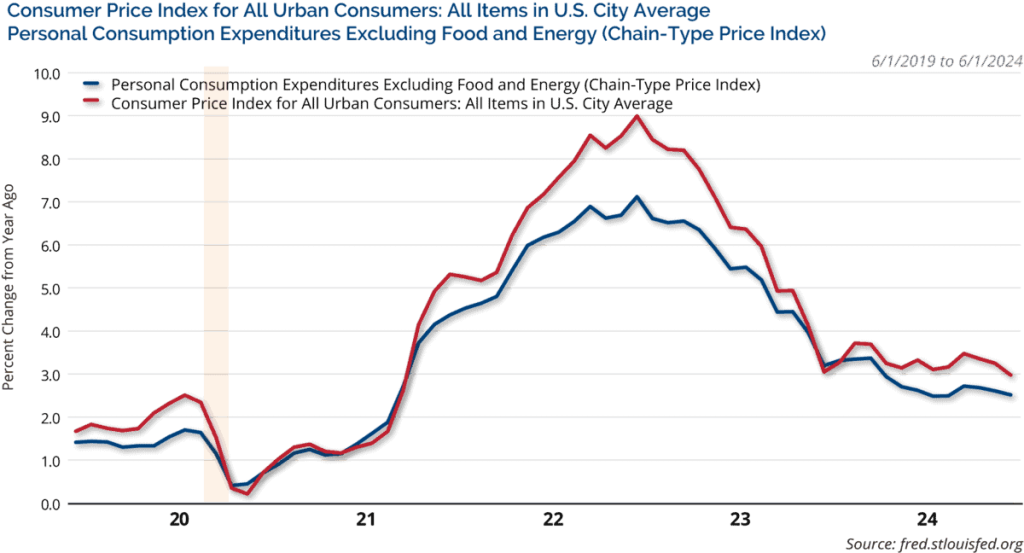
Rounding out the inflation readings for June, the preferred inflation measure of the Fed, the Personal Consumption Expenditures (PCE) Index more or less matched expectations. The headline PCE Index had an annual increase of 2.5% in June after a 0.1% monthly gain as expected. The core PCE reading (the reading the Fed targets) was 2.6%, which modestly exceeded expectations of 2.5% but it matched the level from last month. Inflation readings have improved from the summer of 2022, and we believe are still trending in the right direction. Chart 2 shows the headline CPI and PCE Price Indices.
Chart 2
With inflation improving and the job market showing some recent weakening, market expectations have risen for rate cuts in 2024. At the end of July, the CME FedWatch Tool showed three expected cuts for the balance of 2024 with only three FOMC meetings remaining this year. Chairman Powell in some ways laid the groundwork at the press conference following the July FOMC meeting that September was in play as the time to initiate rate cuts (with his normal caveats included of course).
The housing market continues to fight against higher mortgage rates, but broader interest rates have been heading lower and this should help relieve some of that pressure. (On the first trading day of August, the 10-year U.S. Treasury yield closed below 4% for the first time since February.) June proved to be another choppy month on the housing front. New home sales and existing home sales both fell from the prior month and were below expectations but building permits and housing starts both gained from May and exceeded expectations.
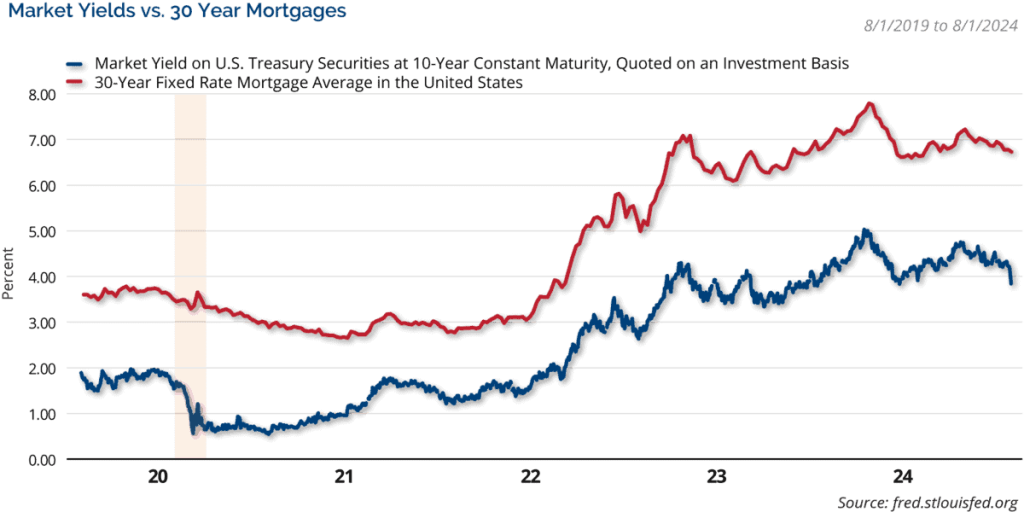
The S&P CoreLogic 20-City Index of home prices rose by 6.81% on an annual basis in May, ahead of expectations of 6.60% but below the prior months annual increase of 7.25%. Mortgage rates tend to follow what is happening with the 10-year U.S Treasury, so the recent decline in Treasury yields should keep the trend moving lower for mortgages rates as well. Chart 3 shows the 10-year U.S. Treasury yield and mortgage rates.
Chart 3
The ISM indices disappointed in June. The ISM Manufacturing Index was expected to stay below 50 at 49.1, but that would have been an improvement from May’s level of 48.7. Instead, it fell to 48.5 and the reading for July showed a further drop to 46.8. Manufacturing seems to clearly be on a weakening trend. The ISM Non-Manufacturing Index, which covers the much larger service industries in the U.S. economy, was a significant disappointment. At 48.8, the reading for June was well below expectations of 52.7 and a sharp drop from the 53.8 level of May. Once again, this is just one month and overall, the service industries have consistently shown growth in recent years. However, the pace of growth has slowed in recent months, but this June reading was undeniably disappointing. We will monitor to see if services bounce back or whether a weakening trend develops. Recall, the dividing line between expansion and contraction for the ISM indices is 50.
Retail sales (ex. auto and gas) were strong with a gain of 0.8%, well ahead of the 0.2% expectations and May’s reading was revised higher. The preliminary University of Michigan Sentiment reading for July fell again to 66.0 from the prior month’s reading of 68.2 and expectations of 68.5. After breaking a two-year streak of declines in February, the Conference Board’s Leading Index has now declined for 4 straight months. For June, it fell -0.2%, which was modestly better than expectations of a -0.3% decline.
Volatility picked up dramatically in July and that trend looks like it might continue based on the first couple of trading days of August. A significant shift in market leadership occurred in July as well, but it is hard to determine if there has been a true shift in trend with less than a full month worth of data. Equity market volatility did help bonds rally and yields dropped sharply during the month. We are anticipating at least three cuts by the Fed through the balance of the year with the kick-off expected at the September FOMC meeting and some whispers that a 50-basis point cut will possibly be on the table.
We maintain our belief that the economy will grow in 2024, but at a more muted pace than last year and that seems to be developing. Over the long run, we believe a strong and growing economy is what ultimately drives business earnings higher, and we think that is paramount for long-term stock market progress.
The good news is that currently, earning expectations for 2024 and 2025 are for double-digit growth, but that is obviously subject to revisions. As always, we believe it is imperative for investors to stay focused on their long-term goals and not let short-term swings in the market derail them from their longer-term objectives.
Investment Implications
Clark Capital’s Top-Down, Quantitative Strategies
Our risk-based credit models remain in a risk-on position. The high yield index ended July trading at a new all-time high and investment grade corporate debt surged higher as duration benefited from anticipated rate cuts coming soon.
Clark Capital’s Bottom-Up, Fundamental Strategies
To date, 315 S&P 500 companies (58% market cap) have reported 2Q results. Reported sales growth is +4.8% and earnings growth is +12.9%, surpassing expectations by +1.0% and +4.4%, respectively. This puts overall sales growth on track for +5.2% and earnings growth for +10.7% (based on reported figures and consensus). While the earnings recovery seems to be broadening, overvalued large-cap companies that have missed expectations have been punished.
ECONOMIC DATA
| Event | Period | Estimate | Actual | Prior | Revised |
| ISM Manufacturing | June | 49.1 | 48.5 | 48.7 | — |
| ISM Services Index | June | 52.7 | 48.8 | 53.8 | — |
| Change in Nonfarm Payrolls | June | 190k | 206k | 272k | 218k |
| Unemployment Rate | June | 4.00% | 4.10% | 4.00% | — |
| Average Hourly Earnings YoY | June | 3.90% | 3.90% | 4.10% | — |
| JOLTS Job Openings | June | 8000k | 8184k | 8140k | 8230k |
| PPI Final Demand MoM | June | 0.10% | 0.20% | -0.20% | 0.00% |
| PPI Final Demand YoY | June | 2.30% | 2.60% | 2.20% | 2.40% |
| PPI Ex Food and Energy MoM | June | 0.20% | 0.40% | 0.00% | 0.30% |
| PPI Ex Food and Energy YoY | June | 2.50% | 3.00% | 2.30% | 2.60% |
| CPI MoM | June | 0.10% | -0.10% | 0.00% | — |
| CPI YoY | June | 3.10% | 3.00% | 3.30% | — |
| CPI Ex Food and Energy MoM | June | 0.20% | 0.10% | 0.20% | — |
| CPI Ex Food and Energy YoY | June | 3.40% | 3.30% | 3.40% | — |
| Retail Sales Ex Auto and Gas | June | 0.20% | 0.80% | 0.10% | 0.30% |
| Industrial Production MoM | June | 0.30% | 0.60% | 0.90% | 0.90% |
| Building Permits | June | 1400k | 1446k | 1386k | 1399k |
| Housing Starts | June | 1300k | 1353k | 1277k | 1314k |
| New Home Sales | June | 640k | 617k | 619k | 621k |
| Existing Home Sales | June | 3.98m | 3.89m | 4.11m | — |
| Leading Index | June | -0.30% | -0.20% | -0.50% | -0.40% |
| Durable Goods Orders | June P | 0.30% | -6.60% | 0.10% | — |
| GDP Annualized QoQ | 2Q A | 2.00% | 2.80% | 1.40% | — |
| U. of Mich. Sentiment | July P | 68.5 | 66 | 68.2 | — |
| Personal Income | June | 0.40% | 0.20% | 0.50% | 0.40% |
| Personal Spending | June | 0.30% | 0.30% | 0.20% | 0.40% |
| S&P CoreLogic CS 20-City YoY NSA | May | 6.60% | 6.81% | 7.20% | 7.25% |
Source: Bloomberg: P=Preliminary, A=Advanced Reading
Past performance is not indicative of future results. The opinions referenced are as of the date of publication and are subject to change due to changes in the market or economic conditions and may not necessarily come to pass. Material presented has been derived from sources considered to be reliable and has not been independently verified by us or our personnel. Nothing herein should be construed as a solicitation, recommendation or an offer to buy, sell or hold any securities, other investments or to adopt any investment strategy or strategies. Investors must make their own decisions based on their specific investment objectives and financial circumstances. Investing involves risk, including loss of principal.
Clark Capital Management Group is an investment adviser registered with the U.S. Securities and Exchange Commission. Registration does not imply a certain level of skill or training. More information about Clark Capital Management Group’s advisory services can be found in its Form ADV which is available upon request.
Fixed income securities are subject to certain risks including, but not limited to: interest rate (changes in interest rates may cause a decline in market value or an investment), credit, prepayment, call (some bonds allow the issuer to call a bond for redemption before it matures), and extension (principal repayments may not occur as quickly as anticipated, causing the expected maturity of a security to increase).
Clark Capital utilizes a proprietary investment model to assist with the construction of the strategy and to assist with making investment decisions. Investments selected using this process may perform differently than expected as a result of the factors used in the model, the weight placed on each factor, and changes from the factors, historical trends. There is no guarantee that Clark Capital’s use of a model will result in effective investment decisions.
Non-investment-grade debt securities (high-yield/junk bonds) may be subject to greater market fluctuations, risk of default or loss of income and principal than higher-rated securities.
Foreign securities are more volatile, harder to price and less liquid than U.S. securities. They are subject to different accounting and regulatory standards and political and economic risks. These risks are enhanced in emerging market countries.
The value of investments, and the income from them, can go down as well as up and you may get back less than the amount invested.
Equity securities are subject to price fluctuation and possible loss of principal. Stock markets tend to move in cycles, with periods of rising prices and periods of falling prices. Certain investment strategies tend to increase the total risk of an investment (relative to the broader market). Strategies that concentrate their investments in limited sectors are more vulnerable to adverse market, economic, regulatory, political, or other developments affecting those sectors.
JOLTS is a monthly report by the Bureau of Labor Statistics (BLS) of the U.S. Department of Labor counting job vacancies and separations, including the number of workers voluntarily quitting employment.
The Core Consumer Price Index (CPI) is a measure of the average change over time in the prices paid by urban consumers for a market basket of consumer goods and services.
The Core Producer Price Index (PPI) program measures the average change over time in the selling prices received by domestic producers for their output. The prices included in the PPI are from the first commercial transaction for many products and some services.
The PCE price index, released each month in the Personal Income and Outlays report, reflects changes in the prices of goods and services purchased by consumers in the United States.
Earnings per share (EPS) is a company’s net profit divided by the number of common shares it has outstanding.
References to market or composite indices, benchmarks or other measures of relative market performance over a specified period of time (each, an “index”) are provided for your information only. Reference to an index does not imply that the portfolio will achieve returns, volatility or other results similar to that index. The composition of the index may not reflect the manner in which a portfolio is constructed in relation to expected or achieved returns, portfolio guidelines, restrictions, sectors, correlations, concentrations, volatility or tracking error targets, all of which are subject to change. Investors cannot invest directly in an index.
The Dow Jones Industrial Average® (The Dow®), is a price-weighted measure of 30 U.S. blue-chip companies. The index covers all industries except transportation and utilities.
The Bloomberg Barclays U.S. Municipal Index covers the USD-denominated long-term tax exempt bond market. The index has four main sectors: state and local general obligation bonds, revenue bonds, insured bonds and prerefunded bonds.
The Bloomberg US Treasury Index measures US dollar-denominated, fixed-rate, nominal debt issued by the US Treasury. Treasury bills are excluded by the maturity constraint, but are part of a separate Short Treasury Index.
The Dow Jones Industrial Average indicates the value of 30 large, publicly owned companies based in the United States.
The NASDAQ Composite is a stock market index of the common stocks and similar securities listed on the NASDAQ stock market.
The S&P 500 measures the performance of the 500 leading companies in leading industries of the U.S. economy, capturing 80% of U.S. equities.
The S&P 500® Equal Weight Index (EWI) is the equal-weight version of the widely-used S&P 500. The index includes the same constituents as the capitalization weighted S&P 500, but each company in the S&P 500 EWI is allocated a fixed weight – or 0.2% of the index total at each quarterly rebalance.
The University of Michigan Consumer Sentiment Index rates the relative level of current and future economic conditions. There are two versions of this data released two weeks apart, preliminary and revised. The preliminary data tends to have a greater impact. The reading is compiled from a survey of around 500 consumers.
The Russell 1000 Index is a stock market index that tracks the highest-ranking 1,000 stocks in the Russell 3000 Index, which represent about 93% of the total market capitalization of that index.
The iShares Russell 1000 Growth ETF seeks to track the investment results of an index composed of large- and mid-capitalization U.S. equities that exhibit growth characteristics.
The Russell 1000 Value Index measures the performance of the large-cap value segment of the U.S. equity universe. It includes those Russell 1000 Index companies with lower price-to-book ratios and lower forecasted growth values.
The Russell 2000 Index is a small-cap stock market index that represents the bottom 2,000 stocks in the Russell 3000.
The Russell 3000 Index measures the performance of the 3,000 largest U.S. companies based on total market capitalization, which represents approximately 98% of the investable U.S. equity market.
Nonfarm payrolls (NFPs) are the measure of the number of workers in the United States excluding farm workers and workers in a handful of other job classifications.
A municipal bond, commonly known as a muni, is a bond issued by state or local governments, or entities they create such as authorities and special districts.
The U.S. Treasury index is based on the recent auctions of U.S. Treasury bills. Occasionally it is based on the U.S. Treasury’s daily yield curve.
The 30 Year Treasury Rate is the yield received for investing in a US government issued treasury security that has a maturity of 30 years.
The 10 Year Treasury Yield is the yield received for investing in a US government issued treasury security that has a maturity of 10 year. The 10 year treasury yield is included on the longer end of the yield curve. Many analysts will use the 10 year yield as the risk free rate when valuing the markets or an individual security.
The Bloomberg Barclays U.S. Corporate High-Yield Index covers the U.S. dollar-denominated, non-investment grade, fixed-rate, taxable corporate bond market. Securities are classified as high-yield if the middle rating of Moody’s, Fitch, and S&P is Ba1/BB+/BB+ or below.
The Bloomberg Barclays U.S. Credit Index measures the investment grade, U.S. dollar denominated, fixed-rate taxable corporate and government related bond markets.
The Bloomberg Aggregate Bond Index or “the Agg” is a broad-based fixed-income index used by bond traders and the managers of mutual funds and exchange-traded funds (ETFs) as a benchmark to measure their relative performance.
The Bloomberg US Trsy Bellwethers 30Y is a U.S. Treasury debt obligation that has a maturity of 30 years.
The ISM Non-Manufacturing Index is an index based on surveys of more than 400 non-manufacturing firms purchasing and supply executives, within 60 sectors across the nation, by the Institute of Supply Management (ISM). The ISM Non-Manufacturing Index tracks economic data, like the ISM Non-Manufacturing Business Activity Index. A composite diffusion index is created based on the data from these surveys, that monitors economic conditions of the nation.
ISM Manufacturing Index measures manufacturing activity based on a monthly survey, conducted by Institute for Supply Management (ISM), of purchasing managers at more than 300 manufacturing firms.
The MSCI Emerging Markets Index captures large and mid cap representation across 27 Emerging Markets (EM) countries.
The MSCI ACWI ex USA Index captures large and mid cap representation across 22 of 23 Developed Markets (DM) countries (excluding the US) and 27 Emerging Markets (EM) countries*. With 2,359 constituents, the index covers approximately 85% of the global equity opportunity set outside the US
The S&P CoreLogic Case-Shiller 20-City Composite Home Price NSA Index seeks to measures the value of residential real estate in 20 major U.S. metropolitan areas. The U.S. Treasury index is based on the recent auctions of U.S. Treasury bills. Occasionally it is based on the U.S. Treasury’s daily yield curve.
The Leading Economic Index provides an early indication of significant turning points in the business cycle and where the economy is heading in the near term.
In the United States, the Core Personal Consumption Expenditure Price (CPE) Index provides a measure of the prices paid by people for domestic purchases of goods and services, excluding the prices of food and energy.
The VIX Index is a calculation designed to produce a measure of constant, 30-day expected volatility of the U.S. stock market, derived from real-time, mid-quote prices of S&P 500® Index (SPX?) call and put options. On a global basis, it is one of the most recognized measures of volatility — widely reported by financial media and closely followed by a variety of market participants as a daily market indicator.
The Conference Board’s Leading Indexes are the key elements in an analytic system designed to signal peaks and troughs in the business cycle. The leading, coincident, and lagging economic indexes are essentially composite averages of several individual leading, coincident, or lagging indicators. They are constructed to summarize and reveal common turning point patterns in economic data in a clearer and more convincing manner than any individual component — primarily because they smooth out some of the volatility of individual components.
Gross domestic product (GDP) is the standard measure of the value added created through the production of goods and services in a country during a certain period.


