
In our Annual Outlook at the beginning of the year we stated, “Markets are cyclical. Corrections are normal. On average the S&P 500 has experienced three 5% corrections a year, a 10% decline once a year, a 15% decline every two years, and a 20% or greater bear market every three years. The major indices have behaved in a linear manner since the bear market lows in October 2022. There were only four 5% or greater corrections and one 10% correction. Last year there were two corrections greater than 5%, and no 10% or greater correction. After 57 new all-time record highs in 2024, and no real correction, we expect the markets to become more cyclical with normal corrections in 2025.”
Corrections Are Normal — Frequency of Declines
| S&P 500 Declines | Occurrences Per Year |
Frequency Average | Probability of Decline Moving to Next Stage | Mean Decline |
| -5% or more | 3.4 | Every 14 weeks | 31% | -10.8% |
| -10% or more | 1.1 | Every year | 46% | -19.4% |
| -15% or more | 0.5 | Every 2 years | 57% | -27.8% |
| -20% or more | 0.3 | Every 3 years | N/A | -35.2% |
After back-to-back 20% plus years of advance, a pullback and correction are both normal and healthy. So, here we are today, from the peak on 2/19, just 16 trading days ago, the S&P 500 has given back 10.04%, the Russell 1000 Growth Index has lost 13.51%, the Russell 1000 Value 6.84%, and the Russell 2000 Index of small cap stocks 12.55%.
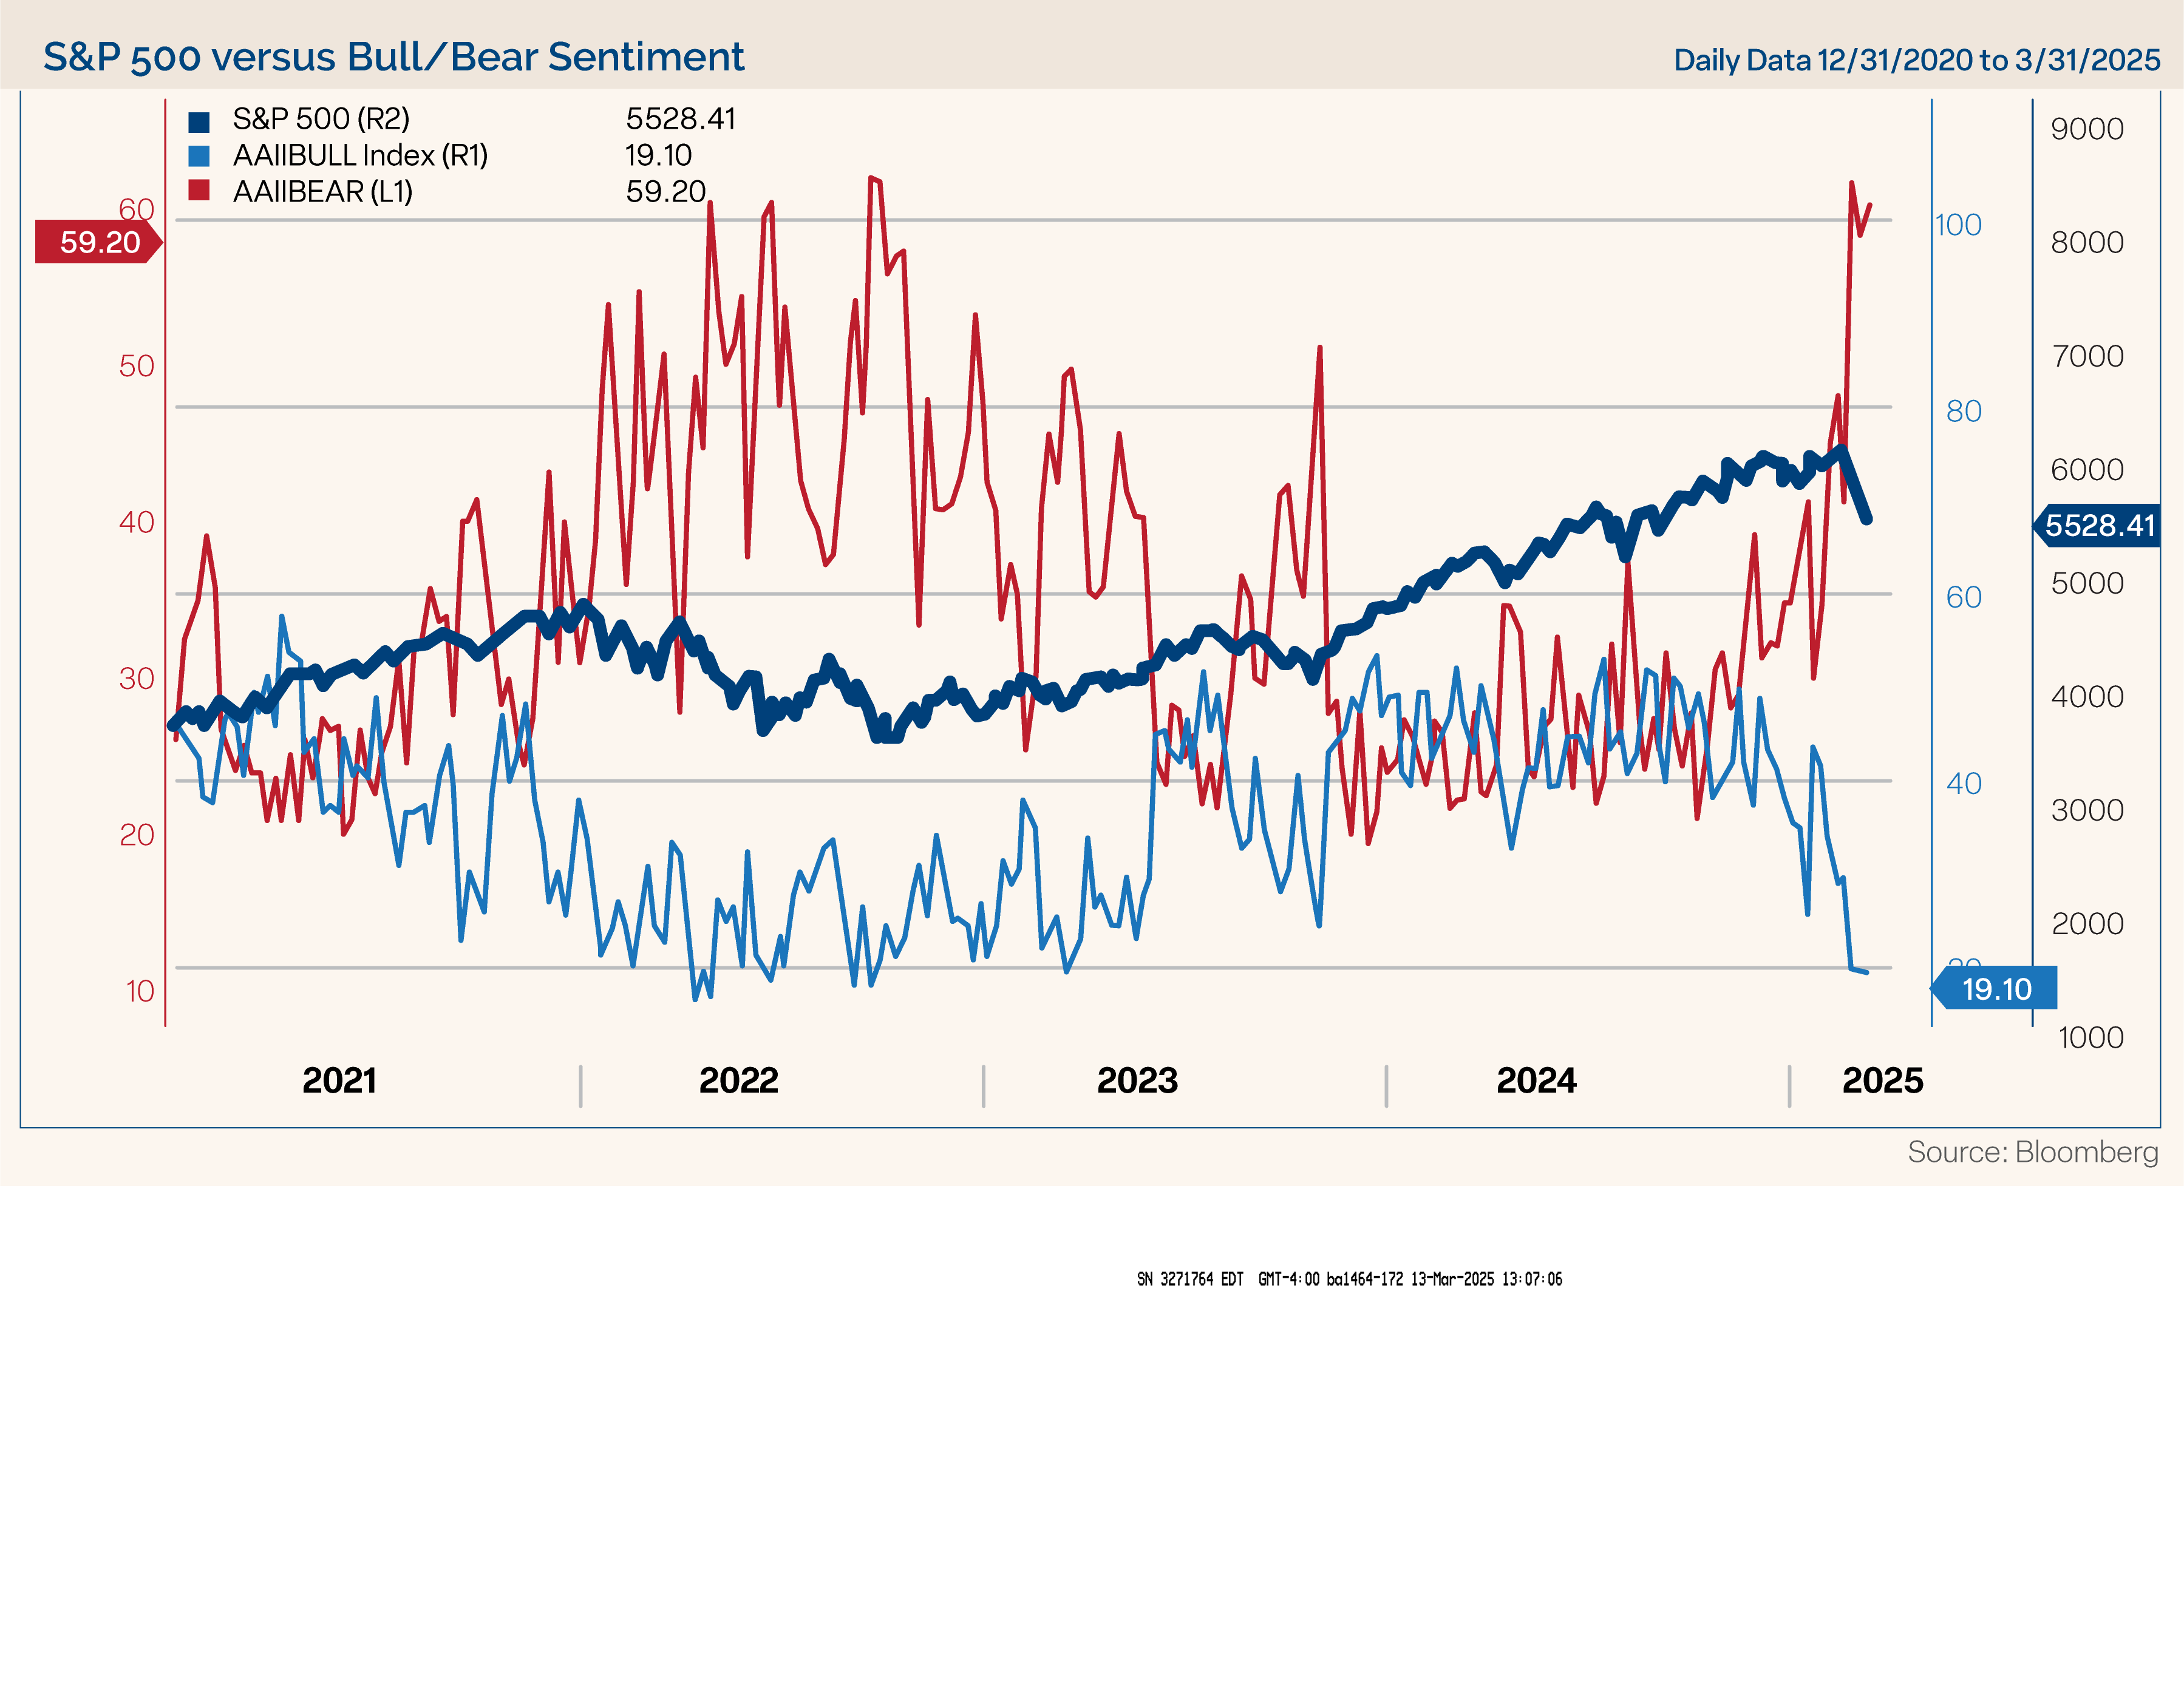
The correction in stocks and weaker economic data, tariff whiplash, chaos in Washington, and a looming government shutdown have weighed on both consumer and investor sentiment. The American Association of Individual Investors (AAII) survey of investor sentiment recently showed that over 60% of investors are bearish and only 19% are bullish. To put that into perspective, the only other times bearish sentiment was over 60% over the past 20 years was during the Global Financial Crisis of 2008 and September 2022, as the market was bottoming. In addition, bearish sentiment has been above 55% for the third straight week. The only other time since 1987 that bearish sentiment was above that level for three weeks straight was in the three weeks ending March 4, 2009.
Other sentiment statistics confirm the pessimistic view of individual investors. For the first time since the lows of 2022, the Investors’ Intelligence survey of bulls versus bears inverted with bears now in the majority. According to Jeff DeGraaf of Renaissance Macro, “Since 1964, the average inversion lasts seven weeks, with a median of four weeks, and while the subsequent four-week returns following the initial inversion are mediocre, the 13- and 26-week returns are well above average. This suggests to us that the policy uncertainty and other factors weighing on investors has started to make its way into the consensus opinion of investors, and that tends to be bullish. At a minimum, we recommend emphasizing the potential bullish outcomes and discounting the potential bearish outcomes as many of them appear to be sentiment based and priced into the tape.”
Remember Warren Buffett’s quote, “Be fearful when others are greedy, and greedy when others are fearful.”
An interesting characteristic of the market selloff is that it has been entirely equity driven, and credit spreads have not widened very much. Equity market dislocations that come without wider credit spreads generally indicate selling is driven by emotions rather than a deteriorating earnings outlook. Consequently, those types of pullbacks typically aren’t as deep and don’t last as long.
Identifying the exact bottom during a sell-off is a fool’s errand. However, we believe market declines that are not accompanied by deteriorating earnings or credit problems typically don’t last long and are relatively shallow. Bottoms are formed with asset prices down and fear levels up. In our opinion, we are experiencing those conditions now.
As always, we believe it is imperative for investors to stay focused on their long-term goals and not let short-term swings in the market derail them from their longer-term objectives.
The opinions referenced are as of the date of publication and are subject to change due to changes in the market or economic conditions and may not necessarily come to pass. There is no guarantee of the future performance of any Clark Capital investments portfolio. Material presented has been derived from sources considered to be reliable and has not been independently verified by us or our personnel. Nothing herein should be construed as a solicitation, recommendation or an offer to buy, sell or hold any securities, other investments or to adopt any investment strategy or strategies. For educational use only. This information is not intended to serve as investment advice. This material is not intended to be relied upon as a forecast or research. The investment or strategy discussed may not be suitable for all investors. Investors must make their own decisions based on their specific investment objectives and financial circumstances. Past performance does not guarantee future results.
Fixed income securities are subject to certain risks including, but not limited to: interest rate (changes in interest rates may cause a decline in market value of an investment), credit, payment, call (some bonds allow the issuer to call a bond for redemption before it matures), and extension (principal repayments may not occur as quickly as anticipated, causing the expected maturity of a security to increase).
Equity securities are subject to price fluctuation and possible loss of principal. Stock markets tend to move in cycles, with periods of rising prices and periods of falling prices. Certain investment strategies tend to increase the total risk of an investment (relative to the broader market). Strategies that concentrate their investments in limited sectors are more vulnerable to adverse market, economic, regulatory, political, or other developments affecting those sectors. Treasury yield is the return on investment, expressed as a percentage, on the U.S. government’s debt obligations. Looked at another way, the Treasury yield is the effective interest rate that the U.S. government pays to borrow money for different lengths of time.
References to market or composite indices, benchmarks or other measures of relative market performance over a specified period of time (each, an “index”) are provided for your information only. Reference to an index does not imply that the portfolio will achieve returns, volatility or other results similar to that index. The composition of the index may not reflect the manner in which a portfolio is constructed in relation to expected or achieved returns, portfolio guidelines, restrictions, sectors, correlations, concentrations, volatility or tracking error targets, all of which are subject to change. Investors cannot invest directly in an index.
The Russell 1000 Growth Index measures the performance of the large-cap growth segment of the U.S. equity universe. It includes those Russell 1000 Index companies with higher price-to-book ratios and higher forecasted growth values.
The Russell 1000 Value Index measures the performance of the large-cap value segment of the U.S. equity universe. It includes those Russell 1000 Index companies with lower price-to-book ratios and lower forecasted growth values.
The Russell 2000 Index measures the performance of the 2000 smallest U.S. companies based on total market capitalization in the Russell 3000, which represents approximately 10% of Russell 3000 total market capitalization.
The Russell 3000 Index is a capitalization-weighted stock market index that seeks to be a benchmark of the entire U.S. stock market.
The Standard and Poor’s 500, or simply the S&P 500, is a stock market index tracking the stock performance of 500 large companies listed on stock exchanges in the United States.
This document may contain certain information that constitutes forward-looking statements which can be identified by the use of forward-looking terminology such as “may,” “expect,” “will,” “hope,” “forecast,” “intend,” “target,” “believe,” and/ or comparable terminology (or the negative thereof). Forward looking statements cannot be guaranteed.
Clark Capital Management Group, Inc. is an investment adviser registered with the U.S. Securities and Exchange Commission. Registration does not imply a certain level of skill or training. More information about Clark Capital’s advisory services and fees can be found in its Form ADV and/or Form CRS which are available upon request.

