
Clark Capital’s Bottom-Up, Fundamental Strategies
April was shaped by ongoing geopolitical tension and narrow market leadership. Escalation in the Iran conflict early in the month pushed oil prices higher, pressuring equities and reinforcing inflation concerns. Markets swung with each headline, rallying on signs of de-escalation and pulling back as tensions resurfaced. For the month, yields trended slightly higher with the 10-year Treasury yield closing at 4.37%, 5 basis points (bps) higher than March. The move was slightly more pronounced at the shorter end of the curve with the two-year note moving 7 bps higher to close at 3.87%.
At the start of the month, markets broadly expected two rate cuts in 2026, with the first cut around midyear. That outlook deteriorated significantly as inflation concerns persisted, with investors pushing out or removing cuts altogether. This creates a tougher backdrop for rate sensitive proxies, placing greater emphasis on business momentum and durable growth companies. Central banks, unsurprisingly, opted for patience. The Fed remained on hold as policymakers weighed the growth drag against energy driven inflation risk, reinforcing a “higher for longer” bias even as core disinflation trends held up. The result is a market increasingly comfortable underwriting earnings strength but less sanguine about the macro path. Against this backdrop, leadership remained narrow but powerful: AI and capex linked names continued to do the heavy lifting, backed by an unprecedented ~$650–700 billion hyperscaler investment cycle that is simultaneously driving earnings growth and raising uncomfortable questions about returns on capital.
In the equity portfolios, the focus remains on owning companies we view as high quality with solid business momentum. On the fixed income side, the taxable bond focus remained consistent with previous months, keeping duration longer than the index and moving maturing and slightly longer bonds into the five-year and longer portion of the yield curve. As rates moved higher throughout the month, duration was extended slightly longer than previous months to take advantage of the excess yield opportunities.
Below are strategy updates from April:
Navigator® All Cap Core U.S. Equity
- The portfolio is fully invested with over ~63% in large-cap stocks and the remainder in mid-/small-cap companies and cash.
- The portfolio continues to balance portfolio holdings between dominant large-cap growth companies and those anti-fragile large-, small-, and mid-cap companies that continue to see strong business momentum.
- The three largest portfolio sectors at the end of the period were Information Technology, Financials, and Communication Services.
- Our current weighting in the Big Six free cash flow margin monopolies is 31.3% vs. approximately 28.4% in the Russell 3000. Information Technology remains the largest sector weight in the strategy at 30.3%, a 1.8% underweight to the Russell 3000 benchmark.
- The two most recent additions to the portfolio were a health insurance company and a biotechnology company.
- The three most recent exits were one of the largest hospital and healthcare management companies in the United States, a biopharmaceutical company focused on immunology, oncology, and neuroscience, and a consumer products company known for premium outdoor and recreation gear.
Navigator® High Dividend Equity
- The portfolio is positioned with approximately 98% in developed countries with the remainder in cash.
- The United States is the largest country weight at 92.1%, followed by the United Kingdom at 3.4% and Switzerland at 1.5%.
- Approximately 88.6% of the portfolio is large cap, with the remainder in mid cap and cash.
- Financials represent the largest sector weight of 18.6%, nearly 1% below the benchmark weight. The next three largest portfolio weights are Industrials, Information Technology, and Health Care at 14.5%, 13.6% and 10.4%, respectively.
- The most recent additions to the portfolio were in a U.S. auto parts & equipment manufacturer, a U.S. railroad company, and a semiconductor company.
- The most recent exits were in commercial services, banking, and advertising.
Navigator® Large Cap Growth
- The portfolio is fully invested with ~86% of the portfolio in large-cap stocks and the balance in mid-cap stocks and cash.
- Approximately 99% of total holdings are in developed countries with approximately 95% based in the United States.
- Over 70% of portfolio holdings are derived from the 100 largest cash-flow producing companies with high and growing cash flows, high cash-flow margins, and increasing sales.
- The three largest portfolio sectors at the end of the period were Information Technology, Communication Services, and Consumer Discretionary.
- Our current weighting in the Big Six free cash flow margin monopolies is 52.9% vs. approximately 49.7% in the Russell 1000 Growth. Albeit underweight to the benchmark, Information Technology remains the largest sector weight in the strategy at 46.1%.
- The most recent addition to the portfolio was one of the largest diversified health and well-being companies in the United States.
- The two most recent exits were a medical device manufacturer and a software company known for creative, marketing, and document management tools.
Navigator® International Equity ADR
- The portfolio is positioned with ~13.4% in emerging/frontier markets with the balance in developed economies and cash.
- United Kingdom, Japan, Canada, and Switzerland are the strategy’s largest country weights, all ranging between 7% and 18%.
- The three largest portfolio sectors at the end of the period were Financials, Information Technology, and Industrials.
- The two most recent additions to the portfolio were a Swiss multinational consumer goods company and a Chinese automotive manufacturer.
- The three most recent exits were a multinational tobacco company headquartered in Tokyo, an Italian multinational banking group, and a Japanese telecommunications company.
Navigator® Small Cap Core U.S. Equity
- The portfolio remains fully invested with ~89% of the portfolio in small-cap stocks with the balance in mid-cap stocks and cash.
- The portfolio continues to balance portfolio holdings between anti-fragile small- and mid-cap companies characterized by high cash-flow margins and high cash-flow yields, alongside those companies exhibiting accelerating business momentum.
- The three largest portfolio sectors at the end of the period were Industrials, Financials, and Information Technology.
- The most recent addition to the portfolio was a clean energy technology company.
- The three most recent exits were an integrated natural gas company, a midstream natural gas company, and a lighting and building management solutions company.
Navigator® SMID Cap Core U.S. Equity
- The portfolio remains fully invested with ~66% of the portfolio in small-cap stocks, ~32% in mid-cap stocks, and the balance in large-cap stocks and cash.
- The portfolio continues to balance portfolio holdings between anti-fragile small- and mid-cap companies characterized by high cash-flow margins and high cash-flow yields, alongside those companies exhibiting accelerating business momentum.
- The three largest portfolio sectors at the end of the period were Financials, Industrials, and Information Technology.
- The three most recent additions to the portfolio were a healthcare services holding company operating hospice care and plumbing businesses, a luxury fashion holding company, and a flash storage technology company.
- The three most recent exits were one of the largest hospital and healthcare management companies in the United States, a consumer products company known for premium outdoor and recreation gear, and a midstream natural gas company.
Navigator® Taxable Fixed Income
- Within the portfolio, the focus remained consistent with previous months, keeping duration longer than the index and moving maturing and slightly longer bonds into the five-year and longer portion of the yield curve.
- As rates moved higher throughout the month, duration was extended slightly longer than previous months to take advantage of the excess yield opportunities.
- This strategy of maximizing yield and extending duration will continue as long as interest rates remain elevated.
Navigator® Tax-Free Fixed Income
- Healthy demand for appealing marginally longer real yields created a bull-flattener in munis for the month.
- We still like our barbell trade and feel performance remains with a slightly longer bias, or at a minimum expressing our target duration through investment in a barbell structure.
- We remain vigilant on school districts both large and small; we currently are approximately 1.75 ratios lighter than the index in school district debt.
- In terms of school districts, we will invest where we feel robust safeguards exist in the form of state aid intercept programs. 4% to 5% taxable equivalent yields remain our targets in the asset class, and while they may have migrated a bit further out the curve, they remain in our sight.
- We are maintaining overweight exposure in pollution control, industrial development, and general-purpose general obligation bonds, where revenue streams are clearer and have greater degrees of “adjustability” based on debt paying needs.
Clark Capital’s Top-Down, Quantitative Strategies
The rebound from the March 30 lows has been historic. It took the S&P 500 42 days to go from its peak on January 27 to its March 30 low, then only 11 days to hit a new all-time high. From the March 30 low through the end of April the S&P 500 gained 13.7%, the Russell 20000 Index of small cap stocks rose 16.2%, large-cap growth advanced 16.1%, and the MSCI ACWI ex-US international benchmark climbed 9.8%. It was the best month for the S&P 500 since November 2020. All the while most investor sentiment statistics showed investors remained cautious throughout the recovery due to fears of the war in Iran, inflation pressure from rising energy costs, and a perceived uncertain economic environment.
At the beginning of the conflict, we said, “The declines in the market so far are consistent with past geopolitical shocks. Looking back at 59 crisis events since 1907, the initial drop for the market averaged 7.0%, with one-, three-, six-, and twelve-month average returns all higher.” That script played out this time too, but even stronger than historical precedent. As it stands today, broad indices such as the S&P 500, the Russell 2000, Nasdaq 100, and the Bloomberg High Yield Index are all trading at record highs. Credit and trends remain supportive of the move higher, and high yield credit spreads are only 16 bps above recent cycle lows.
At the strategy level, Fixed Income Total Return, Global Tactical, Global Risk Managed, and others remain risk-on, while Tactical Investment Grade remains maintains a risk-off bias as Treasuries and investment grade corporate debt have been pressured by rising 10-year Treasury yields.
Below are strategy updates from April:
Navigator® Alternative
- Managed futures and options-based strategies were strongest within the portfolio’s mutual fund core, while multi-strategy funds continued to drag.
- As the rally set in, the portfolio sold clean energy and reduced an AI ETF.
- We also added to gold, silver, an agriculture ETN, and metals and mining.
Navigator® Fixed Income Total Return (MultiStrategy Fixed Income)
- As equities rebounded, credit spreads contracted sharply and now are near all-time historical lows, and all of this occurred even as oil continues to spike to over $120 per barrel.
- Oil prices, even when spiking, have proven to have only a modest effect on the broad U.S. economy and credit markets (but the fate of the consumer is still unknown).
- Our position in high yield should be maintained for the foreseeable future.
Navigator® Global Risk Management
- Our models declined but remained positive enough to keep hold of risk-facing equities.
- The president’s announcement March 30 that the war in Iran would have a limited timeline was all investors needed to hear. Since then, equities have taken off, led by Technology and large growth.
- Our credit-based models returned to new highs. Our risk-facing position should be sustained in the coming quarters.
Navigator® Global Tactical
- At the height of the Iran war tensions, our models had weakened considerably, but with much less magnitude than equities.
- The rebound in credit and stocks was nearly immediate after March 30. Credit spreads returned to near their all-time historic lows, and once again the bullish message from credit proved correct, as the equity fears and selloff proved unsustainable.
- We maintain our risk-on position in equities.
Navigator® U.S. Sector Opportunity
- The portfolio sold out of first quarter leaders like Energy, Aerospace, Defense, and Utilities as markets rebounded in April.
- Technology, data centers, and semiconductors were purchases or adds.
- Consumer Discretionary, Financials, and Health Care rank poorly in our matrix and are to be avoided.
Navigator® U.S. Style Opportunity (MultiStrategy Equity)
- In February and March, the portfolio moved to favor large-cap value and cash flow yield. That trend persisted into late March when investors’ fears peaked regarding the Iran war.
- After the bottom, the rebound was so dramatic that it took just over two weeks for markets to make new highs.
- By late April, the portfolio sold value and cash flow yield and purchased large-cap growth.
- We also maintain positions in mid-cap momentum and small caps, along with a large, indexed position.
Navigator® U.S. Strategic Beta
- The portfolio continues to modestly favor large growth and very modestly favor mid and small caps.
- Technology and mega caps endured a sharp correction between September and the end of March, leaving large growth relatively attractive historically.
- As this rally builds, our next move could be to trim our beta and biases back to neutral. Scant evidence exists to justify any genuine defensive action.
Disclosures
The views expressed are those of the author(s) and do not necessarily reflect the views of Clark Capital Management Group. The opinions referenced are as of the date of publication and are subject to change due to changes in the market or economic conditions and may not necessarily come to pass. There is no guarantee of the future performance of any Clark Capital investments portfolio. Material presented has been derived from sources considered to be reliable, but the accuracy and completeness cannot be guaranteed. Nothing herein should be construed as a solicitation, recommendation or an offer to buy, sell or hold any securities, other investments or to adopt any investment strategy or strategies. For educational use only. This information is not intended to serve as investment advice. This material is not intended to be relied upon as a forecast or research. The investment or strategy discussed may not be suitable for all investors. Investors must make their own decisions based on their specific investment objectives and financial circumstances. Past performance does not guarantee future results. All investing involves risk, including the loss of principal, and there can be no guarantee investment objectives will be met.
Clark Capital Management Group (Clark) is an investment adviser registered with the U.S. Securities and Exchange Commission. Registration does not imply a certain level of skill or training. More information about Clark’s investment advisory services can be found in its Form ADV Part 2 and/or Form CRS, which are available upon request.
Fixed income securities are subject to certain risks including, but not limited to: interest rate (changes in interest rates may cause a decline in market value of an investment), credit, payment, call (some bonds allow the issuer to call a bond for redemption before it matures), and extension (principal repayments may not occur as quickly as anticipated, causing the expected maturity of a security
to increase).
Foreign securities are more volatile, harder to price and less liquid than U.S. securities. They are subject to different accounting and regulatory standards and political and economic risks. These risks are enhanced in emerging market countries.
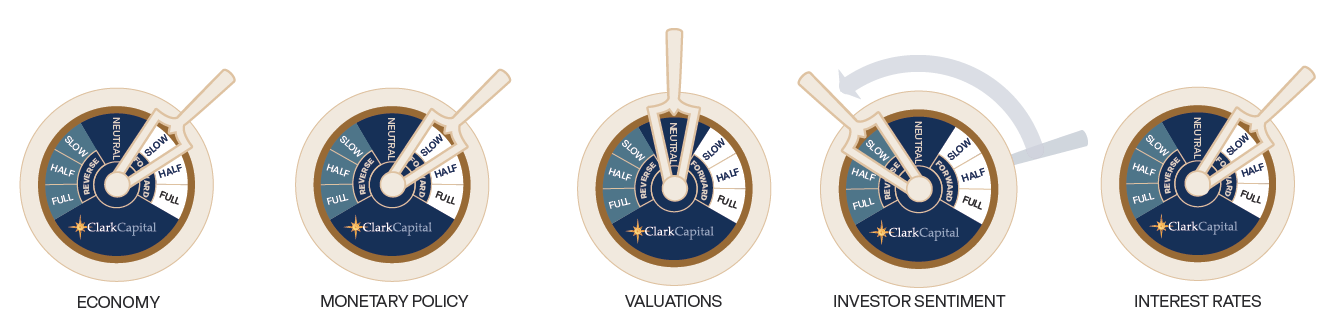
The “Economic Gauges” represent the firm’s expectations for the market, and how changes in the market will affect the strategy, but are only projections which assume certain economic conditions and industry developments and are subject to change without notice. For educational use only.
The S&P 500 measures the performance of the 500 leading companies in leading industries of the U.S. economy, capturing 75% of U.S. equities.
A 10-year Treasury note is a debt obligation issued by the U.S. Treasury Department that has a maturity of 10 years.
Treasury yield is the return on investment, expressed as a percentage, on the U.S. government’s debt obligations. Looked at another way, the Treasury yield is the effective interest rate that the U.S. government pays to borrow money for different lengths of time.
An AA bond rating signifies very high credit quality and a very low risk of default for a bond issued by a government or corporation, indicating a very strong ability to meet financial commitments that is not significantly vulnerable to foreseeable events. While not as exceptional as the highest AAA rating, an AA rating still provides strong reassurance to investors that their investment is secure.
An A rated bond signifies “high credit quality,” indicating a low risk of default, though it is more vulnerable to adverse economic conditions than higher-rated bonds. These ratings are issued by agencies like Fitch, S&P, and Moody’s, reflecting the issuer’s strong capacity to meet financial commitments, but with a greater potential risk than AA or AAA bonds.
A BBB-rated bond is an investment-grade bond that signifies an adequate, though not strong, capacity to meet financial commitments, carrying a low risk of default under normal conditions but a greater susceptibility to adverse economic or business factors compared to higher-rated bonds. In essence, these are considered the lowest tier of “safe” bonds before moving into the more speculative “junk” bond category.
The chartered financial analyst (CFA) charter is a globally-recognized professional designation offered by the CFA Institute, an organization that measures and certifies the competence and integrity of financial analysts.
Non-investment-grade debt securities (high-yield/junk bonds) may be subject to greater market fluctuations, risk of default or loss of income.
The Russell 1000 Value Index tracks companies with lower price-to-book ratios and lower expected and historical growth rates. Russell’s value indexes focus more on dividend yield.
The Russell 2000 Index measures the performance of the 2000 smallest U.S. companies based on total market capitalization in the Russell 3000, which represents approximately 10% of Russell 3000 total market capitalization.
The Bloomberg U.S. Corporate High-Yield Index covers the U.S. dollar-denominated, non-investment grade, fixed-rate, taxable corporate bond market. Securities are classified as high-yield if the middle rating of Moody’s, Fitch, and S&P is Ba1/BB+/BB+ or below. The S&P 500 and the Barclays U.S. Aggregate Bond Index are used as supplemental benchmarks.
The Bloomberg US Treasury Index measures US dollar-denominated, fixed-rate, nominal debt issued by the US Treasury. Treasury bills are excluded by the maturity constraint but are part of a separate Short Treasury Index. STRIPS are excluded from the index because their inclusion would result in double-counting. The US Treasury Index is a component of the US Aggregate, US Universal, Global Aggregate and Global Treasury Indices.
The MSCI All Country World ex USA Total Return (MSCI ACWI) is a market capitalization weighted index designed to provide a broad measure of equity-market performance throughout the world. The MSCI ACWI is maintained by Morgan Stanley Capital International and is comprised of stocks from both developed and emerging markets.
ICE BofA US Corporate C Index, a subset of the ICE BofA US High Yield Master II Index, tracks the performance of US dollar denominated below investment grade rated corporate debt publicly issued in the US domestic market. This subset includes all securities with a given investment grade rating CCC or below.
Equity securities are subject to price fluctuation and possible loss of principal. Stock markets tend to move in cycles, with periods of rising prices and periods of falling prices. Certain investment strategies tend to increase the total risk of an investment (relative to the broader market). Strategies that concentrate their investments in limited sectors are more vulnerable to adverse market, economic, regulatory, political, or other developments affecting those sectors.

