
Clark Capital’s Bottom-Up, Fundamental Strategies
Equities continue to benefit from rising earnings and an accommodative Federal Reserve. In mid-December, the Fed cut the short-term rate by 25 basis points (bps) to 3.75%, its third reduction since September, as slowing job gains pushed unemployment to 4.6%. This action places the fed funds rate just 85 bps above the 12-month core PCE inflation rate, signaling a more neutral policy stance.
The economy and corporate earnings continue to surprise to the upside. Real GDP jumped 4.3% to a new record high during the third quarter (announced in mid-December), and corporate profits also hit a new record high during the third quarter. Looking ahead, we anticipate the strongest earnings momentum to continue in areas of the market exposed to AI, Defense, Industrials, and Financials.
International equities capped off a stellar 2025, outperforming U.S. large-cap growth, value, and small-cap indices with an approximate 3% gain in December. For the full year, the MSCI All Country ex-U.S. Index delivered over 33%, outpacing the broad Russell 3000 Index by 15% and the MAG7-driven Russell Large Cap Growth Index by 13%.
Below are strategy updates from December:
Navigator® All Cap Core U.S. Equity
- The portfolio is fully invested with over 73% in large-cap stocks and the remainder in mid-cap companies, small-cap companies, and cash.
- The portfolio continues to balance portfolio holdings between dominant large-cap growth companies and those anti-fragile large-, small-, and mid-cap companies that continue to see what we consider to be strong business momentum.
- The three largest portfolio sectors at the end of the period were Information Technology, Financials, and Industrials.
- Our current weighting in the big six free cash flow margin monopolies is 27.8% vs. approximately 28.7% in the Russell 3000. Albeit underweight to the benchmark, Information Technology remains the largest sector weight in the strategy at 31.2%.
- During the month, to benefit from improving business fundamentals, the three most recent additions to the portfolio were an electric vehicle and energy storage manufacturer, a global advertising and marketing services company, and a provider of cloud-based customer relationship management software.
- The three most recent exits were a global electronic payments network, a U.S.-based provider of online education and digital learning programs, and a global tobacco company.
Navigator® High Dividend Equity
- The portfolio is positioned with approximately 98% in developed countries with the remainder in cash. The United States is the largest country weight at 89.0%, followed by Ireland at 3.5%, and the United Kingdom at 3.1%.
- Over 97% of the portfolio is large cap with the remainder in cash.
- Financials remain the largest sector weight at 22.2%, slightly below the benchmark weight. The next three largest portfolio weights are Industrials, Health Care, and Information Technology at 16.4%, 12.2% and 11.8%, respectively.
- To benefit from improving business fundamentals during the month, the most recent additions to the portfolio were a global energy technology company focused on power generation and transmission and a global consulting and technology services firm.
- Recent exits included a liquefied natural gas producer and exporter and an enterprise data storage and cloud data management company.
Navigator® Large Cap Growth
- The portfolio is fully invested with over 96% in large-cap stocks.
- Approximately 99% of total holdings are in developed countries with approximately 92% based in the United States.
- Over 70% of portfolio holdings are derived from the 100 largest cash-flow-producing companies with high and growing cash flows, high cash flow margins, and increasing sales.
- The three largest portfolio sectors at the end of the period were Information Technology, Communication Services, and Consumer Discretionary.
- Our current weighting in the big six free cash flow margin monopolies is 52.8% vs. approximately 47.9% in the Russell 1000 Growth. Albeit underweight to the benchmark, Information Technology remains the largest sector weight in the strategy at 47.5%.
- To benefit from improving business fundamentals during the month, the three most recent additions to the portfolio were a consumer beverage company focused on energy drinks, a developer of robotic-assisted surgical systems, and a diversified health care company offering insurance and health services.
- The three most recent exits were a pharmaceutical distributor and health care supply chain services provider, a global tobacco company, and a global investment firm specializing in private equity, credit, and alternative assets.
Navigator® International Equity ADR
- The portfolio is positioned with ~16% in emerging/frontier markets with the balance in developed economies and cash.
- Britain, Canada, Ireland, Japan, Spain, and Switzerland are the strategy’s largest country weights, all ranging between 6% and 16%.
- The three largest portfolio sectors at the end of the period were Financials, Information Technology, and Industrials.
- To benefit from improving business fundamentals during the month, the most recent addition to the portfolio was a diamond jewelry retailer operating multiple global brands.
- The three most recent exits were a global brewer, a Brazilian financial technology, and a global e-commerce and technology company.
Navigator® Taxable Fixed Income
- Within the portfolio, the focus remained consistent with previous months, keeping duration slightly longer than the index and moving maturing and slightly longer bonds into the five-year and longer portion of the yield curve.
- We sold shorter maturity bank bonds and reinvested into higher-yield, longer-maturity bonds.
- The portfolio also moved out the curve where four-year bonds were sold and 7-10 year bonds purchased.
- This thesis of maximizing yield while also positioning to maximize total return will continue to be the near-term focus.
Navigator® Tax-Free Fixed Income
- Overall, the muni market steepened over the month illustrating that the growth of the short-term buying audience and a fear of sticky inflation is making its way through the muni market.
- The continued steepening in long intermediates (15 to 20 years) makes for an attractive investment versus fighting the herd at 7-10 years. We will continue to make tactical allocations in 15 to 20 years.
- To offset that duration and take advantage of an incredibly flat short-term curve, we will stay with the barbell strategy and buy bonds in the first three years of the curve.
Clark Capital’s Top-Down, Quantitative Strategies
The last two weeks of the year were quiet with holidays and shortened trading weeks. Nonetheless, equity markets grinded higher with the major indices hitting new all-time highs into year end. The S&P 500 capped a third year in a row of better than 15% gains, gaining 17.9%, following 24.23% in 2023 and 23.31% in 2024.
In general, equity market participation has broadened with value, quality, and small caps joining the advance. The Style Opportunity portfolio is neutral regarding value vs. growth and large cap vs. small cap. Tactical strategies including Fixed Income Total Return, Global Tactical, and Global Risk Management remain positioned in their respective risk-on asset classes, which they assumed in late April/early May. Liquidity remains abundant, financial conditions remain supportive of risk assets, and credit spreads are trading near the year’s tightest levels and their lowest levels in five years.
Below are strategy updates from December:
Navigator® Alternative
- Last month, multi-strategy and managed futures were strong contributors in the mutual fund core, while long/short equity was a detractor.
- After sizeable precious metals gains, we will be watching closely for a breakdown in 2026.
- We recently added new risk-on positions in cloud computing, clean energy, and natural resources.
Navigator® Fixed Income Total Return (MultiStrategy Fixed Income)
- Our credit-based models continue to be strong and are near new highs.
- High yield spreads remain near long-term historical lows.
- CCC high yield is slightly lagging behind, but its stalling has not yet affected our broader model.
Navigator® Global Risk Management
- Our quantitative models continue to be very strong, buoyed by a Fed easing cycle and a sound, growing economy.
- While notable talk of a weaker lower-end consumer exists, we are reminded that when consumer sentiment reaches such soft levels, that often is bullish for stocks.
- Our models point toward sound corporate fundamentals, and a rebound by the consumer in 2026 could be another bullish catalyst.
Navigator® Global Tactical
- The portfolio began to reestablish a risk-on position in late April.
- By early May, we moved to 100% favoring equities. Since then, our credit-based models have been strong and remain at or near new highs.
- The corrections that we have seen in stocks have not filtered down to corporate balance sheet fundamentals. Until that changes, our risk-facing approach will continue into 2026.
Navigator® U.S. Sector Opportunity
- Health Care ETFs top our rankings, and we allocate 29% to the sector, including pharma, biotech, and broad Health Care.
- Metals and mining continue to be the market’s strongest single segment, driven by precious metals.
- We recently added Financials and Industrials to the mix, and while we have reduced Technology, we continue to own the NASDAQ 100 and semiconductors.
- Discretionary, Staples, and Energy rank lowest and are to be avoided.
Navigator® U.S. Style Opportunity (MultiStrategy Equity)
- The portfolio currently owns large-cap value, large-cap growth, and small-cap ETFs, along with a large indexed position of over 60%.
- The portfolio is neutral with regard to value vs. growth and large vs. small.
- We cannot detect a clear style or factor leader at this time.
Navigator® U.S. Strategic Beta
- After briefly reducing its risk profile in late October, the portfolio returned to a modestly bullish risk position with a modest bias towards growth stocks.
- We expect to continue a modestly bullish stance into 2026, but we will be watchful for rising interest rates and extreme optimism in sentiment, which could be signs that more caution is appropriate.
Disclosures
The views expressed are those of the author(s) and do not necessarily reflect the views of Clark Capital Management Group. The opinions referenced are as of the date of publication and are subject to change due to changes in the market or economic conditions and may not necessarily come to pass. There is no guarantee of the future performance of any Clark Capital investments portfolio. Material presented has been derived from sources considered to be reliable, but the accuracy and completeness cannot be guaranteed. Nothing herein should be construed as a solicitation, recommendation or an offer to buy, sell or hold any securities, other investments or to adopt any investment strategy or strategies. For educational use only. This information is not intended to serve as investment advice. This material is not intended to be relied upon as a forecast or research. The investment or strategy discussed may not be suitable for all investors. Investors must make their own decisions based on their specific investment objectives and financial circumstances. Past performance does not guarantee future results. All investing involves risk, including the loss of principal, and there can be no guarantee investment objectives will be met.
Clark Capital Management Group (Clark) is an investment adviser registered with the U.S. Securities and Exchange Commission. Registration does not imply a certain level of skill or training. More information about Clark’s investment advisory services can be found in its Form ADV Part 2 and/or Form CRS, which are available upon request.
Fixed income securities are subject to certain risks including, but not limited to: interest rate (changes in interest rates may cause a decline in market value of an investment), credit, payment, call (some bonds allow the issuer to call a bond for redemption before it matures), and extension (principal repayments may not occur as quickly as anticipated, causing the expected maturity of a security
to increase).
Foreign securities are more volatile, harder to price and less liquid than U.S. securities. They are subject to different accounting and regulatory standards and political and economic risks. These risks are enhanced in emerging market countries.
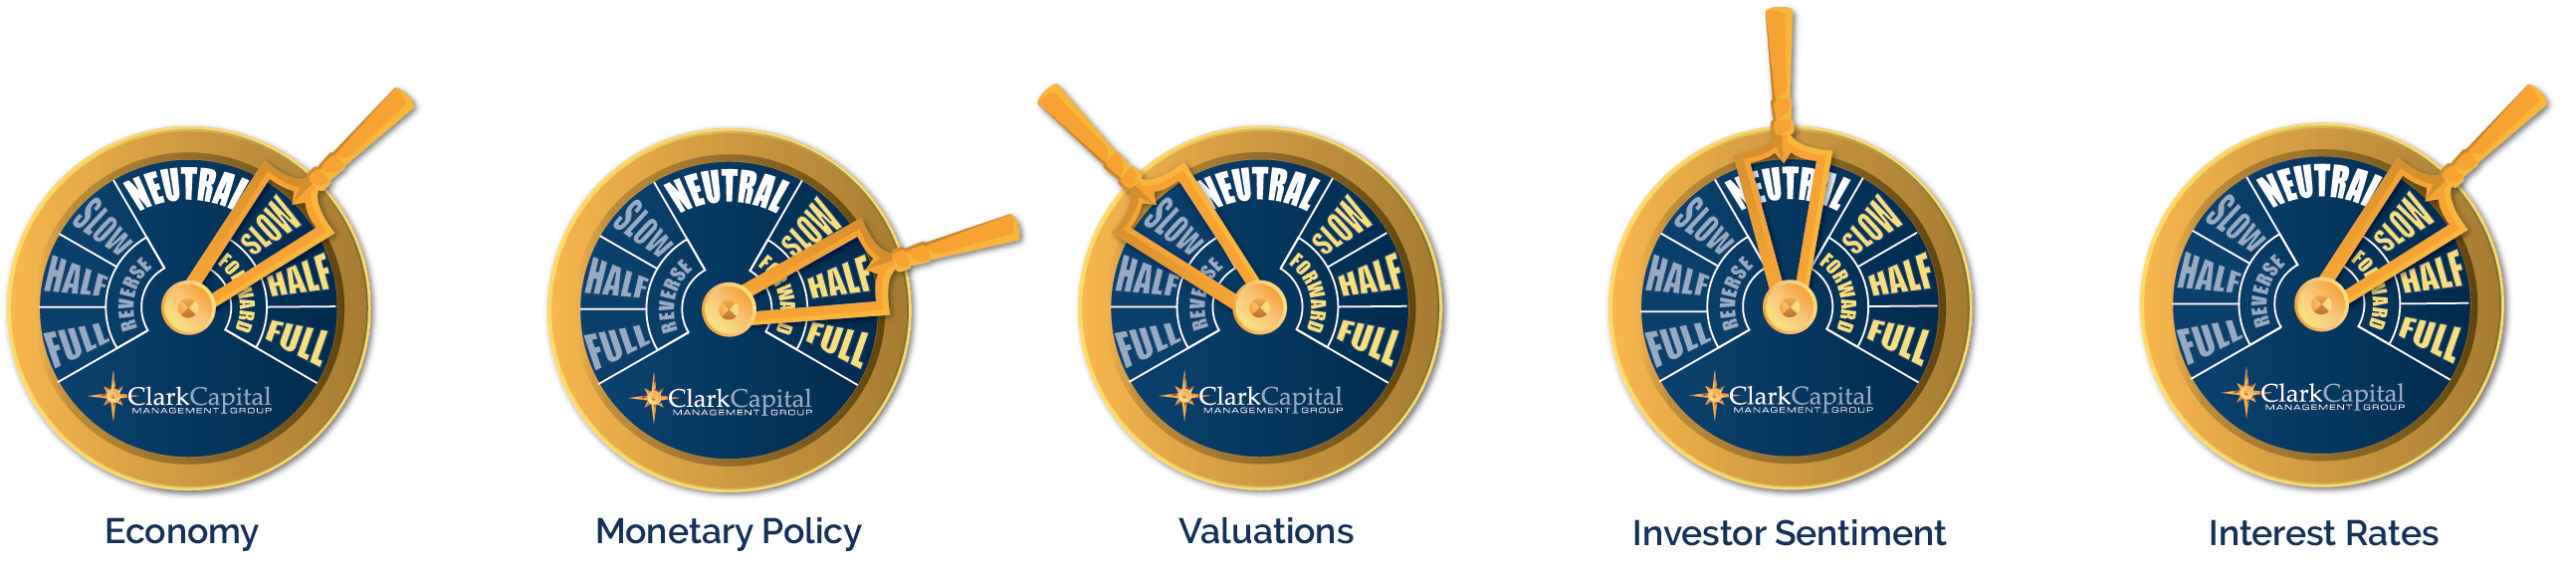
The “Economic Gauges” represent the firm’s expectations for the market, and how changes in the market will affect the strategy, but are only projections which assume certain economic conditions and industry developments and are subject to change without notice. For educational use only.
The S&P 500 measures the performance of the 500 leading companies in leading industries of the U.S. economy, capturing 75% of U.S. equities.
A 10-year Treasury note is a debt obligation issued by the U.S. Treasury Department that has a maturity of 10 years.
Treasury yield is the return on investment, expressed as a percentage, on the U.S. government’s debt obligations. Looked at another way, the Treasury yield is the effective interest rate that the U.S. government pays to borrow money for different lengths of time.
An AA bond rating signifies very high credit quality and a very low risk of default for a bond issued by a government or corporation, indicating a very strong ability to meet financial commitments that is not significantly vulnerable to foreseeable events. While not as exceptional as the highest AAA rating, an AA rating still provides strong reassurance to investors that their investment is secure.
An A rated bond signifies “high credit quality,” indicating a low risk of default, though it is more vulnerable to adverse economic conditions than higher-rated bonds. These ratings are issued by agencies like Fitch, S&P, and Moody’s, reflecting the issuer’s strong capacity to meet financial commitments, but with a greater potential risk than AA or AAA bonds.
A BBB-rated bond is an investment-grade bond that signifies an adequate, though not strong, capacity to meet financial commitments, carrying a low risk of default under normal conditions but a greater susceptibility to adverse economic or business factors compared to higher-rated bonds. In essence, these are considered the lowest tier of “safe” bonds before moving into the more speculative “junk” bond category.
The chartered financial analyst (CFA) charter is a globally-recognized professional designation offered by the CFA Institute, an organization that measures and certifies the competence and integrity of financial analysts.
Non-investment-grade debt securities (high-yield/junk bonds) may be subject to greater market fluctuations, risk of default or loss of income.
The Russell 1000 Value Index tracks companies with lower price-to-book ratios and lower expected and historical growth rates. Russell’s value indexes focus more on dividend yield.
The Russell 2000 Index measures the performance of the 2000 smallest U.S. companies based on total market capitalization in the Russell 3000, which represents approximately 10% of Russell 3000 total market capitalization.
The Bloomberg U.S. Corporate High-Yield Index covers the U.S. dollar-denominated, non-investment grade, fixed-rate, taxable corporate bond market. Securities are classified as high-yield if the middle rating of Moody’s, Fitch, and S&P is Ba1/BB+/BB+ or below. The S&P 500 and the Barclays U.S. Aggregate Bond Index are used as supplemental benchmarks.
The Bloomberg US Treasury Index measures US dollar-denominated, fixed-rate, nominal debt issued by the US Treasury. Treasury bills are excluded by the maturity constraint but are part of a separate Short Treasury Index. STRIPS are excluded from the index because their inclusion would result in double-counting. The US Treasury Index is a component of the US Aggregate, US Universal, Global Aggregate and Global Treasury Indices.
The MSCI All Country World ex USA Total Return (MSCI ACWI) is a market capitalization weighted index designed to provide a broad measure of equity-market performance throughout the world. The MSCI ACWI is maintained by Morgan Stanley Capital International and is comprised of stocks from both developed and emerging markets.
ICE BofA US Corporate C Index, a subset of the ICE BofA US High Yield Master II Index, tracks the performance of US dollar denominated below investment grade rated corporate debt publicly issued in the US domestic market. This subset includes all securities with a given investment grade rating CCC or below.

