
Clark Capital’s Bottom-Up, Fundamental Strategies
February was marked by sharp rotation in the markets. Traditional software—particularly SaaS and enterprise names—underperformed as investors questioned whether AI could automate or erode their core value propositions, which raised long-term viability concerns. Weakness spread to mega-cap tech, while capital continued to rotate into dividend-oriented defensives like utilities and consumer staples, as well as cyclical sectors including energy, materials, and industrials. Spreads have widened, and investor behavior in private credit is being reevaluated amid concerns about underwriting standards and hidden leverage. Against this backdrop, a compelling opportunity may be emerging in the now “relatively cheaper” antifragile large-cap growth cohort—companies characterized by strong balance sheets, high incremental margins, durable cash generation, and the ability to internally fund innovation even in a higher-for longer rate environment.
March appears poised to be driven by geopolitical risk. Elevated tensions in 2026 including U.S. military action in Venezuela and the U.S.-Israel strike on Iran are likely to sustain near-term volatility elevating oil prices in the short term.
Below are strategy updates from February:
Navigator® All Cap Core U.S. Equity
- The portfolio is fully invested with over 70% in large-cap stocks and the remainder in mid-/small-cap companies and cash.
- The portfolio continues to balance portfolio holdings between dominant large-cap growth companies and those anti-fragile large-, small-, and mid-cap companies that continue to see strong business momentum.
- The three largest portfolio sectors at the end of the period were Information Technology, Communication Services, and Financials.
- Our current weighting in the big six free cash flow margin monopolies is 29.2% vs. approximately 26.7% in the Russell 3000. Information Technology remains the largest sector weight in the strategy at 29.2%, which is a slight underweight to the Russell 3000 benchmark.
- To benefit from improving business fundamentals during the month, the three most recent additions to the portfolio were an energy drink company with global distribution, a global food and beverage company, and a footwear and apparel company.
- The three most recent exits were digital agreement and e-signature platform, a global beverage company, and a consumer staples company.
Navigator® High Dividend Equity
- The portfolio is positioned with approximately 97% in developed countries with the remainder in cash. The United States is the largest country weight at 88.9%, followed by United Kingdom at 3.5% and Switzerland at 1.5%.
- Over 90% of the portfolio is in large cap with the remainder in mid cap and cash.
- Financials represent the largest sector weight of 17.5%, below the benchmark weight. The next three largest portfolio weights are Industrials, Information Technology, and Health Care at 14.9%, 10.6% and 10.1%, respectively.
- To benefit from improving business fundamentals during the month, the three most recent additions to the portfolio were a data storage, records management, and information management company, a manufacturer of construction and mining equipment, engines, and industrial machinery, and a global supplier of paints, coatings, and specialty materials.
- The most recent exits were a global consulting and IT services firm, a U.S.-based government services and technology contractor, and a U.S.-based auto and property insurance provider.
Navigator® Large Cap Growth
- The portfolio is fully invested with ~90% of the portfolio in large-cap stocks and the balance in mid-cap stocks and cash.
- Approximately 99% of total holdings are in developed countries with approximately 95% based in the United States.
- Over 70% of the portfolio’s holdings are derived from the 100 largest cash flow producing companies with high and growing cash flows, high cash flow margins, and increasing sales.
- The three largest portfolio sectors at the end of the period were Information Technology, Communication Services, and Industrials.
- Our current weighting in the big six free cash flow margin monopolies is 51.3% vs. approximately 47.2% in the Russell 1000 Growth. Albeit underweight to the benchmark, Information Technology remains the largest sector weight in the strategy at 45.0%.
- To benefit from improving business fundamentals during the month, the three most recent additions to the portfolio were power generation and retail electricity provider, an enterprise software and database provider, and a global insurance brokerage and risk management firm.
- The three most recent exits were a global consulting and IT services firm, a managed care and health services company, and a biopharmaceutical company.
Navigator® International Equity ADR
- The portfolio is positioned with ~17% in emerging and frontier markets with the balance in developed economies and cash.
- Japan, Britain, Spain, and Canada are the strategy’s largest country weights, all ranging between 7% and 16%.
- The three largest portfolio sectors at the end of the period were Financials, Information Technology, and Industrials.
- To benefit from improving business fundamentals during the month, the three most recent additions to the portfolio were a German-based global energy company, a Japanese manufacturer of agricultural equipment and industrial machinery, and Chinese internet search and AI company.
- The three most recent exits were a global consulting and IT services firm, a provider of infection prevention and sterilization products for health care and life sciences, and a global security products and solutions company.
Navigator® Small Cap Core U.S. Equity
- The portfolio remains fully invested with ~79% of the portfolio in small-cap stocks with the balance in mid-cap stocks and cash.
- The portfolio continues to balance portfolio holdings between anti-fragile small- and mid-cap companies characterized by high cash-flow margins and high cash-flow yields, alongside those companies exhibiting accelerating business momentum.
- The three largest portfolio sectors at the end of the period were Industrials, Financials, and Health Care.
- Due to slowing business momentum, the three most recent exits made during the month were a generic and specialty pharmaceutical manufacturer, a semiconductor equipment company, and a software company offering customer engagement and IT service management platforms.
Navigator® SMID Cap Core U.S. Equity
- The portfolio remains fully invested with ~53% of the portfolio in small-cap stocks, ~37% in mid-cap stocks, and the balance in large-cap stocks and cash.
- The portfolio continues to balance portfolio holdings between anti-fragile small- and mid-cap companies characterized by high cash-flow margins and high cash-flow yields, alongside those companies exhibiting accelerating business momentum.
- The three largest portfolio sectors at the end of the period were Financials, Industrials, and Health Care.
- To benefit from improving business fundamentals during the month, the three most recent additions to the portfolio were a clinical research organization, a medical device company, and a footwear and apparel company.
- The three most recent exits were a generic and specialty pharmaceutical manufacturer, a cloud-based file storage and collaboration platform, and a semiconductor equipment company.
Navigator® Taxable Fixed Income
- Within the portfolio, the focus remained consistent with previous months, keeping duration longer than the index and moving maturing and slightly longer bonds into the five-year and longer portion of the yield curve.
- We sold three-year bonds at a 4.03% yield to move out the curve to eight-year bonds, which we bought at a 4.78% yield. Not only did it increase the overall yield but also helped to reduce the overall price in the portfolio as the longer bonds were priced just over 1.75 points lower.
- The portfolio also slightly increased the holding in agency mortgages. Mortgage bonds with a 5% coupon were bought at just over 101.25, which provided a 4.71% yield, roughly 110 basis points higher than an equivalent duration five-year Treasury for the same credit quality.
- This thesis of maximizing yield while also positioning to maximize total return will continue to be the near-term focus.
Navigator® Tax-Free Fixed Income
- As we discussed in the recent past, the muni curve has been inverted in the front end. While we still see advantages in one-year bonds over five-year bonds, we may begin allocating more in the five-year bucket versus the one- to two-year bucket.
- Addressing the curves shape in the belly, we liked 12- to 20-year bonds over five-year bonds from the middle of 2025, as record steepness made for great opportunity. That spread compressed as expected, bottoming in November and December then proceeded to reflate, albeit less so than in summer 2025.
- As investor sentiment has shifted and the hunt for yield has resurfaced with new demand finding a home in that 12- to 20-year curve spot, we will stay invested and see where slopes proceed from here, as they have resumed flattening.
- Ratings were reasonably stable throughout the month. Chicago was downgraded by Fitch and New Orleans was downgraded by S&P. Both situations were somewhat expected and well telegraphed. We will keep a close watch in Chicago’s woes and their effect on Illinois, as Illinois is a large issuer and benchmark member.
- Recent credit woes in some alternative financial vehicles and PE investments could widen out prepaid gas credits, a situation which we will also monitor, as prepaid gas has grown to reasonable index-weighted size.
Clark Capital’s Top-Down, Quantitative Strategies
Performance for the major indices has been mixed year-to-date as private credit worries, decline in business development companies (BDCs), and concern of AI disruptions rippled across various sectors. The S&P 500 index has been rangebound and flat for the year to date, but that masks the market moves under the surface.
As we head into March, the news is now dominated by the conflict in the Middle East. The markets prepositioned ahead of the conflict. Two-year Treasury yields hit a new cycle low, and the 10-Year Treasury yield broke below 4% at the end of February. Meanwhile, the broad stock market was relatively firm. For example, the median stock in the S&P 500 was up 4% for the month of February and up 7.8% so far in 2026. The advance-decline line for the S&P500 also closed at its highest level in history.
Credit markets remained firm despite worries over select private credit issues. High yield and investment grade corporate debt have so far been immune to the troubles, with the Bloomberg High Yield and Intermediate Corporate Investment Grade indices both hitting all-time highs during the month.
As such, our tactical strategies remain fully invested in their respective risk-on asset classes. In our Style Opportunity portfolio, the strategy is positioned with core index exposure and a slight tilt towards value and small caps.
Below are strategy updates from February:
Navigator® Alternative
- MultiStrategy and managed futures were top contributors in the mutual fund core of the portfolio, while options-based and long/short equity were detractors.
- The portfolio generally underweighted equities, but maintained modest positions in natural resources, industrial real estate, and a farmland REIT.
- We added a software ETF after the dramatic selloff in space, along with an agriculture ETN.
Navigator® Fixed Income Total Return (MultiStrategy Fixed Income)
- Private credit, bank loans, and BDCs have come under considerable stress, as bank loans in Technology and Health Care required markdowns.
- Even though bank stocks and bank loans have taken on considerable pain, it has been surprising that high yield credits have been mostly isolated from the worst damage.
- Our credit-based models have experienced some weakness, but so far, our position in high yield appears stable. We would require notable further weakness before becoming defensive.
Navigator® Global Risk Management
- Investment grade and high yield credit have held up well compared to the problems in the BDC and private credit space, and while our models have weakened slightly, they are still positive on risk assets.
- We expect to continue favoring risk-on equities, and international equities in particular have become leaders, driven by emerging markets.
Navigator® Global Tactical
- Our credit-based models have weakened slightly, but overall, they continue to indicate that the fundamental and risk environment for equities is stable and attractive.
- The weakness that we have seen in bank loans and private credit has not spread to the high yield market.
- Unless that changes, we will continue to favor domestic and international equities as risk-on vehicles.
Navigator® U.S. Sector Opportunity
- Though Technology has given up its market leadership, the picture is not that simple. Semiconductors, robotics, and AI have found places in the portfolio, but we remain underweight in Tech overall.
- Health Care, Industrials, Energy, and Materials maintain prominent weights, and more defensive Staples and Utilities have risen in our rankings and are recent purchases.
- We believe Consumer Discretionary is to be avoided.
Navigator® U.S. Style Opportunity (MultiStrategy Equity)
- The portfolio favors large-cap value, a cash flow yield ETF, and mid and small caps — or in other words, many equity factor approaches that are not large-cap growth, the prior leader for several years.
- While some areas of large-cap growth have sold off notably, we have yet to see signs of a turnaround, despite generally strong earnings within Tech.
- Defensive ETFs have begun to rise in our rankings and could become holdings if markets weaken further.
Navigator® U.S. Strategic Beta
- Large cap and mid-cap value were the top contributors in February, with small-cap value also a positive factor.
- Large cap and mid-cap growth proved to be detractors, as Technology, particularly software, lost the favor of investors.
- Overall, the portfolio continues a broad risk-facing stance with a modest growth bias.
Disclosures
The views expressed are those of the author(s) and do not necessarily reflect the views of Clark Capital Management Group. The opinions referenced are as of the date of publication and are subject to change due to changes in the market or economic conditions and may not necessarily come to pass. There is no guarantee of the future performance of any Clark Capital investments portfolio. Material presented has been derived from sources considered to be reliable, but the accuracy and completeness cannot be guaranteed. Nothing herein should be construed as a solicitation, recommendation or an offer to buy, sell or hold any securities, other investments or to adopt any investment strategy or strategies. For educational use only. This information is not intended to serve as investment advice. This material is not intended to be relied upon as a forecast or research. The investment or strategy discussed may not be suitable for all investors. Investors must make their own decisions based on their specific investment objectives and financial circumstances. Past performance does not guarantee future results. All investing involves risk, including the loss of principal, and there can be no guarantee investment objectives will be met.
Clark Capital Management Group (Clark) is an investment adviser registered with the U.S. Securities and Exchange Commission. Registration does not imply a certain level of skill or training. More information about Clark’s investment advisory services can be found in its Form ADV Part 2 and/or Form CRS, which are available upon request.
Fixed income securities are subject to certain risks including, but not limited to: interest rate (changes in interest rates may cause a decline in market value of an investment), credit, payment, call (some bonds allow the issuer to call a bond for redemption before it matures), and extension (principal repayments may not occur as quickly as anticipated, causing the expected maturity of a security
to increase).
Foreign securities are more volatile, harder to price and less liquid than U.S. securities. They are subject to different accounting and regulatory standards and political and economic risks. These risks are enhanced in emerging market countries.
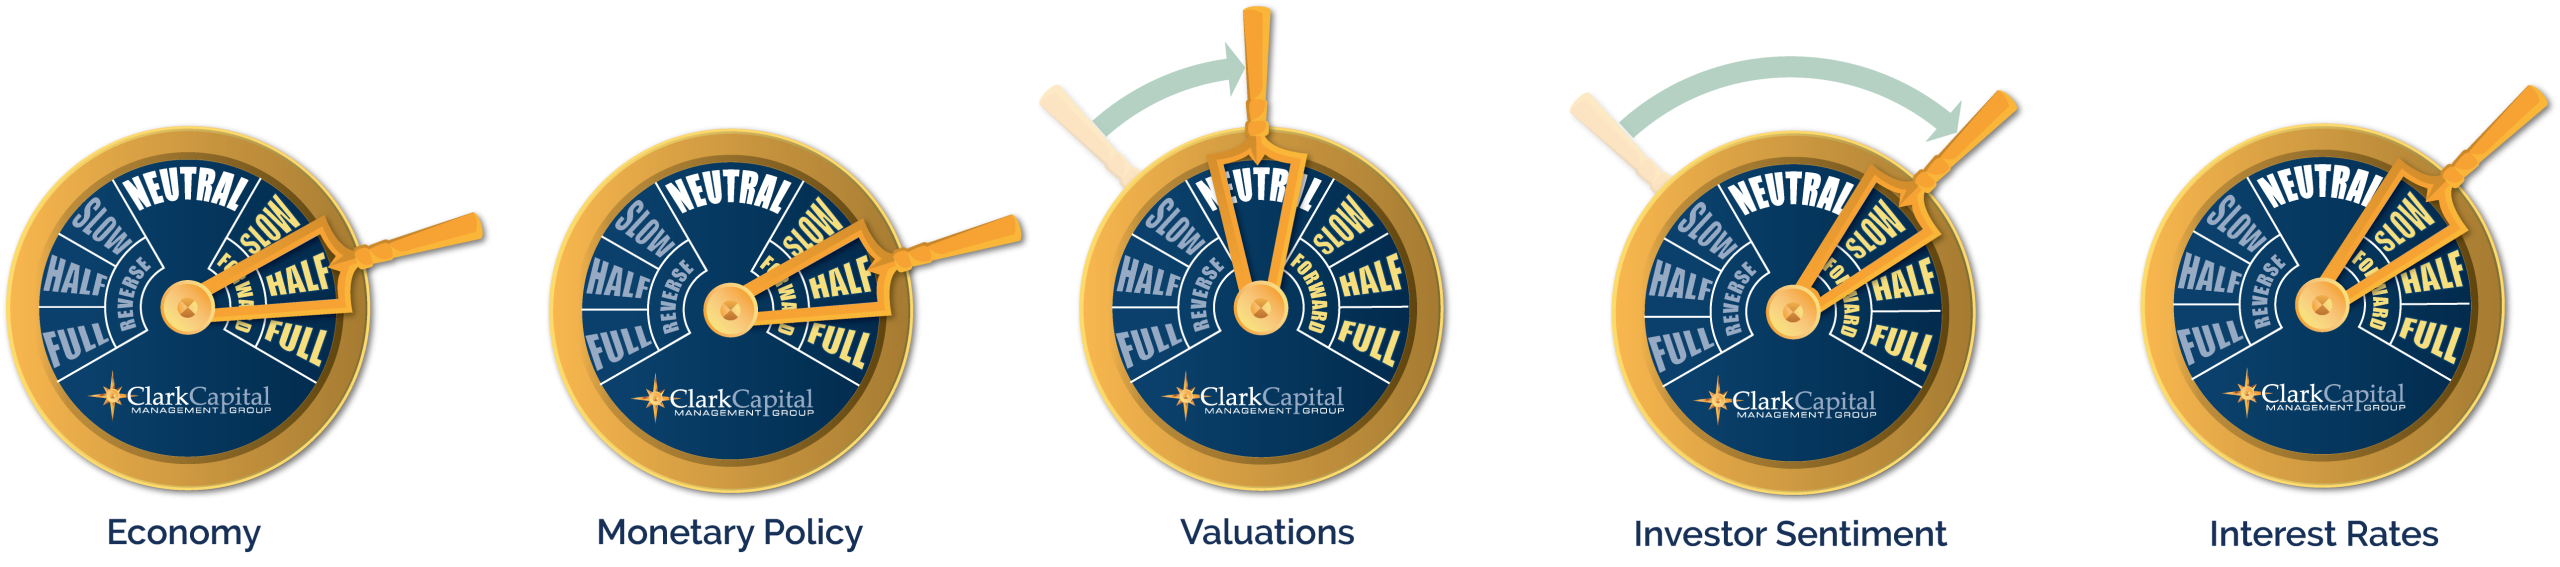
The “Economic Gauges” represent the firm’s expectations for the market, and how changes in the market will affect the strategy, but are only projections which assume certain economic conditions and industry developments and are subject to change without notice. For educational use only.
The S&P 500 measures the performance of the 500 leading companies in leading industries of the U.S. economy, capturing 75% of U.S. equities.
A 10-year Treasury note is a debt obligation issued by the U.S. Treasury Department that has a maturity of 10 years.
Treasury yield is the return on investment, expressed as a percentage, on the U.S. government’s debt obligations. Looked at another way, the Treasury yield is the effective interest rate that the U.S. government pays to borrow money for different lengths of time.
An AA bond rating signifies very high credit quality and a very low risk of default for a bond issued by a government or corporation, indicating a very strong ability to meet financial commitments that is not significantly vulnerable to foreseeable events. While not as exceptional as the highest AAA rating, an AA rating still provides strong reassurance to investors that their investment is secure.
An A rated bond signifies “high credit quality,” indicating a low risk of default, though it is more vulnerable to adverse economic conditions than higher-rated bonds. These ratings are issued by agencies like Fitch, S&P, and Moody’s, reflecting the issuer’s strong capacity to meet financial commitments, but with a greater potential risk than AA or AAA bonds.
A BBB-rated bond is an investment-grade bond that signifies an adequate, though not strong, capacity to meet financial commitments, carrying a low risk of default under normal conditions but a greater susceptibility to adverse economic or business factors compared to higher-rated bonds. In essence, these are considered the lowest tier of “safe” bonds before moving into the more speculative “junk” bond category.
The chartered financial analyst (CFA) charter is a globally-recognized professional designation offered by the CFA Institute, an organization that measures and certifies the competence and integrity of financial analysts.
Non-investment-grade debt securities (high-yield/junk bonds) may be subject to greater market fluctuations, risk of default or loss of income.
The Russell 1000 Value Index tracks companies with lower price-to-book ratios and lower expected and historical growth rates. Russell’s value indexes focus more on dividend yield.
The Russell 2000 Index measures the performance of the 2000 smallest U.S. companies based on total market capitalization in the Russell 3000, which represents approximately 10% of Russell 3000 total market capitalization.
The Bloomberg U.S. Corporate High-Yield Index covers the U.S. dollar-denominated, non-investment grade, fixed-rate, taxable corporate bond market. Securities are classified as high-yield if the middle rating of Moody’s, Fitch, and S&P is Ba1/BB+/BB+ or below. The S&P 500 and the Barclays U.S. Aggregate Bond Index are used as supplemental benchmarks.
The Bloomberg US Treasury Index measures US dollar-denominated, fixed-rate, nominal debt issued by the US Treasury. Treasury bills are excluded by the maturity constraint but are part of a separate Short Treasury Index. STRIPS are excluded from the index because their inclusion would result in double-counting. The US Treasury Index is a component of the US Aggregate, US Universal, Global Aggregate and Global Treasury Indices.
The MSCI All Country World ex USA Total Return (MSCI ACWI) is a market capitalization weighted index designed to provide a broad measure of equity-market performance throughout the world. The MSCI ACWI is maintained by Morgan Stanley Capital International and is comprised of stocks from both developed and emerging markets.
ICE BofA US Corporate C Index, a subset of the ICE BofA US High Yield Master II Index, tracks the performance of US dollar denominated below investment grade rated corporate debt publicly issued in the US domestic market. This subset includes all securities with a given investment grade rating CCC or below.

