
Clark Capital’s Bottom-Up, Fundamental Strategies
U.S. equities gained in January, supported by positive market breadth. The S&P 500 Equal Weight outperformed the cap‑weighted S&P 500 Index by over 70 basis points, while small-caps recovered from their December decline. Treasuries were firmer with the yield curve steepening amidst the Trump administration deregulation dynamics.
Chinese AI maverick DeepSeek suppressed gains in large-cap growth, AI infrastructure, and utility stocks at month’s end as their model’s gains from cheaper semiconductors raised questions about the potential return on expensive CapEx investment. The next 12-month earnings expectations continue to breach new highs for the S&P 500. If 2025 earnings growth fails to meet expectations, a market defensive rotation could benefit dividend stocks. Treasury yields were steady during the month as 2-year and 10-year Treasury yields stayed near 4.2% and 4.5%, respectively.
Below are strategy updates from January:
All Cap Core U.S. Equity
- The portfolio is fully invested with approximately 79% in large-cap stocks and the remainder in mid-/small-cap companies and cash.
- The portfolio continues to balance holdings between dominant large-cap growth companies and those anti-fragile large-, small – and mid-cap companies that continue to see strong business momentum.
- To benefit from improving business fundamentals, the two recent additions to the portfolio were a technology company and a natural gas distributor. The two recent exits were a beverage company and a clean energy company.
High Dividend Equity
- The portfolio has approximately 92% in large-cap, 6% is mid-cap, and the remainder is in cash.
- Financials represent the largest sector exposure at 25.7% (above the benchmark weight), followed by Industrials, Healthcare, and Information Technology at 14.5%, 13.3%, and 9.4%, respectively.
- Our position in Industrials and Consumer Staples contributed to relative performance versus Information Technology and Healthcare which underperformed.
- To benefit from improving business fundamentals, three additions to the portfolio including a global power solutions company, a global professional services company, and a real estate investment trust company.
- Three recent portfolio exits were a transportation and real estate company, a real estate investment trust company, and an automobile manufacturing company.
International Equity ADR
- The portfolio has approximately 16% in emerging markets with the balance in developed economies and cash. Britain, Canada, China, Ireland, Japan, and Switzerland are the strategy’s largest country weights, ranging between 7% and 19%.
- We believe the portfolio will continue to find undervalued, high-quality companies in developed and emerging markets. Its exposure to China is now approximately 7.1%, slightly below its weighting in the All-Country World ex-US benchmark.
- Consumer Discretionary, Financials, Industrials, and Information Technology are our largest sector weights.
- To benefit from improving business fundamentals, we made the three additions to the portfolio including a marine electronics manufacturing company, a Brazilian forestry company, and a global professional services firm. Two recent exits were a healthcare intelligence and clinical research company and a British multinational aerospace, defense, and information security company.
Taxable Fixed Income
- The portfolio’s focused on extending the overall duration.
- We made trades to increase the portfolio’s duration to realize price appreciation and increase the overall yield. This thesis of maximizing yield while positioning to maximize total return will be the near-term focus for the next few months.
Tax-Free Fixed Income
- Year-to-date issuance is $34 billion, up 19% year-over-year (BAML data). With a strong start like this we could see overall issuance eclipse forecasts of $500 billion to $520 billion.
- Intermediate maturities showed impressive resilience when considered on a cross-market basis: 5-year Muni/Treasury ratios fell from 66% to 65%, and 10-year ratios moved from 68% to 67% (Bloomberg data).
- Strong market performance in 2025 has been supported by steady inflows, as measured by Lipper. Year-to-date inflows are tracking at +$3.4 billion, with a bias toward longer securities, and high yield and investment grade bonds are about equal.
Clark Capital’s Top-Down, Quantitative Strategies
The economy ended 2024 on a high note, increasing 2.3% in the fourth quarter. For the 2024 year, the economy grew at a 2.5% pace. Starting in 2025, the economic momentum continues and, as such, the Federal Reserve held overnight rates steady at its January 29 meeting after cutting rates during the prior three sessions. After faltering in December, the markets posted solid returns in January — the S&P 500 gained 2.78%, the Russell 2000 gained 2.62%, the S&P 500 Equal Weight gained 3.50%, and the MSCI ACWI ex-US gained 4.03%. Fixed income indices also posted gains — the High Yield Index was up 1.37%, and the 7-10 Year Treasury Index was up 0.67%.
Historically, February is the second worst month of the year for S&P 500 returns; September is the first. While DeepSeek and tariff news have caused volatility, the markets are muting the noise and focusing on solid fundamentals. In our 2025 outlook, we stated that we believe it will be a good year for stocks, but not a straight line higher, and with increased volatility. So far, it looks like we are getting that.
Below are strategy updates from January:
Alternative
- Event-driven, long/short equity, and multi-strategy lead the portfolio’s core, while managed futures are lagging.
- The portfolio recently added to its gold position and purchased an infrastructure ETF.
- Precious metals and miners, energy and pipelines, and private equity BDCs are more risk-facing holdings, while bank loans, convertibles, and preferreds highlight our fixed income holdings.
Fixed Income Total Return (MultiStrategy Fixed Income)
- Credit spreads are strong and were unaffected by the AI-driven turbulence over the past few weeks. Spreads are hovering near all-time lows, and we do not see any signs of weakness among the most vulnerable credits.
- High yield continued its historic pattern of outperforming when rates moved higher, and our models do not see signs of credit stress.
Global Risk Management
- The portfolio continues to be risk-facing, as our models do not detect signs of underlying stresses within corporate fundamentals, leading us to believe that we will continue to overweight to equities for the foreseeable future.
- Utilizing Treasuries and cash as defensive vehicles holds minimal weight, however, as stocks rise and become pricier, the relative value case for bonds grows.
Global Tactical
- Our credit-based model continues to support owning risk and equities, with little indication that this will soon change.
- Credit fundamentals remain strong and stocks have followed through, delivering gains in 2025.
- International equities have slightly outperformed but may be influenced by the news of pending substantial tariffs.
Sector Opportunity
- The portfolio is overweight to Technology (internet, cloud, cybersecurity).
- Not owning Semiconductors allowed us to avoid the worst of January’s AI-driven pain.
- Financials are the other large sector overweight, and there, we favor broker-dealers and market-weight banks.
- We are avoiding defensive-oriented Consumer Staples, HealthCare, Utilities, and the always volatile Energy.
Style Opportunity (MultiStrategy Equity)
- While the portfolio favors large-caps and growth with two large growth ETFs accounting for 50%, under the surface, the strength in Financials is beginning to be reflected.
- The two momentum factor ETFs in the portfolio have Financials and not Technology as their top overweight, and even the mid-cap momentum ETF we own favors Financials as the largest sector and overweight. Thus, the portfolio favors growth, financials, and cyclicality generally.
U.S. Strategic Beta
- In early January, the portfolio slightly increased its beta selling a low volatility equity to modestly add to large growth stocks, as well as mid – and small-caps, which have more compelling valuations and are expected to have higher earnings growth in 2025.
The views expressed are those of the author(s) and do not necessarily reflect the views of Clark Capital Management Group. The opinions referenced are as of the date of publication and are subject to change due to changes in the market or economic conditions and may not necessarily come to pass. There is no guarantee of the future performance of any Clark Capital investments portfolio. Material presented has been derived from sources considered to be reliable, but the accuracy and completeness cannot be guaranteed. Nothing herein should be construed as a solicitation, recommendation or an offer to buy, sell or hold any securities, other investments or to adopt any investment strategy or strategies. For educational use only. This information is not intended to serve as investment advice. This material is not intended to be relied upon as a forecast or research. The investment or strategy discussed may not be suitable for all investors. Investors must make their own decisions based on their specific investment objectives and financial circumstances. Past performance does not guarantee future results.
Fixed income securities are subject to certain risks including, but not limited to: interest rate (changes in interest rates may cause a decline in market value of an investment), credit, payment, call (some bonds allow the issuer to call a bond for redemption before it matures), and extension (principal repayments may not occur as quickly as anticipated, causing the expected maturity of a security to increase).
Foreign securities are more volatile, harder to price and less liquid than U.S. securities. They are subject to different accounting and regulatory standards and political and economic risks. These risks are enhanced in emerging market countries.
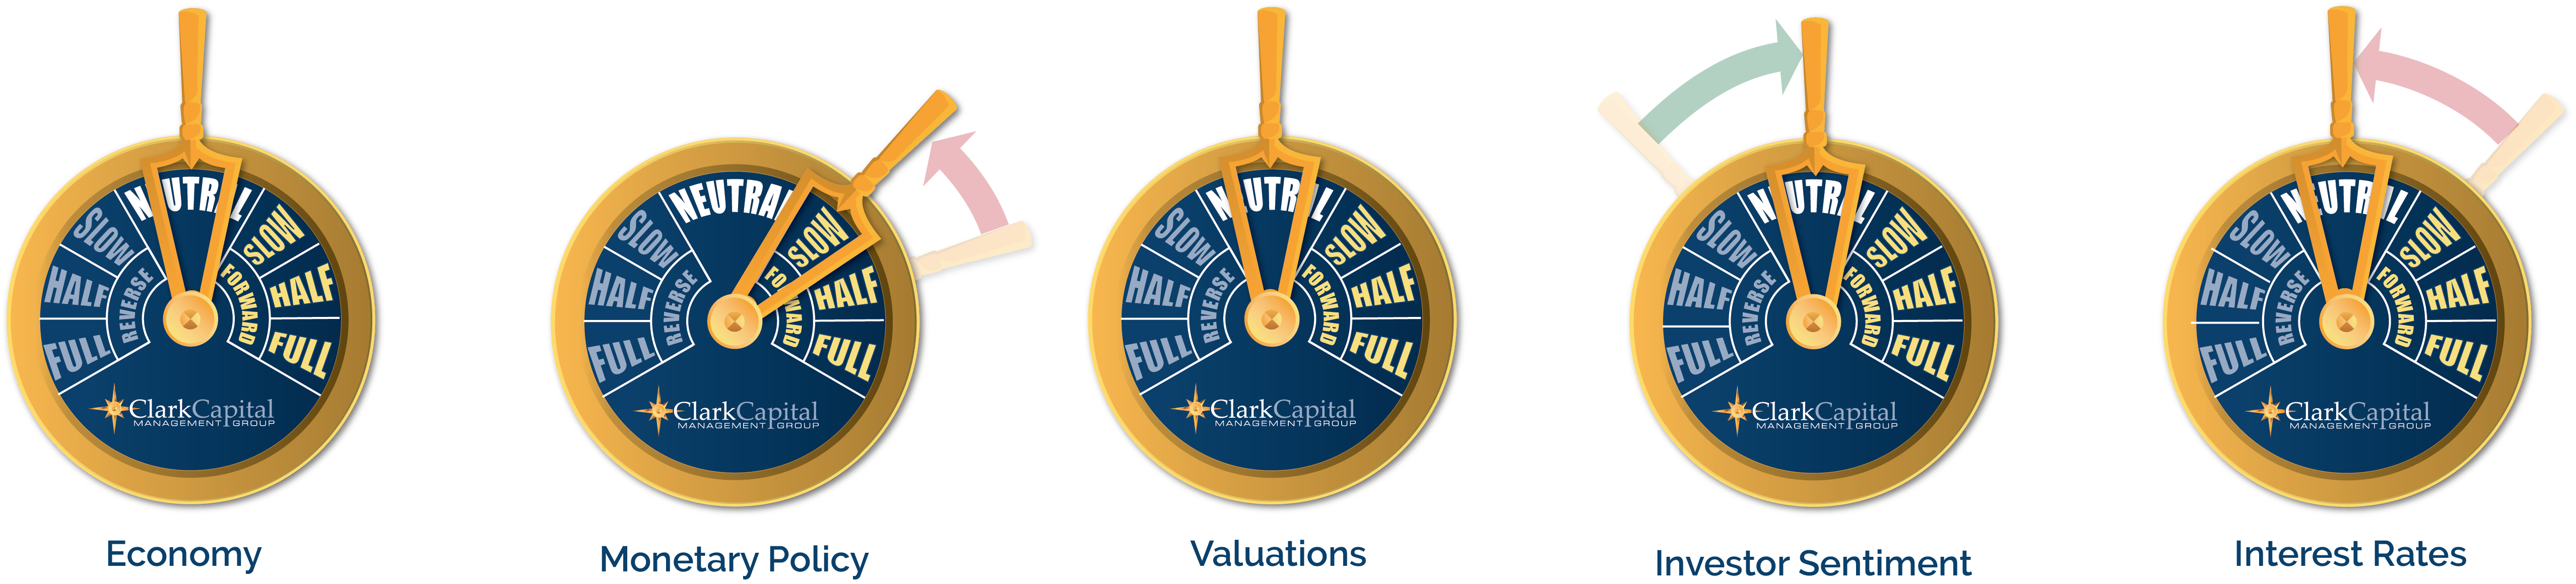
The “Economic Gauges” represent the firm’s expectations for the market, and how changes in the market will affect the strategy, but are only projections which assume certain economic conditions and industry developments and are subject to change without notice. For educational use only.
The S&P 500 measures the performance of the 500 leading companies in leading industries of the U.S. economy, capturing 75% of U.S. equities.
A 10-year Treasury note is a debt obligation issued by the U.S. Treasury Department that has a maturity of 10 years.
The CBOE Volatility Index (VIX) is a real-time index that represents the market’s expectations for the relative strength of near-term price changes of the S&P 500 Index (SPX).
The Bloomberg 5-Year Municipal Bond Index provides a broad-based performance measure of the U.S. municipal bond market, consisting of securities with 4-6 year maturities.
The Bloomberg Barclays U.S. Corporate High-Yield Index covers the U.S. dollar-denominated, non-investment grade, fixed-rate, taxable corporate bond market. Securitiesare classified as high-yield if the middle rating of Moody’s, Fitch, and S&P is Ba1/BB+/BB+ or below.
Treasury yield is the return on investment, expressed as a percentage, on the U.S. government’s debt obligations. Looked at another way, the Treasury yield is the effective interest rate that the U.S. government pays to borrow money for different lengths of time.
The MSCI All Country World Index (ACWI) ex US is a market capitalization weighted index designed to provide a broad measure of equity-market performance throughout the world. The MSCI ACWI is maintained by Morgan Stanley Capital International (MSCI) and is comprised of stocks from 22 of 23 developed countries and 24 emerging markets.
AAA bonds are bonds that have the highest credit rating possible, indicating that they are considered a safe investment with the lowest risk of default.
The chartered financial analyst (CFA) charter is a globally-recognized professional designation offered by the CFA Institute, an organization that measures and certifies the competence and integrity of financial analysts.
Non-investment-grade debt securities (high-yield/junk bonds) may be subject to greater market fluctuations, risk of default or loss of income and principal than higher-rated securities.
The securities of mid-cap companies may be subject to more abrupt or erratic market movements and may have lower trading volumes.
This document may contain certain information that constitutes forward-looking statements which can be identified by the use of forward-looking terminology such as “may,” “expect,” “will,” “hope,” “forecast,” “intend,” “target,” “believe,” and/or comparable terminology (or the negative thereof). Forward looking statements cannot be guaranteed. No assurance, representation, or warranty is made by any person that any of Clark Capital’s assumptions, expectations, objectives, and/or goals will be achieved. Nothing contained in this document may be relied upon as a guarantee, promise, assurance, or representation as to the future.
Clark Capital Management Group, Inc. is an investment adviser registered with the U.S. Securities and Exchange Commission. Registration does not imply a certain level of skill or training. More information about Clark Capital’s advisory services and fees can be found in its Form ADV which is available upon request. CCM-1188

