
Clark Capital’s Bottom-Up, Fundamental Strategies
The market gained in January, which is historically a bullish signal for forward returns. Signs of a more durable bull market emerged, highlighted by small-cap leadership, cyclical strength, and a value orientation. Countering these signals is the historic trend for weaker market returns in midterm election years. The significant rotation across equities and commodities was a defining characteristic of January 2026. Gold futures hit an intraday high of $5,358 on January 29 before closing at $4,757, down 11.4%, a day later. Silver tumbled 31.4% on Friday. Even after the whipsaw, gold prices gained 13% in the month.
President Trump’s nomination of Kevin Warsh as Fed Chair was viewed as a confidence-restoring step after the parabolic move in precious metals and the rapid weakening in the U.S. dollar. The administration has been clear about preferring a weaker dollar to support competitiveness and to narrow trade imbalances. Warsh’s reputation as a balance-sheet hawk paired with support for supply-side, pro-growth fiscal policies adds credibility, helping to cool gold and offer modest support to the dollar as broader policy objectives play out.
The equity portfolios continue to balance holdings between dominant, anti-fragile businesses with business momentum. In addition, the High Dividend Equity strategy continued to focus on what we believe are high quality companies that pay and growth dividends.
Credit markets have remained very stable with spreads for both high yield and investment grade bonds very tight. Within the Taxable Bond portfolio, the focus remained consistent with previous months, keeping duration slightly longer than the index and moving maturing and slightly longer bonds into the 5-year and longer portion of the yield curve.
Below are strategy updates from January:
Navigator® All Cap Core U.S. Equity
- The portfolio is fully invested with over 65% in large-cap stocks and the remainder in mid-/small-cap companies and cash.
- The portfolio continues to balance holdings between dominant large cap growth companies and anti fragile large-, small-, and mid cap companies exhibiting what we consider to be strong business momentum.
- The three largest portfolio sectors at the end of the period were Information Technology, Financials, and Communication Services.
- Our current weighting in the big six free cash flow margin monopolies is 28.9% vs. approximately 28.5% in the Russell 3000. Information Technology remains the largest sector weight at 29.6%, a slight underweight to the benchmark.
- During the month, the three most recent additions—made to benefit from improving business fundamentals—were a leading U.S. renewable energy and utility company, a leading provider of services and equipment to oil and gas producers worldwide, and an energy infrastructure company providing midstream services.
- The three most recent exits were a digital payments platform enabling online and mobile transactions and two U.S. energy infrastructure companies.
Navigator® High Dividend Equity
- The portfolio is positioned with approximately 98% in developed countries with the remainder in cash. The United States is the largest country weight at 90.9%, followed by United Kingdom at 3.3% and Ireland at 2.5%.
- Over 87% of the portfolio is large cap with the remainder in mid-cap companies and cash.
- Financials represent the largest weighting of 20.6%, slightly below the benchmark weight. The next three largest portfolio weights are Industrials, Information Technology, and Health Care at 15.9%, 12.7%, and 10.4%, respectively.
- To benefit from improving business fundamentals during the month, the most recent additions to the portfolio were a leading provider of services and equipment to oil and gas producers worldwide, a designer of microcontrollers and analog semiconductor products, a major global miner of copper and gold, and an online marketplace connecting buyers and sellers globally.
- The most recent exits were a global medical device, diagnostics, and nutrition company and a leading U.S. telecommunications company.
Navigator® Large Cap Growth
- The portfolio is fully invested with over 99% of the portfolio in large-cap stocks with the balance in mid-cap stocks and cash.
- Approximately 99% of total holdings are in developed countries, with roughly 91% based in the United States.
- Over 70% of portfolio holdings are derived from the 100 largest cash flow producing companies with high and growing cash flows, strong margins, and increasing sales.
- The three largest portfolio sectors at the end of the period were Information Technology, Communication Services, and Consumer Discretionary.
- Our weighting in the big six free cash flow margin monopolies is 52.4% vs. approximately 48.7% in the Russell 1000 Growth. Information Technology, though an underweight, remains the largest sector at 46.1%.
- To benefit from improving business fundamentals during the month, we added a software platform supporting mobile app marketing and monetization
Navigator® International Equity ADR
- The portfolio is positioned with ~15% in emerging/frontier markets with the balance in developed economies and cash.
- Britain, Japan, Spain, Canada, and Ireland are the strategy’s largest country weights, each ranging between 7% and 18%.
- The three largest portfolio sectors at the end of the period were Financials, Information Technology, and Industrials.
- To benefit from improving business fundamentals during the month, the most recent addition to the portfolio was a global leader in cosmetics and personal care products.
- We exited an international food company specializing in dairy, nutrition, and bottled water due to declining business momentum.
Navigator® Taxable Fixed Income
- Within the portfolio, the focus remained consistent with previous months, keeping duration slightly longer than the index and moving maturing and slightly longer bonds into the 5-year and longer portion of the yield curve.
- Within the 5- to 10-year portion of the yield curve, shorter bonds were sold to move longer and increase the overall yield of the portfolio.
- Inside of the 5-year portion, short bonds yielding less than 4% were sold and moved into longer bank bonds.
- This thesis of maximizing yield while also positioning to maximize total return will continue to be the near-term focus
Navigator® Tax-Free Fixed Income
- The muni market traditionally gears up slowly after the holiday break in terms of new issues, so we do expect the supply number to move higher as time ticks forward.
- While supply can be a headwind, one lesson learned in February 2025 is don’t fight the flows and the demand those flows create. We will monitor the demand side closely.
- The incredible inflows in shorter term ETFs were a main driver. While this move was a drag on performance on the longer leg of our barbell, the attractive ratios and rolldown opportunities, as well as the outright higher yields remain attractive in the 12- to 15-year spots.
- Given the newfound positive slope in the front end, we will be looking to add exposure in the 7-year maturity should steepening continue to exceed traditional averages.
Clark Capital’s Top-Down, Quantitative Strategies
A lot happened in January. First, the economy remains strong and corporate earnings growth has supported elevated stock prices so far this earnings cycle. For the month, S&P 500 Index options were up 1.44%, but that doesn’t tell the story. There was a massive rotation into everything except technology and a broadening of participation. Large growth lost 1.51%, large value gained 4.54%, small caps were up 5.39%, the Mag 7 was up only 0.29%, and international stocks gained 5.89%. Most of the major indices hit new all-time highs during the month.
Geopolitics were front and center, highlighted by actions in Venezuela, a spike in Japanese bond yields, a sharp decline in the U.S. dollar, the nomination of Kevin Warsh as the next Fed Chair, and a late-month reversal in precious metals, with silver down 27% and gold lower by about 10%. However, for the month silver and gold were still up 19% and 13%, respectively.
Below are strategy updates from January:
Navigator® Alternative
- Managed futures funds led the portfolio’s core, while multi-strategy funds were laggards.
- The portfolio sold out of silver and silver miners during the last week of January, maintained reduced positions in gold and gold miners, and has exited crypto.
- We have been slightly reducing equity positions and hold a healthy cash buffer.
Navigator® Fixed Income Total Return (MultiStrategy Fixed Income)
- Our models continued to be positive and established new highs in January.
- High yield spreads continue to be very tight at 2.65%, their tightest levels since 2007, and the asset class is suffering zero effects from gradually rising interest rates.
- Credit conditions remain favorable for risk assets.
Navigator® Global Risk Management
- Credit markets guide us in assessing equity market risk, and credit balance sheet strength has signaled that a friendly environment should continue for equities.
- A weaker dollar has helped international markets to participate and even display leadership.
- Improved small-cap performance, both domestically and internationally, is yet another sign of strength. We expect to continue favoring equities over the intermediate term.
Navigator® Global Tactical
- Economic data in 2026 indicates a resurgence in growth, and our credit-based models followed, making new highs and demonstrating a strong fundamental backdrop for risk-facing equities.
- Markets have experienced a resurgence in breadth and value leadership, helping markets continue higher despite a pause in technology leadership.
Navigator® U.S. Sector Opportunity
- The portfolio favors metals and mining, natural resources, banks and financials, health care, and semiconductors.
- Technology, excluding semiconductors, and consumer discretionary are lowest ranked and least favored.
Navigator® U.S. Style Opportunity (MultiStrategy Equity)
- The portfolio has taken a modest value bias, favoring the Russell Top 200 Value, along with mid- and small-cap positions that reflect broader market participation and a move away from mega-cap tech leadership.
- We continue to own a smaller position in an S&P 500 growth ETF, which is holding up better than mega-cap growth overall.
Navigator® U.S. Strategic Beta
- The portfolio maintains an aggressive stance, along with a modest pro-growth bias.
- As we look forward into 2026, we anticipate that we will turn more defensive as an expected midterm correction would begin.
- Markets and the economy have displayed strength so far in 2026, but extremely optimistic sentiment, earnings disappointments, and the installment of a new Fed Chair could prove catalysts that turn us defensive.
Disclosures
The views expressed are those of the author(s) and do not necessarily reflect the views of Clark Capital Management Group. The opinions referenced are as of the date of publication and are subject to change due to changes in the market or economic conditions and may not necessarily come to pass. There is no guarantee of the future performance of any Clark Capital investments portfolio. Material presented has been derived from sources considered to be reliable, but the accuracy and completeness cannot be guaranteed. Nothing herein should be construed as a solicitation, recommendation or an offer to buy, sell or hold any securities, other investments or to adopt any investment strategy or strategies. For educational use only. This information is not intended to serve as investment advice. This material is not intended to be relied upon as a forecast or research. The investment or strategy discussed may not be suitable for all investors. Investors must make their own decisions based on their specific investment objectives and financial circumstances. Past performance does not guarantee future results. All investing involves risk, including the loss of principal, and there can be no guarantee investment objectives will be met.
Clark Capital Management Group (Clark) is an investment adviser registered with the U.S. Securities and Exchange Commission. Registration does not imply a certain level of skill or training. More information about Clark’s investment advisory services can be found in its Form ADV Part 2 and/or Form CRS, which are available upon request.
Fixed income securities are subject to certain risks including, but not limited to: interest rate (changes in interest rates may cause a decline in market value of an investment), credit, payment, call (some bonds allow the issuer to call a bond for redemption before it matures), and extension (principal repayments may not occur as quickly as anticipated, causing the expected maturity of a security
to increase).
Foreign securities are more volatile, harder to price and less liquid than U.S. securities. They are subject to different accounting and regulatory standards and political and economic risks. These risks are enhanced in emerging market countries.
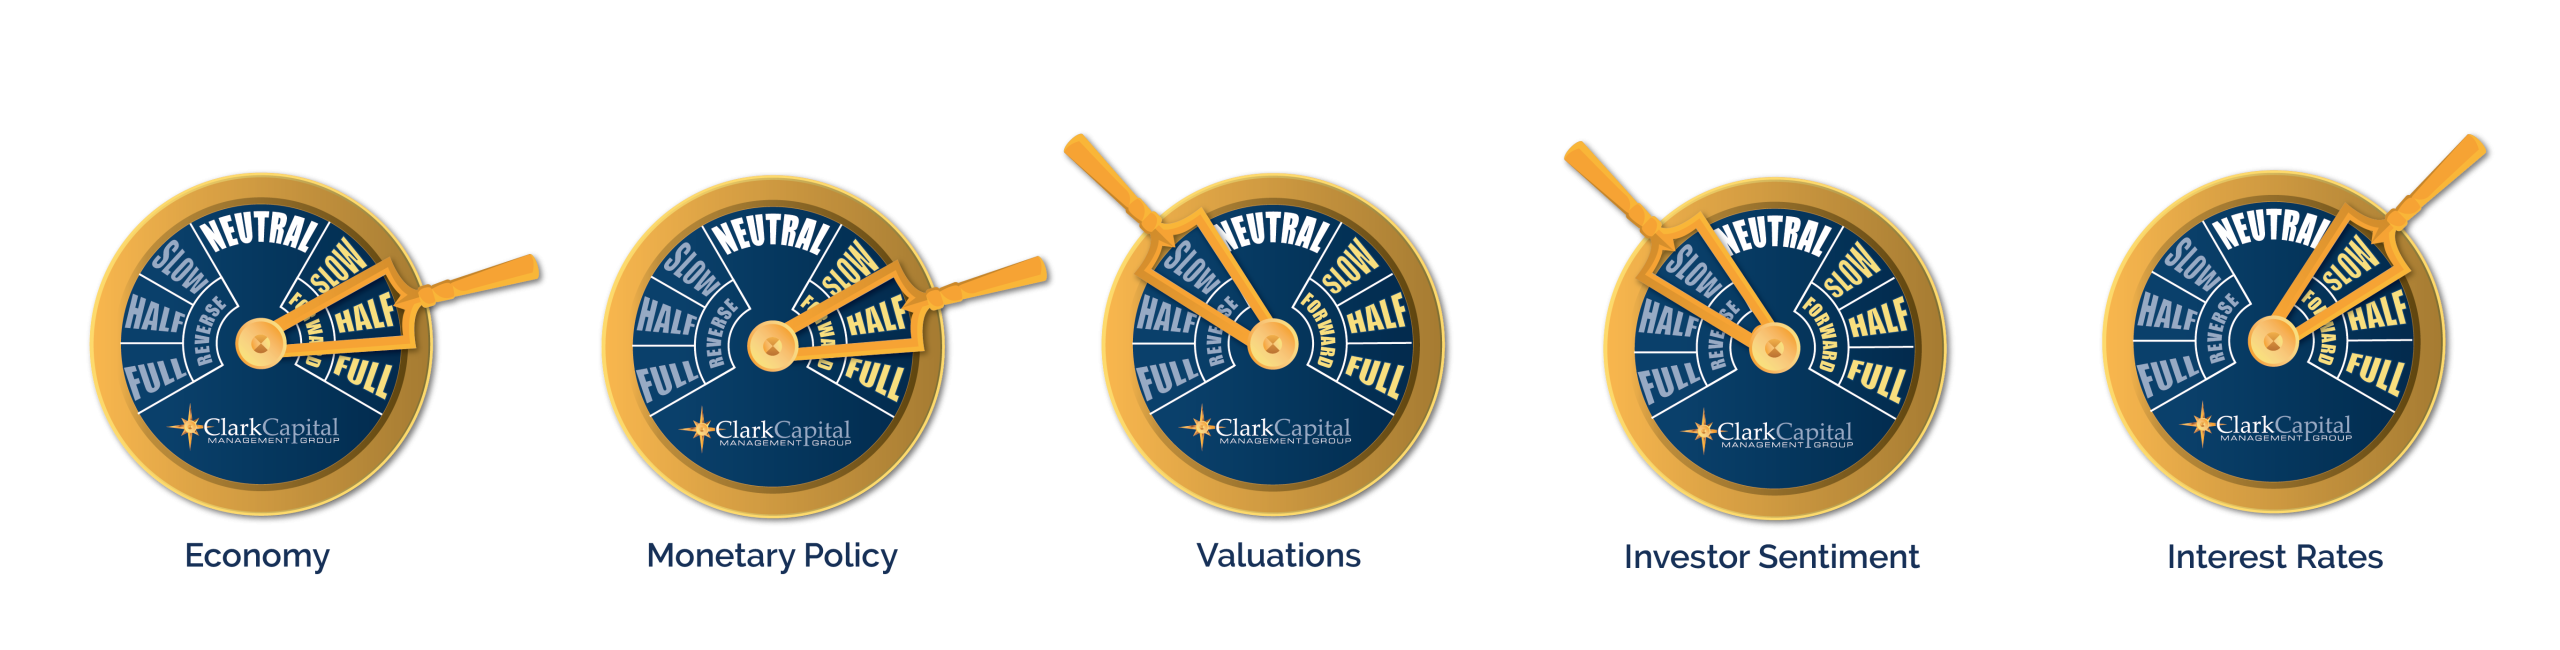
The “Economic Gauges” represent the firm’s expectations for the market, and how changes in the market will affect the strategy, but are only projections which assume certain economic conditions and industry developments and are subject to change without notice. For educational use only.
The S&P 500 measures the performance of the 500 leading companies in leading industries of the U.S. economy, capturing 75% of U.S. equities.
A 10-year Treasury note is a debt obligation issued by the U.S. Treasury Department that has a maturity of 10 years.
Treasury yield is the return on investment, expressed as a percentage, on the U.S. government’s debt obligations. Looked at another way, the Treasury yield is the effective interest rate that the U.S. government pays to borrow money for different lengths of time.
An AA bond rating signifies very high credit quality and a very low risk of default for a bond issued by a government or corporation, indicating a very strong ability to meet financial commitments that is not significantly vulnerable to foreseeable events. While not as exceptional as the highest AAA rating, an AA rating still provides strong reassurance to investors that their investment is secure.
An A rated bond signifies “high credit quality,” indicating a low risk of default, though it is more vulnerable to adverse economic conditions than higher-rated bonds. These ratings are issued by agencies like Fitch, S&P, and Moody’s, reflecting the issuer’s strong capacity to meet financial commitments, but with a greater potential risk than AA or AAA bonds.
A BBB-rated bond is an investment-grade bond that signifies an adequate, though not strong, capacity to meet financial commitments, carrying a low risk of default under normal conditions but a greater susceptibility to adverse economic or business factors compared to higher-rated bonds. In essence, these are considered the lowest tier of “safe” bonds before moving into the more speculative “junk” bond category.
The chartered financial analyst (CFA) charter is a globally-recognized professional designation offered by the CFA Institute, an organization that measures and certifies the competence and integrity of financial analysts.
Non-investment-grade debt securities (high-yield/junk bonds) may be subject to greater market fluctuations, risk of default or loss of income.
The Russell 1000 Value Index tracks companies with lower price-to-book ratios and lower expected and historical growth rates. Russell’s value indexes focus more on dividend yield.
The Russell 2000 Index measures the performance of the 2000 smallest U.S. companies based on total market capitalization in the Russell 3000, which represents approximately 10% of Russell 3000 total market capitalization.
The Bloomberg U.S. Corporate High-Yield Index covers the U.S. dollar-denominated, non-investment grade, fixed-rate, taxable corporate bond market. Securities are classified as high-yield if the middle rating of Moody’s, Fitch, and S&P is Ba1/BB+/BB+ or below. The S&P 500 and the Barclays U.S. Aggregate Bond Index are used as supplemental benchmarks.
The Bloomberg US Treasury Index measures US dollar-denominated, fixed-rate, nominal debt issued by the US Treasury. Treasury bills are excluded by the maturity constraint but are part of a separate Short Treasury Index. STRIPS are excluded from the index because their inclusion would result in double-counting. The US Treasury Index is a component of the US Aggregate, US Universal, Global Aggregate and Global Treasury Indices.
The MSCI All Country World ex USA Total Return (MSCI ACWI) is a market capitalization weighted index designed to provide a broad measure of equity-market performance throughout the world. The MSCI ACWI is maintained by Morgan Stanley Capital International and is comprised of stocks from both developed and emerging markets.
ICE BofA US Corporate C Index, a subset of the ICE BofA US High Yield Master II Index, tracks the performance of US dollar denominated below investment grade rated corporate debt publicly issued in the US domestic market. This subset includes all securities with a given investment grade rating CCC or below.

