
Clark Capital’s Bottom-Up, Fundamental Strategies
U.S. equity markets declined sharply in March amid a pronounced risk-off environment driven by escalating geopolitical tensions with the war in Iran. With the conflict now entering its second month, the effective closure of the Strait of Hormuz constrained global energy supply and pushed both Brent and WTI crude above $100/barrel, approximately 77% higher than year-end levels. The oil shock reverberated quickly through markets, reigniting inflation concerns just as price pressures had been easing across developed economies. Inflation concerns impacted the rates markets, with the 10-Year Treasury note yield surging from a low of 3.96% before the conflict to a high of 4.44% in late March.
Amidst the challenging geopolitical environment, our equity strategies continue to balance portfolio holdings between dominant large-cap growth companies and those anti-fragile large-, small-, and mid-cap companies that continue to see strong business momentum. For the High Dividend Equity strategy, the backdrop remains constructive, offering both income generation and reduced volatility; however, risks persist, including potential pressure on dividend payout sustainability in cyclical sectors and continued sensitivity to interest rate policy. A disciplined approach emphasizing dividend quality, secular growth opportunities, and sector diversification remains key to navigating current market conditions.
Below are strategy updates from March:
Navigator® All Cap Core U.S. Equity
- The portfolio is fully invested with ~69% in large-cap stocks and the remainder in mid-/small-cap companies and cash.
- The portfolio continues to balance portfolio holdings between dominant large-cap growth companies and those anti-fragile large-, small-, and mid-cap companies that continue to see business momentum.
- The three largest portfolio sectors at the end of the period were Information Technology, Financials, and Health Care.
- Our current weighting in the Big Six free cash flow margin monopolies is 29.2% vs. approximately 26.8% in the Russell 3000. Information Technology remains the largest sector weight in the strategy at 29.2%, a slight underweight to the Russell 3000 benchmark.
- To benefit from improving business fundamentals during the month, the two most recent additions to the portfolio were an independent exploration and production company focused on crude oil and natural gas and a medical device company best known for digital orthodontic solutions.
- The three most recent exits were a global marketing and communications company, a leading provider of cloud-based customer relationship management (CRM) software, and a supplier of aftermarket automotive parts.
Navigator® High Dividend Equity
- The portfolio is positioned with approximately 98% in developed countries with the remainder in cash. The United States is the largest country weight at 92.1%, followed by the United Kingdom at 3.4%, and Switzerland at 1.5%.
- Approximately 88.6% of the portfolio is in large-cap stocks with the remainder in mid-cap stocks and cash.
- Financials represent the largest sector exposure of 18.9%, nearly 1% below the benchmark weight. The next three largest portfolio weights are Industrials, Information Technology, and Health Care at 14.9%, 11.4%, and 10.9%, respectively.
- To benefit from improving business fundamentals during the month, the three most recent additions to the portfolio were a diagnostic testing and healthcare information services provider, a global tools and industrial equipment manufacturer, and a leading U.S. semiconductor company.
- The most recent exit was an Ireland-based global building materials company.
Navigator® Large Cap Growth
- The portfolio is fully invested with ~90% of the portfolio in large-cap stocks and the balance in mid-cap stocks and cash.
- Approximately 99% of total holdings are in developed countries with approximately 95% based in the United States.
- Over 70% of portfolio holdings are derived from the 100 largest cash flow producing companies with high and growing cash flows, high cash flow margins, and increasing sales.
- The three largest portfolio sectors at the end of the period were Information Technology, Communication Services, and Industrials.
- Our current weighting in the Big Six free cash flow margin monopolies is 52.1% vs. approximately 48.3% in the Russell 1000 Growth. Albeit underweight to the benchmark, Information Technology remains the largest sector weight in the strategy at 46.0%.
- There were no trades this month.
Navigator® International Equity ADR
- The portfolio is positioned with ~13.7% in emerging /frontier markets with the balance in developed economies and cash.
- Japan, Britain, Spain, and Canada are the strategy’s largest country weights, all ranging between 7% and 14%.
- The three largest portfolio sectors at the end of the period were Financials, Information Technology, and Industrials.
- To benefit from improving business fundamentals during the month, the three most recent additions to the portfolio were a global energy and petrochemical company, a South Korean telecommunications company, and South Korean financial holding company offering banking and insurance services.
- The three most recent exits were an industrial gases and engineering company, a Chinese online discount retailer, and a global financial services company offering insurance and asset management.
Navigator® Small Cap Core U.S. Equity
- The portfolio remains fully invested with ~83% of the portfolio in small-cap stocks with the balance in mid-cap stocks and cash.
- The portfolio continues to balance portfolio holdings between anti-fragile small and mid-cap companies characterized by high cash-flow margins and high cash-flow yields, alongside those companies exhibiting accelerating business momentum.
- The three largest portfolio sectors at the end of the period were Industrials, Financials, and Information Technology.
- To benefit from improving business fundamentals during the month, the three most recent additions to the portfolio were a global IT distributor and solutions aggregator providing hardware, software, and technology services, a manufacturer of aluminum packaging and aerospace products, and a U.S.-based oil and gas exploration company.
- The three most recent exits were a steel and metal products manufacturer, a supplier of aftermarket automotive parts, and a grocery chain focused on natural and organic foods.
Navigator® SMID Cap Core U.S. Equity
- The portfolio remains fully invested with ~53% of the portfolio in small-cap stocks, ~40% in mid-cap stocks, and the balance in large-cap stocks and cash.
- The portfolio continues to balance portfolio holdings between anti-fragile small and mid-cap companies characterized by high cash-flow margins and high cash-flow yields, alongside those companies exhibiting accelerating business momentum.
- The three largest portfolio sectors at the end of the period were Financials, Industrials, and Information Technology.
- To benefit from improving business fundamentals during the month, the three most recent additions to the portfolio were a manufacturer of aluminum packaging and aerospace products, a global real estate services and investment management firm, and a U.S.-based oil and gas exploration company.
- The three most recent exits were a steel and metal products manufacturer, a REIT focused on single-tenant commercial properties, and a supplier of aftermarket automotive parts.
Navigator® Taxable Fixed Income
- Within the portfolio, the focus remained consistent with previous months, keeping duration longer than the index and moving maturing and slightly longer bonds into the 5-year and longer portion of the yield curve.
- As rates moved higher throughout the month, duration was extended slightly longer than previous months to take advantage of the excess yield opportunities.
- Longer bank bonds were bought to increase yield and duration.
- This strategy of maximizing yield and extending duration will continue as long as interest rates remain elevated.
Navigator® Tax-Free Fixed Income
- We saw a degree of “stability” in the 2- and 20-year sector of the muni curve, where the overall scope of movement was approximately 40 basis points (bps) higher in each tenor versus the movement of 60 bps seen in 5- and 10-year yields.
- Slopes overall through 12 years were steeper, with 2s5s 12bps steeper at their widest and 5s10s and 5s12s 9bps wider. The attractive absolute yields and the curve’s near record steepness (set mid-February 2026) in the 15- and 20-year maturities worked in their favor as slopes flattened out as measured by 5s15s and 5s20s.
- The allocations to the barbell we have discussed were additive, and the movement in the curve may lead to capping extension and short-term allocations as the 5- and 7-year maturities become more fairly priced. External geopolitical influences need to abate before a clear course can be mapped.
- Considering muni yields as a percentage of treasury yields, munis underperformed under the weight of supply and uncertainty. Also adding to weakness was decreased net negative supply, which is a seasonal occurrence we often refer to as the Ides of March. Muni ratios increased in all maturity tenors, with the greatest increases in 7s and 10s. On a slope and ratio basis, we believe 7–10-year maturities are becoming compelling.
- We are increasingly vigilant on local secondary school credits and general obligation debt, especially in states like Florida, Texas, Georgia, and North Carolina that are looking to eliminate or reduce property taxes, an essential source of revenue used to back such debt.
Clark Capital’s Top-Down, Quantitative Strategies
The global markets assumed a risk-off bias due to the war in Iran. Equity and bond markets declined, but so far, the declines have been held in check on optimism that the conflict may be resolved shortly. At its worst, the S&P 500 fell 7.68%. For the month, the S&P 500 declined 4.98%, the Russell 2000 lost 5.01%, and the MSCI AWCI-ex U.S. Index sank 10.79%. Across fixed income, Treasuries got hit the hardest as rate cut expectations evaporated as energy prices surged. For the month, the 7-10 Year Treasury Index lost 2.32%, the Aggregate Bond Index lost 1.76%, and High Yield declined 1.18%.
The declines in the market so far are consistent with past geopolitical shocks. Looking back at 59 crisis events since 1907, the initial drop for the market averaged 7.0%, with one-, three-, six-, and twelve-month average returns all higher. The war took a toll on investor sentiment. According to the American Association of Individual Investors (AAII) sentiment poll, in mid-March only 30.4% of investors were bullish while 52% were bearish. To put that into perspective, the only times over the past 10 years that investors were more bearish than now was in 2020 during the COVID meltdown, 2022 after Russia invaded Ukraine, and the 2025 tariff declines.
At the strategy level, Fixed Income Total Return and Global Tactical remain risk-on, while Tactical Investment Grade Bond assumed a risk-off bias due to the declines in investment grade debt and U.S. Treasuries. The Style Opportunity portfolio has a modest value tilt, but also recently added a mid-cap momentum position to increase portfolio beta.
Below are strategy updates from March:
Navigator® Alternative
- Managed futures and their ability to own commodities and short interest rates were lead contributors in the mutual fund core, while multistrategy funds have faded amidst recent volatility.
- After underweighting equities to start the year, the recent decline has seen us dip our toes back in with purchases in beaten down areas like business development company (BDC) ETFs, software, and listed private equity.
Navigator® Fixed Income Total Return (MultiStrategy Fixed Income)
- The portfolio continues to favor high yield over Treasuries or cash. The war’s onset and recent market volatility has gotten us much closer to playing defense.
- Nevertheless, the most dramatic sell-off has been contained to bank loans and private credit, while larger, more established companies in the high yield space have held their own. It appears that the sell-off was driven by fear that can disappear as quickly as it came.
- The recent rise in rates means that if we are forced to play defense, cash would be the defensive vehicle of choice.
Navigator® Global Risk Management
- Our credit-based models have certainly weakened as the war and its consequences have unsettled markets.
- Nevertheless, our models indicate that investor fears and selling are driven by temporary and not fundamental factors.
- A sudden turn in geopolitical events should be recognized quickly by equity markets that could regain ground suddenly.
Navigator® Global Tactical
- The portfolio continues to favor risk-on equities, and our models certainly have come closer to playing defense as the war began. Nevertheless, the fundamental damage to credit markets has been contained.
- High yield declined just over 2%, and spreads are only modest off their lows. Thus, the decline has been sentiment-driven and fear-driven, and fundamentals remain solid.
- A quick turnaround in the war will likely see markets resurgent.
Navigator® U.S. Sector Opportunity
- Many sectors and industries rank higher than the S&P 500.
- Our holdings range from war beneficiaries Energy and natural resources to cyclical Industrials, aerospace, infrastructure, and cybersecurity.
- Meanwhile, we also own defensive Health Care, Staples, and Utilities. Consumer Discretionary and mega-cap Tech are to be avoided.
Navigator® U.S. Style Opportunity (MultiStrategy Equity)
- The portfolio continues to modestly favor value stocks, with the Russell Top 200 Value and cash cows as top holdings.
- Mid-cap momentum was a recent addition that we believe should increase portfolio beta. We continue to own a large 67% indexed position.
- We should note that while large-cap growth fares poorly in our current rankings, its recent decline has repositioned it with what we view as attractive valuations that could fuel an extended rally and recovery later this year.
Navigator® U.S. Strategic Beta
- The portfolio maintains a modest growth tilt, and with large-cap growth now looking much more attractive on a valuation basis, we expect to continue that stance, as earnings estimates among growth stocks are stable despite the recent decline.
Disclosures
The views expressed are those of the author(s) and do not necessarily reflect the views of Clark Capital Management Group. The opinions referenced are as of the date of publication and are subject to change due to changes in the market or economic conditions and may not necessarily come to pass. There is no guarantee of the future performance of any Clark Capital investments portfolio. Material presented has been derived from sources considered to be reliable, but the accuracy and completeness cannot be guaranteed. Nothing herein should be construed as a solicitation, recommendation or an offer to buy, sell or hold any securities, other investments or to adopt any investment strategy or strategies. For educational use only. This information is not intended to serve as investment advice. This material is not intended to be relied upon as a forecast or research. The investment or strategy discussed may not be suitable for all investors. Investors must make their own decisions based on their specific investment objectives and financial circumstances. Past performance does not guarantee future results. All investing involves risk, including the loss of principal, and there can be no guarantee investment objectives will be met.
Clark Capital Management Group (Clark) is an investment adviser registered with the U.S. Securities and Exchange Commission. Registration does not imply a certain level of skill or training. More information about Clark’s investment advisory services can be found in its Form ADV Part 2 and/or Form CRS, which are available upon request.
Fixed income securities are subject to certain risks including, but not limited to: interest rate (changes in interest rates may cause a decline in market value of an investment), credit, payment, call (some bonds allow the issuer to call a bond for redemption before it matures), and extension (principal repayments may not occur as quickly as anticipated, causing the expected maturity of a security
to increase).
Foreign securities are more volatile, harder to price and less liquid than U.S. securities. They are subject to different accounting and regulatory standards and political and economic risks. These risks are enhanced in emerging market countries.
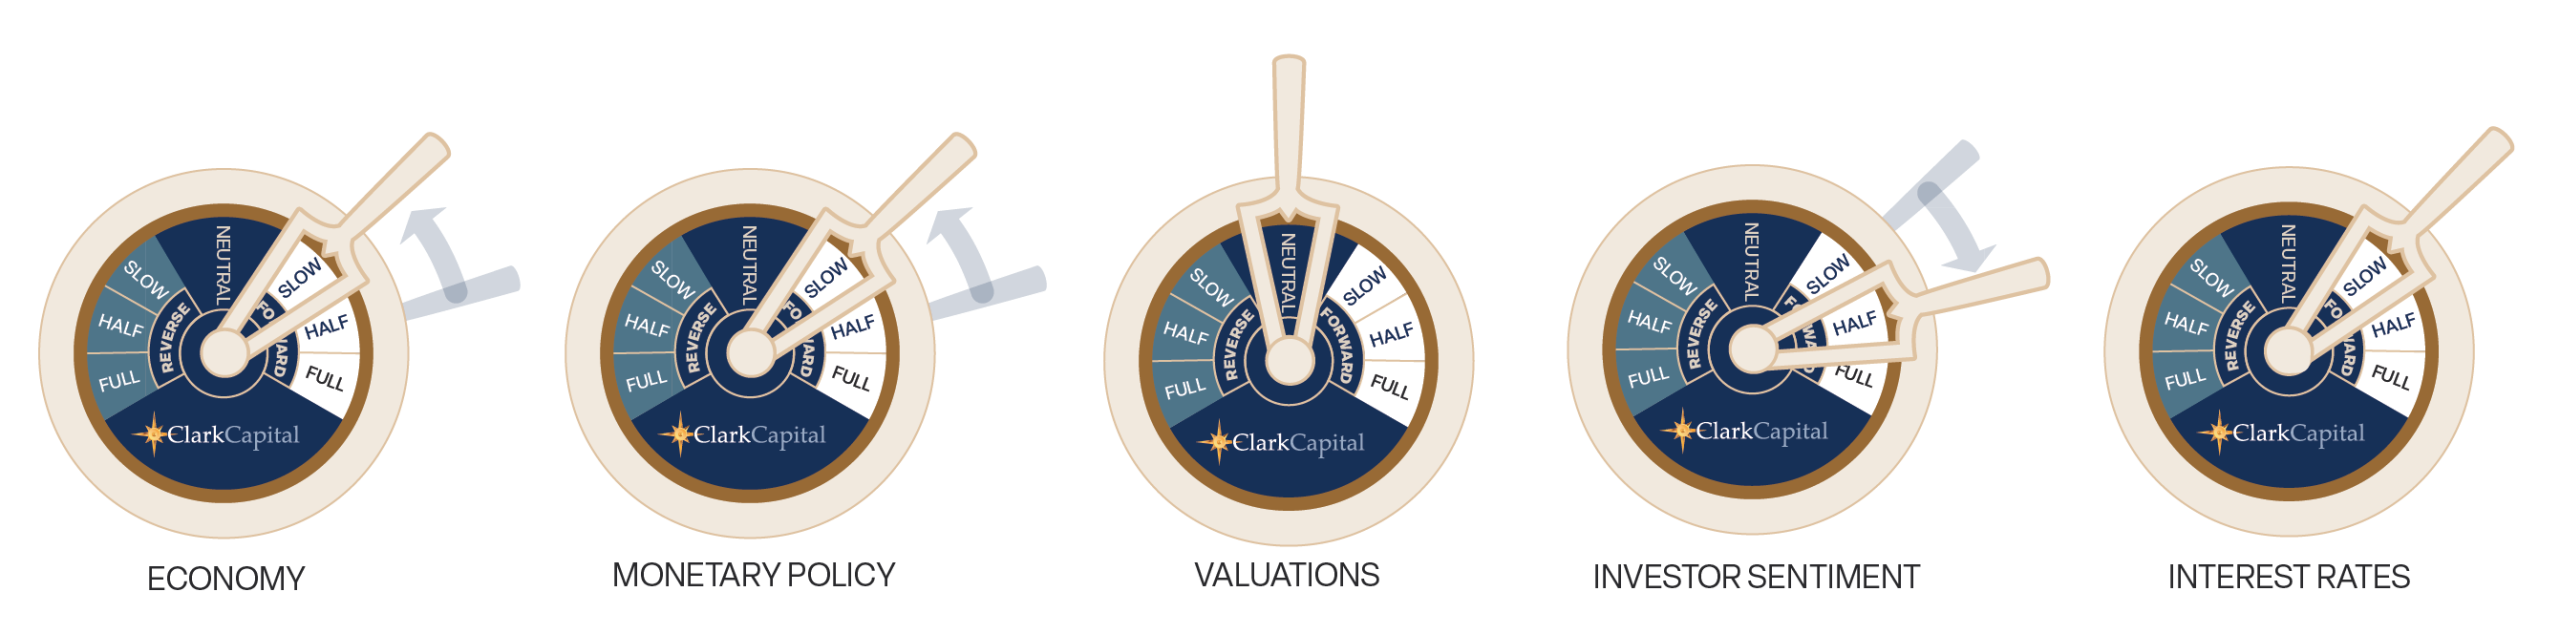
The “Economic Gauges” represent the firm’s expectations for the market, and how changes in the market will affect the strategy, but are only projections which assume certain economic conditions and industry developments and are subject to change without notice. For educational use only.
The S&P 500 measures the performance of the 500 leading companies in leading industries of the U.S. economy, capturing 75% of U.S. equities.
A 10-year Treasury note is a debt obligation issued by the U.S. Treasury Department that has a maturity of 10 years.
Treasury yield is the return on investment, expressed as a percentage, on the U.S. government’s debt obligations. Looked at another way, the Treasury yield is the effective interest rate that the U.S. government pays to borrow money for different lengths of time.
An AA bond rating signifies very high credit quality and a very low risk of default for a bond issued by a government or corporation, indicating a very strong ability to meet financial commitments that is not significantly vulnerable to foreseeable events. While not as exceptional as the highest AAA rating, an AA rating still provides strong reassurance to investors that their investment is secure.
An A rated bond signifies “high credit quality,” indicating a low risk of default, though it is more vulnerable to adverse economic conditions than higher-rated bonds. These ratings are issued by agencies like Fitch, S&P, and Moody’s, reflecting the issuer’s strong capacity to meet financial commitments, but with a greater potential risk than AA or AAA bonds.
A BBB-rated bond is an investment-grade bond that signifies an adequate, though not strong, capacity to meet financial commitments, carrying a low risk of default under normal conditions but a greater susceptibility to adverse economic or business factors compared to higher-rated bonds. In essence, these are considered the lowest tier of “safe” bonds before moving into the more speculative “junk” bond category.
The chartered financial analyst (CFA) charter is a globally-recognized professional designation offered by the CFA Institute, an organization that measures and certifies the competence and integrity of financial analysts.
Non-investment-grade debt securities (high-yield/junk bonds) may be subject to greater market fluctuations, risk of default or loss of income.
The Russell 1000 Value Index tracks companies with lower price-to-book ratios and lower expected and historical growth rates. Russell’s value indexes focus more on dividend yield.
The Russell 2000 Index measures the performance of the 2000 smallest U.S. companies based on total market capitalization in the Russell 3000, which represents approximately 10% of Russell 3000 total market capitalization.
The Bloomberg U.S. Corporate High-Yield Index covers the U.S. dollar-denominated, non-investment grade, fixed-rate, taxable corporate bond market. Securities are classified as high-yield if the middle rating of Moody’s, Fitch, and S&P is Ba1/BB+/BB+ or below. The S&P 500 and the Barclays U.S. Aggregate Bond Index are used as supplemental benchmarks.
The Bloomberg US Treasury Index measures US dollar-denominated, fixed-rate, nominal debt issued by the US Treasury. Treasury bills are excluded by the maturity constraint but are part of a separate Short Treasury Index. STRIPS are excluded from the index because their inclusion would result in double-counting. The US Treasury Index is a component of the US Aggregate, US Universal, Global Aggregate and Global Treasury Indices.
The MSCI All Country World ex USA Total Return (MSCI ACWI) is a market capitalization weighted index designed to provide a broad measure of equity-market performance throughout the world. The MSCI ACWI is maintained by Morgan Stanley Capital International and is comprised of stocks from both developed and emerging markets.
ICE BofA US Corporate C Index, a subset of the ICE BofA US High Yield Master II Index, tracks the performance of US dollar denominated below investment grade rated corporate debt publicly issued in the US domestic market. This subset includes all securities with a given investment grade rating CCC or below.
Equity securities are subject to price fluctuation and possible loss of principal. Stock markets tend to move in cycles, with periods of rising prices and periods of falling prices. Certain investment strategies tend to increase the total risk of an investment (relative to the broader market). Strategies that concentrate their investments in limited sectors are more vulnerable to adverse market, economic, regulatory, political, or other developments affecting those sectors.

