
Clark Capital’s Bottom-Up, Fundamental Strategies
Markets experienced meaningful volatility in November as investors reacted to the extended government shutdown, uncertainty surrounding Federal Reserve policy, and growing questions about the long-term sustainability of AI-related capital spending. Early weakness in risk assets gave way to a strong rebound later in the month as expectations for a December rate cut improved. Despite recession-level consumer sentiment and a gradually rising unemployment rate, the overall economy continued to show resilience, supported by strong productivity trends and robust corporate earnings, more than 80% of S&P 500 companies exceeded profit expectations.
Within portfolios, we continued to focus on improving yield and positioning for stronger total returns. For example, in the Taxable Bond portfolio, we selectively shifted from short-dated bank bonds into higher-yielding five- to seven-year maturities and added high-quality telecom names. These moves lowered the overall price of the portfolio while increasing income, aiming to enhance both near-term cash flow and long-term return potential. Looking ahead, markets will continue to balance the benefits of AI-driven productivity gains against potential overinvestment risks, but steady earnings, moderating inflation, and constructive credit conditions provide a supportive environment.
Below are strategy updates from November:
Navigator® All Cap Core U.S. Equity
- The portfolio is fully invested with over 75% in large-cap stocks and the remainder in mid-cap companies, small-cap companies, and cash.
- The portfolio continues to balance portfolio holdings between dominant large-cap growth companies and those anti-fragile large-, small-, and mid-cap companies that continue to see strong business momentum.
- The three largest portfolio sectors at the end of the period were Information Technology, Financials, and Industrials.
- Our current weighting in the big six free cash flow margin monopolies is 27.7% vs. approximately 28.8% in the Russell 3000. Albeit underweight to the benchmark, Information Technology remains the strategy’s largest sector weight at 29.8%.
- To benefit from improving business fundamentals during the month, the three most recent additions to the portfolio were a natural gas pipeline and storage company, a U.S. energy infrastructure company, and a cybersecurity and compliance software provider.
- The two most recent exits were a midstream energy company providing gathering, compression, processing, and water handling services for natural gas and an independent energy company engaged in oil and natural gas exploration and production.
Navigator® High Dividend Equity
- The portfolio is positioned with approximately 98% in developed countries with the remainder in cash. The United States is the largest country weight at 90.3%, followed by the United Kingdom at 3.6%, and Ireland at 2.0%.
- Over 98% of the portfolio is in large cap with the remainder in cash.
- Financials represent the largest sector weight at 21.3%, below the benchmark weight. The next three largest portfolio weights are Industrials, Health Care, and Information Technology at 16.6%, 13.0% and 11.0%, respectively.
- To benefit from improving business fundamentals during the month, the most recent addition to the portfolio was a global energy technology company. The most recent exit was a U.S. homebuilder.
Navigator® Large Cap Growth
- The portfolio is fully invested with over 95% in large-cap stocks.
- Approximately 99% of total holdings are in developed countries with approximately 92% based in the United States.
- Over 70% of portfolio holdings are derived from the 100 largest cash-flow-producing companies with high and growing cash flows, high cash-flow margins, and increasing sales.
- The three largest portfolio sectors at the end of the period were Information Technology, Communication Services, and Consumer Discretionary.
- Our current weighting in the big six free cash flow margin monopolies is 52.7% vs. approximately 49.4% in the Russell 1000 Growth. Albeit underweight to the benchmark, Information Technology remains the largest sector weight in the strategy at 47.5%.
Navigator® International Equity ADR
- The portfolio is positioned with ~19% in emerging and frontier markets with the balance in developed economies and cash.
- Britain, Canada, China, Ireland, Japan, and Spain are the strategy’s largest country weights, all ranging between 6% and 15%.
- The three largest portfolio sectors at the end of the period were Financials, Information Technology, and Industrials.
- To benefit from improving business fundamentals during the month, the three most recent additions to the portfolio were a major Chinese mining company, a global provider of sterilization, infection prevention, and surgical equipment for healthcare systems, and one of the world’s leading brewers.
- The three most recent exits were a Chinese technology company focused on online gaming, media, and cloud services, a provider of cloud-based customer experience, call-center, and analytics software solutions, and a global construction and concessions company.
Navigator® Taxable Fixed Income
- Within the portfolio, the focus remained consistent with previous months: keeping duration slightly longer than the index and moving maturing and slightly longer bonds into the five-year and longer portion of the yield curve. Many of these trades occurred in the banking sector.
- The portfolio will continue to execute trades like these where the overall price is reduced while increasing the overall yield. A little further out the curve, telecom names were purchased.
- This thesis of maximizing yield while also positioning to maximize total return will continue to be the near-term focus.
Navigator® Tax-Free Fixed Income
- Supply has been a touchstone talking point all year, and totals did not disappoint in November. Tax exempt supply totaled $40.7B, the highest November ever and was 67% above the trailing five-year average.
- Inflows alone do not a market make. Stable to improving credit, compelling taxable equivalent yields, and favorable cross market ratios also supported muni demand. While ratios indicate that munis underperformed to a small extent, we interpret that as a function of the concessions that had to be made to place the supply. We believe that makes investment entry more attractive—a win for buyers. Furthermore, as muni rates were basically unchanged over the month, taxable equivalent yields were, too.
- Finally, the curve is still inverted in the front end, flat in the belly, and steeper in the longer intermediate maturities, so we still favor allocations to the two- to three-year maturities and allocations to the 12-15 year maturities where we can capture yield and favorable roll-down profiles.
Clark Capital’s Top-Down, Quantitative Strategies
The markets endured early volatility and rallied strongly into month end to finish mostly positive for the month. The S&P 500 posted gains in the last five days of November to extend its monthly winning streak to seven consecutive gains. For the month, the S&P 500 gained 0.25%, the Russell 2000 added 0.96%, and international stocks ended flat. In fixed income, the high yield index gained 0.58%, and 7-10 year Treasuries advanced 1.02%.
Large-cap value stocks outperformed large-cap growth stocks, driven in part by softness in several mega-cap technology names that have led markets higher for much of the year. With a small number of companies representing more than half of the large-cap growth index, concentration risk remains elevated, making the market more sensitive to shifting views on AI investment.
Tactical strategies remain risk-on with solid credit market fundamentals as high yield indices surged to new all-time highs. Fixed Income Total Return, Global Tactical, and Global Risk Management remain allocated to their respective risk-on allocations. While large cap growth has stalled a bit and is not making relative highs right now, no other style or factor has shown any persistence relative strength. As such, our equity bias in Style Opportunity has us overweight large-cap growth and index allocations.
Below are strategy updates from November:
Navigator® Alternative
- An options-based strategy and a quantitative factor strategy topped the mutual fund core performance, as commodity long/short and multi-strategy were laggards.
- The portfolio continues to underweight equities, with smaller position sizes compared to what we owned for most of the year.
- Gold, silver, and precious metals remain long-term positions, and we have reduced them slightly, taking gains.
- We recently added a small position in a cloud technology ETF after the November correction.
Navigator® Fixed Income Total Return (MultiStrategy Fixed Income)
- While our models are slightly off making new highs, high yield has made new price highs and appears in very strong shape as we enter a seasonally strong December.
- We expect to maintain our risk-on position over the intermediate term.
Navigator® Global Risk Management
- Our quantitative models continue to be bullish and favor risk-on equities.
- From a macro level, a number of factors support this view, including a dovish Fed that still will deliver more cuts, extremely low consumer sentiment that is likely to rebound since there are no signs of recession, and the 2026 benefits of the tax cuts in the One Big Beautiful Bill.
Navigator® Global Tactical
- Our credit-based models indicate continued underlying fundamental strength among corporate balance sheets.
- We see very little evidence for recession or a dramatic earnings decline.
- As a result, we would expect that our risk-on position in equites will continue over the intermediate term.
Navigator® U.S. Sector Opportunity
- Technology took a hit in November but may be likely to recover as a year-end rally develops. Thus, we have reduced but have not eliminated our positions there.
- Health Care has undergone a brutal multiyear period of underperformance. Now, many Health Care ETFs (broad Health Care, biotech, and pharma) have risen near the top of our rankings, and we are likely to give Health Care some rope given its long-term potential.
- Real Estate, Staples, and Energy continue to flounder near the bottom of our rankings.
Navigator® U.S. Style Opportunity (MultiStrategy Equity)
- The portfolio slightly reduced its large-cap growth position.
- While large growth has stalled a bit and is not making relative highs right now, no other style or factor has built a sustained relative uptrend.
- Large value and small caps can now be said to have a neutral trend, and further relative strength there could lead to establishing new positions.
Navigator® U.S. Strategic Beta
- In late October, the portfolio briefly undertook a more defensive stance, reducing growth stocks for value.
- As the November correction took hold and deepened, we reinitiated a modest overweight to growth stocks in anticipation of a year-end risk-on rally.
- As we look forward into 2026, we anticipate that turning more defensive will become a stronger possibility.
Disclosures
The views expressed are those of the author(s) and do not necessarily reflect the views of Clark Capital Management Group. The opinions referenced are as of the date of publication and are subject to change due to changes in the market or economic conditions and may not necessarily come to pass. There is no guarantee of the future performance of any Clark Capital investments portfolio. Material presented has been derived from sources considered to be reliable, but the accuracy and completeness cannot be guaranteed. Nothing herein should be construed as a solicitation, recommendation or an offer to buy, sell or hold any securities, other investments or to adopt any investment strategy or strategies. For educational use only. This information is not intended to serve as investment advice. This material is not intended to be relied upon as a forecast or research. The investment or strategy discussed may not be suitable for all investors. Investors must make their own decisions based on their specific investment objectives and financial circumstances. Past performance does not guarantee future results.
Clark Capital Management Group (Clark) is an investment adviser registered with the U.S. Securities and Exchange Commission. Registration does not imply a certain level of skill or training. More information about Clark’s investment advisory services can be found in its Form ADV Part 2 and/or Form CRS, which are available upon request.
Fixed income securities are subject to certain risks including, but not limited to: interest rate (changes in interest rates may cause a decline in market value of an investment), credit, payment, call (some bonds allow the issuer to call a bond for redemption before it matures), and extension (principal repayments may not occur as quickly as anticipated, causing the expected maturity of a security
to increase).
Foreign securities are more volatile, harder to price and less liquid than U.S. securities. They are subject to different accounting and regulatory standards and political and economic risks. These risks are enhanced in emerging market countries.
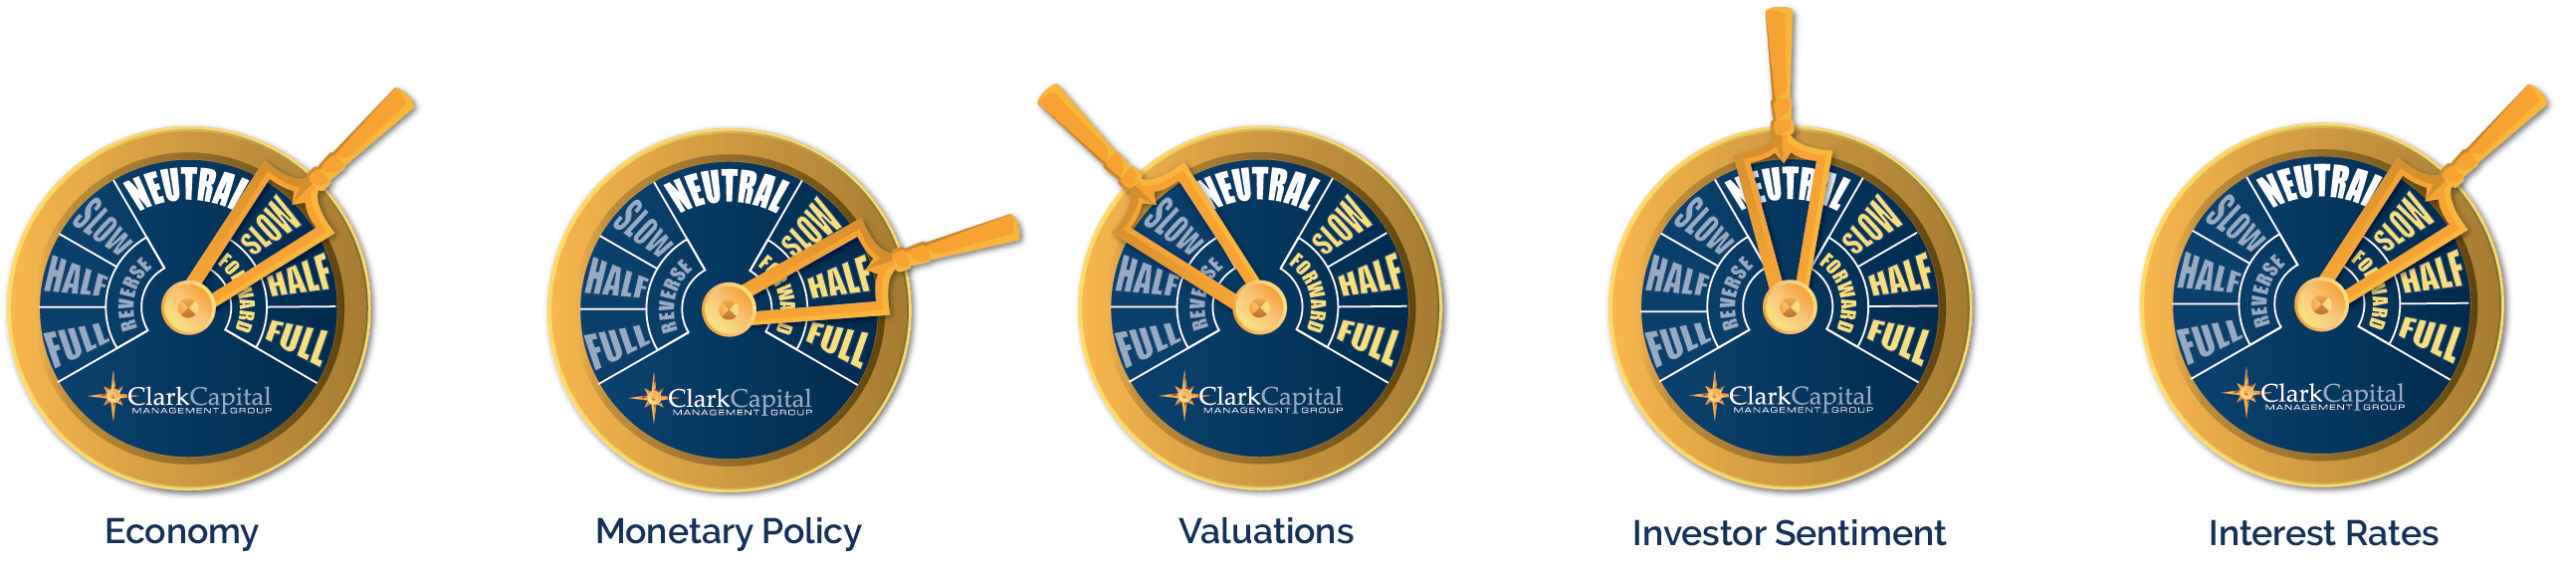
The “Economic Gauges” represent the firm’s expectations for the market, and how changes in the market will affect the strategy, but are only projections which assume certain economic conditions and industry developments and are subject to change without notice. For educational use only.
The S&P 500 measures the performance of the 500 leading companies in leading industries of the U.S. economy, capturing 75% of U.S. equities.
A 10-year Treasury note is a debt obligation issued by the U.S. Treasury Department that has a maturity of 10 years.
Treasury yield is the return on investment, expressed as a percentage, on the U.S. government’s debt obligations. Looked at another way, the Treasury yield is the effective interest rate that the U.S. government pays to borrow money for different lengths of time.
An AA bond rating signifies very high credit quality and a very low risk of default for a bond issued by a government or corporation, indicating a very strong ability to meet financial commitments that is not significantly vulnerable to foreseeable events. While not as exceptional as the highest AAA rating, an AA rating still provides strong reassurance to investors that their investment is secure.
An A rated bond signifies "high credit quality," indicating a low risk of default, though it is more vulnerable to adverse economic conditions than higher-rated bonds. These ratings are issued by agencies like Fitch, S&P, and Moody's, reflecting the issuer's strong capacity to meet financial commitments, but with a greater potential risk than AA or AAA bonds.
A BBB-rated bond is an investment-grade bond that signifies an adequate, though not strong, capacity to meet financial commitments, carrying a low risk of default under normal conditions but a greater susceptibility to adverse economic or business factors compared to higher-rated bonds. In essence, these are considered the lowest tier of "safe" bonds before moving into the more speculative "junk" bond category.
The chartered financial analyst (CFA) charter is a globally-recognized professional designation offered by the CFA Institute, an organization that measures and certifies the competence and integrity of financial analysts.
Non-investment-grade debt securities (high-yield/junk bonds) may be subject to greater market fluctuations, risk of default or loss of income.
The Russell 1000 Value Index tracks companies with lower price-to-book ratios and lower expected and historical growth rates. Russell’s value indexes focus more on dividend yield.
The Russell 2000 Index measures the performance of the 2000 smallest U.S. companies based on total market capitalization in the Russell 3000, which represents approximately 10% of Russell 3000 total market capitalization.
The Bloomberg U.S. Corporate High-Yield Index covers the U.S. dollar-denominated, non-investment grade, fixed-rate, taxable corporate bond market. Securities are classified as high-yield if the middle rating of Moody’s, Fitch, and S&P is Ba1/BB+/BB+ or below. The S&P 500 and the Barclays U.S. Aggregate Bond Index are used as supplemental benchmarks.
The Bloomberg US Treasury Index measures US dollar-denominated, fixed-rate, nominal debt issued by the US Treasury. Treasury bills are excluded by the maturity constraint but are part of a separate Short Treasury Index. STRIPS are excluded from the index because their inclusion would result in double-counting. The US Treasury Index is a component of the US Aggregate, US Universal, Global Aggregate and Global Treasury Indices.
The MSCI All Country World ex USA Total Return (MSCI ACWI) is a market capitalization weighted index designed to provide a broad measure of equity-market performance throughout the world. The MSCI ACWI is maintained by Morgan Stanley Capital International and is comprised of stocks from both developed and emerging markets.
ICE BofA US Corporate C Index, a subset of the ICE BofA US High Yield Master II Index, tracks the performance of US dollar denominated below investment grade rated corporate debt publicly issued in the US domestic market. This subset includes all securities with a given investment grade rating CCC or below.

