
Clark Capital’s Bottom-Up, Fundamental Strategies
The S&P 500 posted its fifth straight monthly gain, and the MSCI All Country ex-US Index of international stocks rose 3.87% in September, lifting its year-to-date total return gain to over 26%. Strong third quarter earnings reports continue to propel the next 12-month S&P 500 earnings estimates to new highs, while mid-cap and small-cap earnings estimates have also begun to perk up. The broadening of the earnings landscape is a welcome sign of potential broadening participation.
The Federal Reserve eased policy during September by lowering the fed funds rate by 0.25% to 4.25%. The Fed’s rationale for resuming its rate cut cycle was due to concerns over a weakening labor market as job growth has dramatically slowed with large downside revisions, and both the manufacturing sector of the economy and housing remain weak. Policymakers viewed the cut as an insurance policy against further weakening of the labor market, as Chair Powell termed it a “risk management cut,” even though GDP continues to grow at a solid pace (Q2 GDP was 3.8% and the Atlanta Fed GDPNow Forecast for Q3 is currently 3.8%) and inflation remains above the Fed's 2.0% year-over-year target.
Our equity strategies continue to focus on owning what we believe are high-quality, undervalued companies with improving business momentum. Durable dividend growth is also a factor of companies in our High Dividend Equity portfolio.
The corporate bond market continued to see very little stress and no real credit issues. That combination drove credit spreads, as measured by the Bloomberg Investment Grade Corporate Index, tighter to 72 basis points (bps), touching new year-to-date lows and the lowest the spreads have been since 1997.
Below are strategy updates from September:
Navigator® All Cap Core U.S. Equity
- The portfolio is fully invested with over 75% in large cap-stocks and the remainder in mid-cap companies, small-cap companies, and cash.
- The portfolio continues to balance portfolio holdings between dominant large-cap growth companies and those anti-fragile large-, small-, and mid-cap companies, which continue to see strong business momentum.
- The three largest portfolio sectors at the end of the period were Information Technology, Financials, and Industrials.
- Our current weighting in the big six free cash flow margin monopolies is 27.8% vs. approximately 28.3% in the Russell 3000. Albeit underweight to the benchmark, Information Technology remains the largest sector weight in the strategy at 29.2%.
- We made no trades in this portfolio during the month.
Navigator® High Dividend Equity
- The portfolio has approximately 98% in developed countries with the remainder in cash. The United States is the largest country weight at 91.2%, followed by the United Kingdom at 3.7%, and Ireland at 1.7%.
- Over 98% of the portfolio is large cap with the remainder in cash. Financials represent the largest sector weight at 23.3%, slightly above the benchmark weight. The next three largest portfolio weights are Industrials, Health Care, and Information Technology at 16.0%, 11.6% and 10.3%, respectively.
- During the month, the most recent exit in the portfolio was a semiconductor company focused on analog and embedded processing products.
Navigator® Large Cap Growth
- The portfolio is fully invested with over 94% in large-cap stocks.
- Approximately 99% of total holdings are in developed countries with approximately 92% based in the United States.
- Over 70% of the portfolio’s holdings are derived from the 100 largest cash flow producing companies with high and growing cash flows, high cash flow margins, and increasing sales.
- Our current weighting in the big six free cash flow margin monopolies is 54.3% vs. approximately 49.0% in the Russell 1000 Growth. Albeit underweight to the benchmark, Information Technology remains the largest sector weight in the strategy at 48.4%.
- To benefit from improving business fundamentals during the month, the most recent addition to the portfolio was a global financial services company.
- The two most recent exits were a major insurance company and a manufacturer of heating, ventilation, air conditioning, and refrigeration systems.
Navigator® International Equity ADR
- The portfolio is positioned with ~18% in emerging markets with the balance in developed economies and cash.
- Britain, Canada, China, Ireland, Japan, Spain, and Switzerland are the strategy’s largest country weights, all ranging between 6% and 17%.
- The three largest portfolio sectors at the end of the period were Financials, Information Technology, and Industrials.
- To benefit from improving business fundamentals during the month, the two most recent additions to the portfolio were a global energy company headquartered in Spain and a Chinese online discount retailer.
- The three most recent exits were a Dutch telecommunications provider, a Japanese multinational corporation that manufactures construction, mining, and utility equipment, and a precious metals mining company.
Navigator® Taxable Fixed Income
- Within the portfolio, the focus remained on keeping the duration slightly longer than the index. We continue to exercise swaps to increase the overall yield and duration.
- Most of these swaps were once again in the financial services sector. In one example, we sold five-year bonds and bought 10-year bonds. This swap increased the yield from 4.21% to 4.86% while moving out of the underperforming portion of the yield curve.
- The other main trade was to reposition mortgage bonds. As rates came down, the expectations that overall mortgage rates would also lower. This movement drove 5.5% coupon mortgages to a dollar price of over 101 and made them susceptible to lower rates going forward. These were sold and swapped into longer 4.5% coupon bonds that remain four points lower in price and thus have more room to appreciate as rates trend down.
- This thesis of maximizing yield while also positioning to maximize total return will continue to be the near-term focus.
Navigator® Tax-Free Fixed Income
- Given the month’s uneven performance, we continue to invest in structures that nominalize extension risk and have healthy size and name recognition.
- We are protecting our coupon as best we can as muni returns rely on coupons in times of stress, though we think any stress in the early fourth quarter will be a buying opportunity as November and December’s favorable technicals, combined with expected lower issuance and an accommodative Federal Reserve should set the stage for accretive performance.
- In general obligations, we continue to favor AA to A rated bonds versus AAA, given spreads. Though they have compressed, there is room for them to run further, especially should the Fed continue to cut lending rates.
- We also favor state issuers versus local names. AAA and A rated revenue bonds remain cheap to the index, and we look for more opportunities there. Overall, BBB revenue bonds are at the widest spread to the IG muni index, so we continue to make allocations there.
- Credit is always on our mind, and historic allocations to recently upgraded credits like New Jersey have been additive, as has avoiding a Philadelphia-area public transit provider.
Clark Capital’s Top-Down, Quantitative Strategies
The market continued to grind higher during September as it posted its fifth consecutive monthly gain. Year-to-date through September, the S&P 500 has advanced 14.81%, the Russell 2000 Index 10.38%, MSCI ACWI ex-US 26.02%, the High Yield Bond Index 7.22%, and 7-10-Year Treasuries 7.20%. The Fed cut rates in September, and the fed funds futures market is pricing in additional cuts at the October and December FOMC meetings.
During the month, the major indices continued to push out to new highs, and the Russell 2000 Index of small-cap stocks hit its first all-time high in over four years. Despite the new highs for the major averages, investor sentiment is not at the levels that flash warning signs. For example, the American Association of Individual Investors shows only 2.5% more bullish investors than those bearish, and money market fund assets stand at a record high $7.3 trillion. Liquidity is abundant, credit spreads are low, the Fed is cutting rates, and financial conditions are easy. As such, our tactical models are fully risk-on across the board, and strategies are fully invested in their respective risk-on asset classes.
Below are strategy updates from September:
Navigator® Alternative
- Multi-strategy funds lead performance within the portfolio's core, while event-driven has recently been lagging.
- Gold, precious metals, and miners have surged amidst a weaker dollar and Fed easing cycle.
- More broadly, the portfolio has been slightly reducing equities and has added a position in long Treasuries.
Navigator® Fixed Income Total Return (MultiStrategy Fixed Income)
- Our models continue to solidly favor credit with few fundamental or default issues appearing now or on the horizon.
- Since early May, high yield spreads have fallen from 3.8% to 2.6%, and they now have approached their lowest levels in 10 years.
Navigator® Global Risk Management
- The portfolio's credit-based models are responding positively to sound economic growth, improving earnings, and a Fed easing cycle.
- U.S. large-cap growth and the technology sphere continue to lead markets, but broader U.S. and international markets are participating in gains.
- Treasuries have shown improved price action and relative strength, and they would be our defensive vehicle of choice.
Navigator® Global Tactical
- Since our move back into equities in early May, the S&P 500 has led the way gaining 18%.
- Developed international stocks lagged but still produced a 13.7% gain.
- U.S. and international small caps were up 16% to 17%.
- Our credit-based models continue to be positive and stable with few obstacles or signs that our position could change soon.
Navigator® U.S. Sector Opportunity
- Technology and Telecomm continue to be our largest area of focus, occupying 39% of the portfolio.
- Aerospace, metals & mining, and pharmaceuticals, along with a 24% indexed S&P 500 position, are our only other holdings, indicating the narrowness of the market.
- Staples, Utilities, Discretionary, and Energy are major sectors to be avoided.
Navigator® U.S. Style Opportunity (MultiStrategy Equity)
- Large-cap growth and S&P 500 momentum continue to dominate our rankings and our portfolio.
- Mid-cap stocks, small-cap stocks, and all value stocks have not been able to get ahead of large-cap growth or the S&P 500.
- The portfolio only contains large-cap growth ETFs and a large 49% indexed position in the S&P 500.
Navigator® U.S. Strategic Beta
- Economic growth and earnings growth have improved in recent months, and markets and credit conditions have responded.
- We maintain our modestly aggressive position, favoring growth stocks and large-cap growth.
- With valuations stretched and markets enjoying a lengthy rally, at some point our next move will be to turn more defensive, but such a move remains well beyond the horizon.
Disclosures
The views expressed are those of the author(s) and do not necessarily reflect the views of Clark Capital Management Group. The opinions referenced are as of the date of publication and are subject to change due to changes in the market or economic conditions and may not necessarily come to pass. There is no guarantee of the future performance of any Clark Capital investments portfolio. Material presented has been derived from sources considered to be reliable, but the accuracy and completeness cannot be guaranteed. Nothing herein should be construed as a solicitation, recommendation or an offer to buy, sell or hold any securities, other investments or to adopt any investment strategy or strategies. For educational use only. This information is not intended to serve as investment advice. This material is not intended to be relied upon as a forecast or research. The investment or strategy discussed may not be suitable for all investors. Investors must make their own decisions based on their specific investment objectives and financial circumstances. Past performance does not guarantee future results.
Clark Capital Management Group (Clark) is an investment adviser registered with the U.S. Securities and Exchange Commission. Registration does not imply a certain level of skill or training. More information about Clark’s investment advisory services can be found in its Form ADV Part 2 and/or Form CRS, which are available upon request.
Fixed income securities are subject to certain risks including, but not limited to: interest rate (changes in interest rates may cause a decline in market value of an investment), credit, payment, call (some bonds allow the issuer to call a bond for redemption before it matures), and extension (principal repayments may not occur as quickly as anticipated, causing the expected maturity of a security
to increase).
Foreign securities are more volatile, harder to price and less liquid than U.S. securities. They are subject to different accounting and regulatory standards and political and economic risks. These risks are enhanced in emerging market countries.
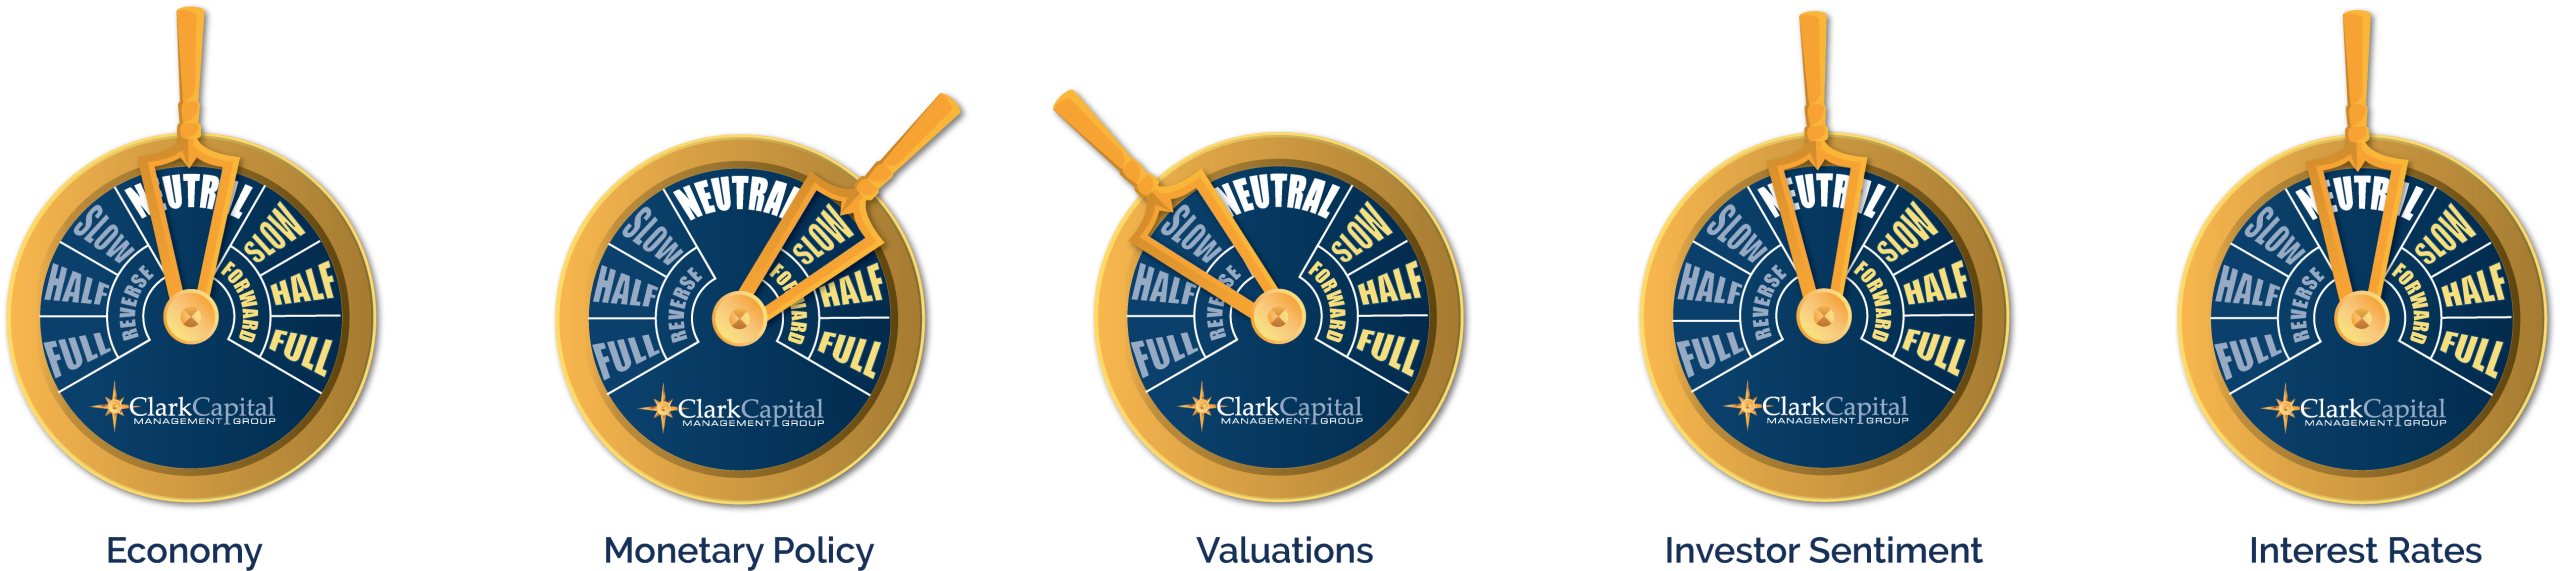
The “Economic Gauges” represent the firm’s expectations for the market, and how changes in the market will affect the strategy, but are only projections which assume certain economic conditions and industry developments and are subject to change without notice. For educational use only.
The S&P 500 measures the performance of the 500 leading companies in leading industries of the U.S. economy, capturing 75% of U.S. equities.
A 10-year Treasury note is a debt obligation issued by the U.S. Treasury Department that has a maturity of 10 years.
Treasury yield is the return on investment, expressed as a percentage, on the U.S. government’s debt obligations. Looked at another way, the Treasury yield is the effective interest rate that the U.S. government pays to borrow money for different lengths of time.
An AA bond rating signifies very high credit quality and a very low risk of default for a bond issued by a government or corporation, indicating a very strong ability to meet financial commitments that is not significantly vulnerable to foreseeable events. While not as exceptional as the highest AAA rating, an AA rating still provides strong reassurance to investors that their investment is secure.
An A rated bond signifies “high credit quality,” indicating a low risk of default, though it is more vulnerable to adverse economic conditions than higher-rated bonds. These ratings are issued by agencies like Fitch, S&P, and Moody’s, reflecting the issuer’s strong capacity to meet financial commitments, but with a greater potential risk than AA or AAA bonds.
A BBB-rated bond is an investment-grade bond that signifies an adequate, though not strong, capacity to meet financial commitments, carrying a low risk of default under normal conditions but a greater susceptibility to adverse economic or business factors compared to higher-rated bonds. In essence, these are considered the lowest tier of “safe” bonds before moving into the more speculative “junk” bond category.
The chartered financial analyst (CFA) charter is a globally-recognized professional designation offered by the CFA Institute, an organization that measures and certifies the competence and integrity of financial analysts.
Non-investment-grade debt securities (high-yield/junk bonds) may be subject to greater market fluctuations, risk of default or loss of income.
The Russell 1000 Value Index tracks companies with lower price-to-book ratios and lower expected and historical growth rates. Russell’s value indexes focus more on dividend yield.
The Russell 2000 Index measures the performance of the 2000 smallest U.S. companies based on total market capitalization in the Russell 3000, which represents approximately 10% of Russell 3000 total market capitalization.
The Bloomberg U.S. Corporate High-Yield Index covers the U.S. dollar-denominated, non-investment grade, fixed-rate, taxable corporate bond market. Securities are classified as high-yield if the middle rating of Moody’s, Fitch, and S&P is Ba1/BB+/BB+ or below. The S&P 500 and the Barclays U.S. Aggregate Bond Index are used as supplemental benchmarks.
The Bloomberg US Treasury Index measures US dollar-denominated, fixed-rate, nominal debt issued by the US Treasury. Treasury bills are excluded by the maturity constraint but are part of a separate Short Treasury Index. STRIPS are excluded from the index because their inclusion would result in double-counting. The US Treasury Index is a component of the US Aggregate, US Universal, Global Aggregate and Global Treasury Indices.
The MSCI All Country World ex USA Total Return (MSCI ACWI) is a market capitalization weighted index designed to provide a broad measure of equity-market performance throughout the world. The MSCI ACWI is maintained by Morgan Stanley Capital International and is comprised of stocks from both developed and emerging markets.
ICE BofA US Corporate C Index, a subset of the ICE BofA US High Yield Master II Index, tracks the performance of US dollar denominated below investment grade rated corporate debt publicly issued in the US domestic market. This subset includes all securities with a given investment grade rating CCC or below.

