
Post Peak Chaos?
Highlights
We believe:
- The U.S. economy remains strong in the face of multiple headwinds, though we project growth will moderate to 1.5% amid ongoing policy and tariff uncertainty.
- The sharp market correction earlier this year was a healthy reset, and we remain confident in our year-end S&P 500 target of 6700.
- Strong technical signals, including multiple breadth thrust indicators and the NDR Cycle Composite, point to continued market strength in the second half of 2025.
- The Federal Reserve is likely to stay on hold through the summer, with a possible rate cut in September depending on labor market trends.
- Rising federal deficits and debt levels represent a growing long-term risk, as reflected in upward pressure on long-term Treasury yields.
- Risks to the outlook remain, including tariff and policy uncertainty, the valuation landscape, geopolitics, and the U.S. government fiscal position.
Executive Summary
Our outlook for 2025 called for a continuation of the cyclical bull market, but not another straight-line climb like in 2023 and 2024. The economy has been remarkably strong, and our base case assumption is for continued economic growth. We have not been in the recession camp as many other analysts have forecasted over the past few years. We have consistently called for continued economic growth, and we have been impressed with the dynamic nature of the U.S. economy. In our opinion, the labor market and consumer spending are the envy of the rest of the world and engine of growth for the U.S. economy.
Coming into the year, we expected economic growth of 2.5% as Fed easing and pro-growth Trump policies, deregulation, productivity, and animal spirits exerted influence over the economy. We are reducing our growth expectation to 1.5% as uncertainty around policy provides a headwind. We believe the longer the uncertainty persists without clarity on tariffs, the more damage will be done.
Inflation has continued to moderate, and the impact of tariffs has not boosted price indices so far. Progress on the tariff negotiation front over the next several months will be important for inflation to continue moderating. As such, the Federal Reserve is in no rush to cut rates given challenges with their dual mandate. They are worried about the tariff effects on future inflation and concerned about the health of the labor markets as job growth has slowed.
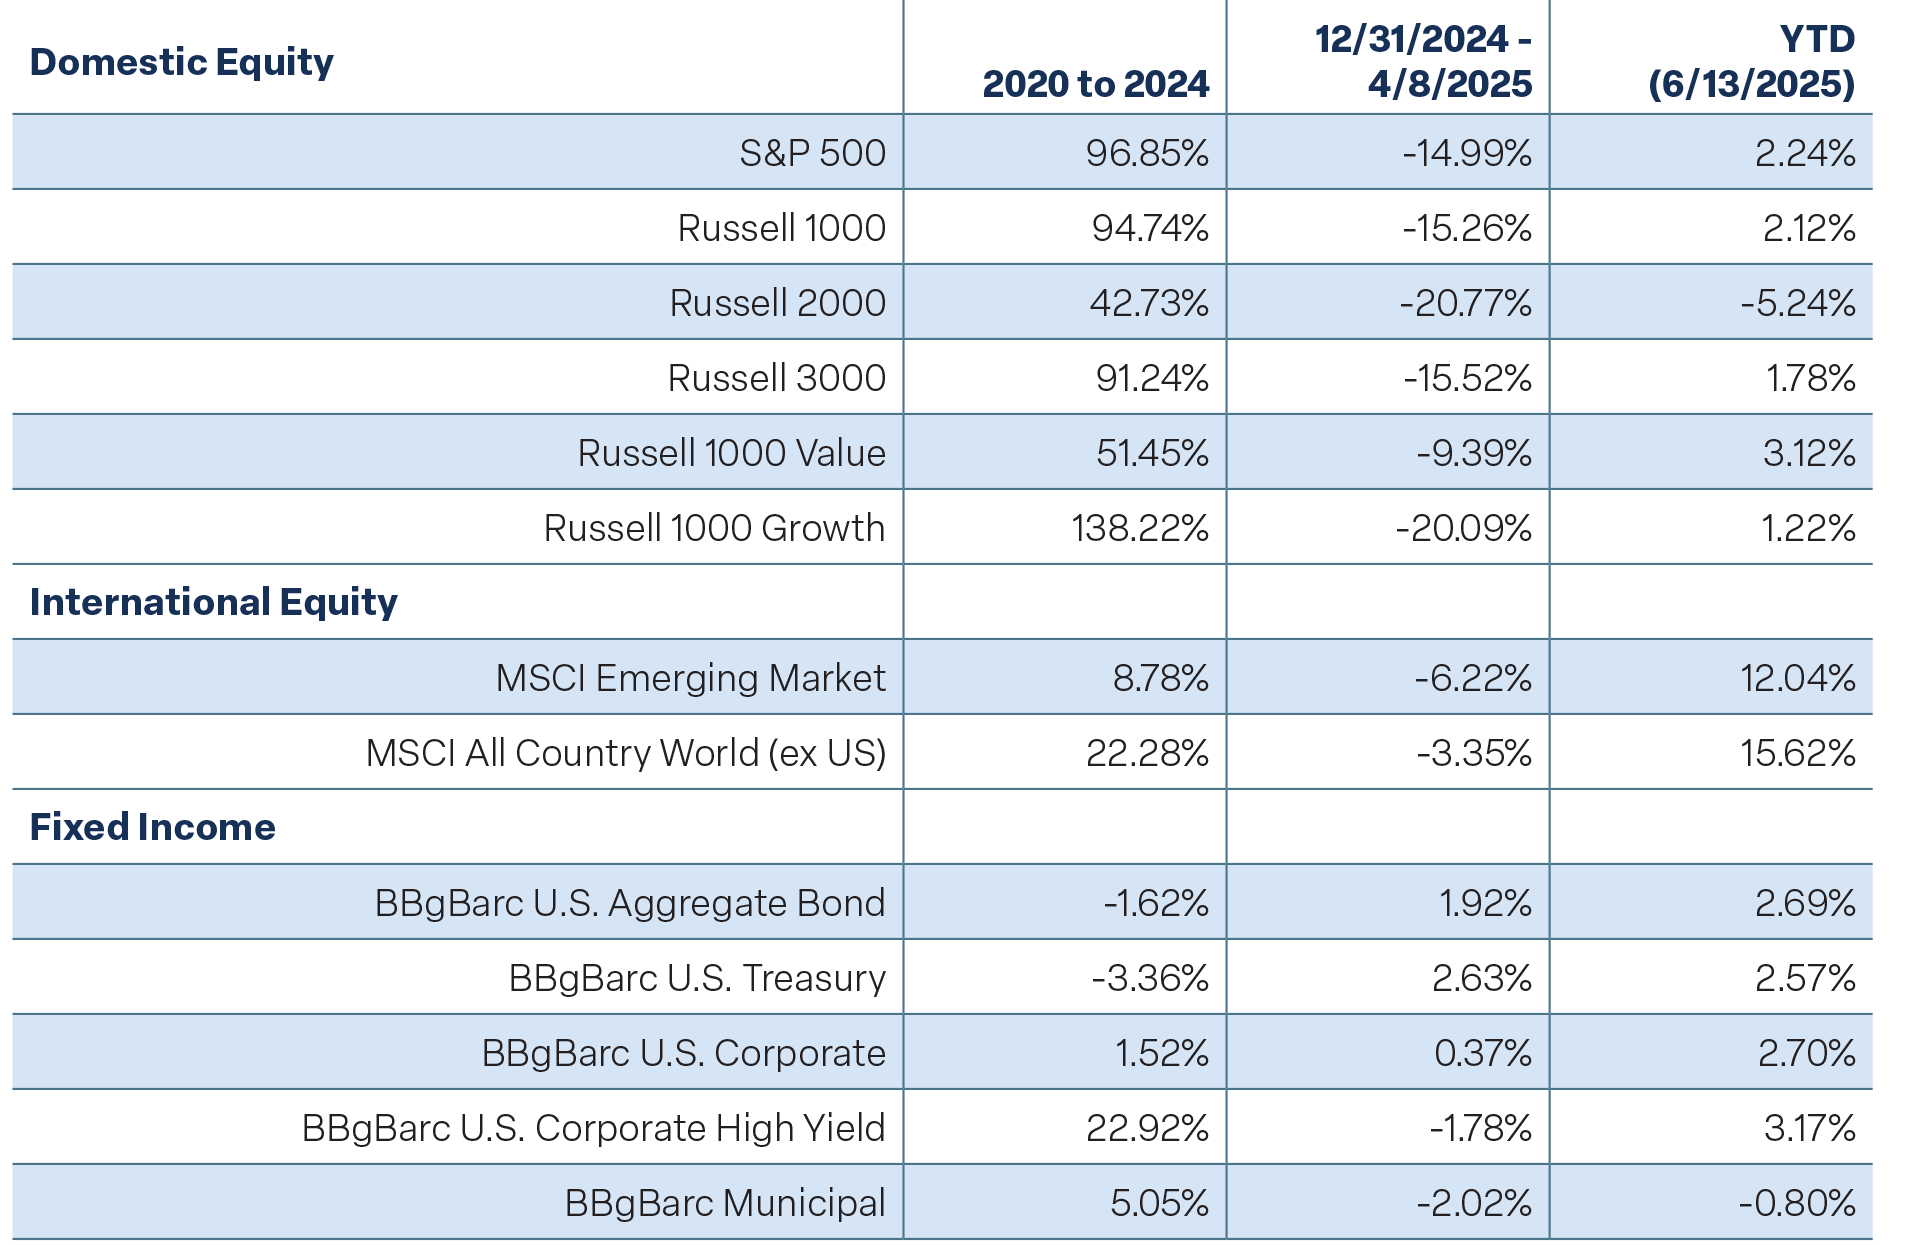
After 57 new all-time highs and no 10% correction in the S&P 500 last year, we expected volatility to increase in 2025. The tariff drama contributed to a bout of volatility that saw the S&P 500 decline 19% from its February 19 peak to a low on April 8. Since then, the market has staged a massive V-shaped recovery and is now trading near all-time highs again. Through the volatility we maintained our year-end target of 6700 on the S&P 500.
Risks to the outlook are many, including tariff and policy uncertainty, the valuation landscape, geopolitics (Russia/Ukraine, Middle East, China/Taiwan), and the U.S. government fiscal position.
Figure 1
Perspective
Past performance is not indicative of future results. This is not a recommendation to buy or sell a particular security. Please see disclosures at the end of this document.
Market Perspective: A Fall and a Rebound
The markets got off to a rocky start this year as enthusiasm around pro-growth Trump policies, tax cuts, and animal spirits quickly gave way to chaos around tariffs, DOGE, and the government fiscal position. The S&P 500 peaked on February 19, and the decline accelerated after the April 2 tariff announcement. The market reaction to the tariffs was swift with a two-day decline of 4.8% and 6% in the S&P 500. From the February 19 peak to April 8 low, the S&P 500 declined 18.9%, the Russell 2000 declined 22.8%, large-cap growth declined 23%, and large-cap value declined 14.8%.
The administration quickly reversed course and softened their tone one week after the initial tariff news, announcing a 90-day pause. The market surged, and the S&P 500 gained 9.5% on April 9. To date, the markets have regained most of the losses, and major U.S. stock indices are trading near new highs. International markets have outperformed the U.S. in the first half, a rare feat that has only happened three times over the past 15 years.
A Strong Economy
Over the past three and a half years, the U.S. economy has defied the recession expectations of many, remaining strong in the face of stress tests including surging inflation, the Fed’s aggressive tightening cycle, an oil price spike, and most recently Trump’s tariff turmoil. In our opinion, a big reason for the economy’s impressive resilience is that the labor market has remained strong. As we have said over the past few years, until we see weakness in the labor markets, recession calls will be premature.
The odds of a recession in 2025, according to Polymarkets.com, rose from around 20% in January and February to over 60% during March and April. Those odds have since fallen back to 27%. While growth has slowed, and soft economic data and surveys have urged caution, actual hard economic data has surpassed expectations.
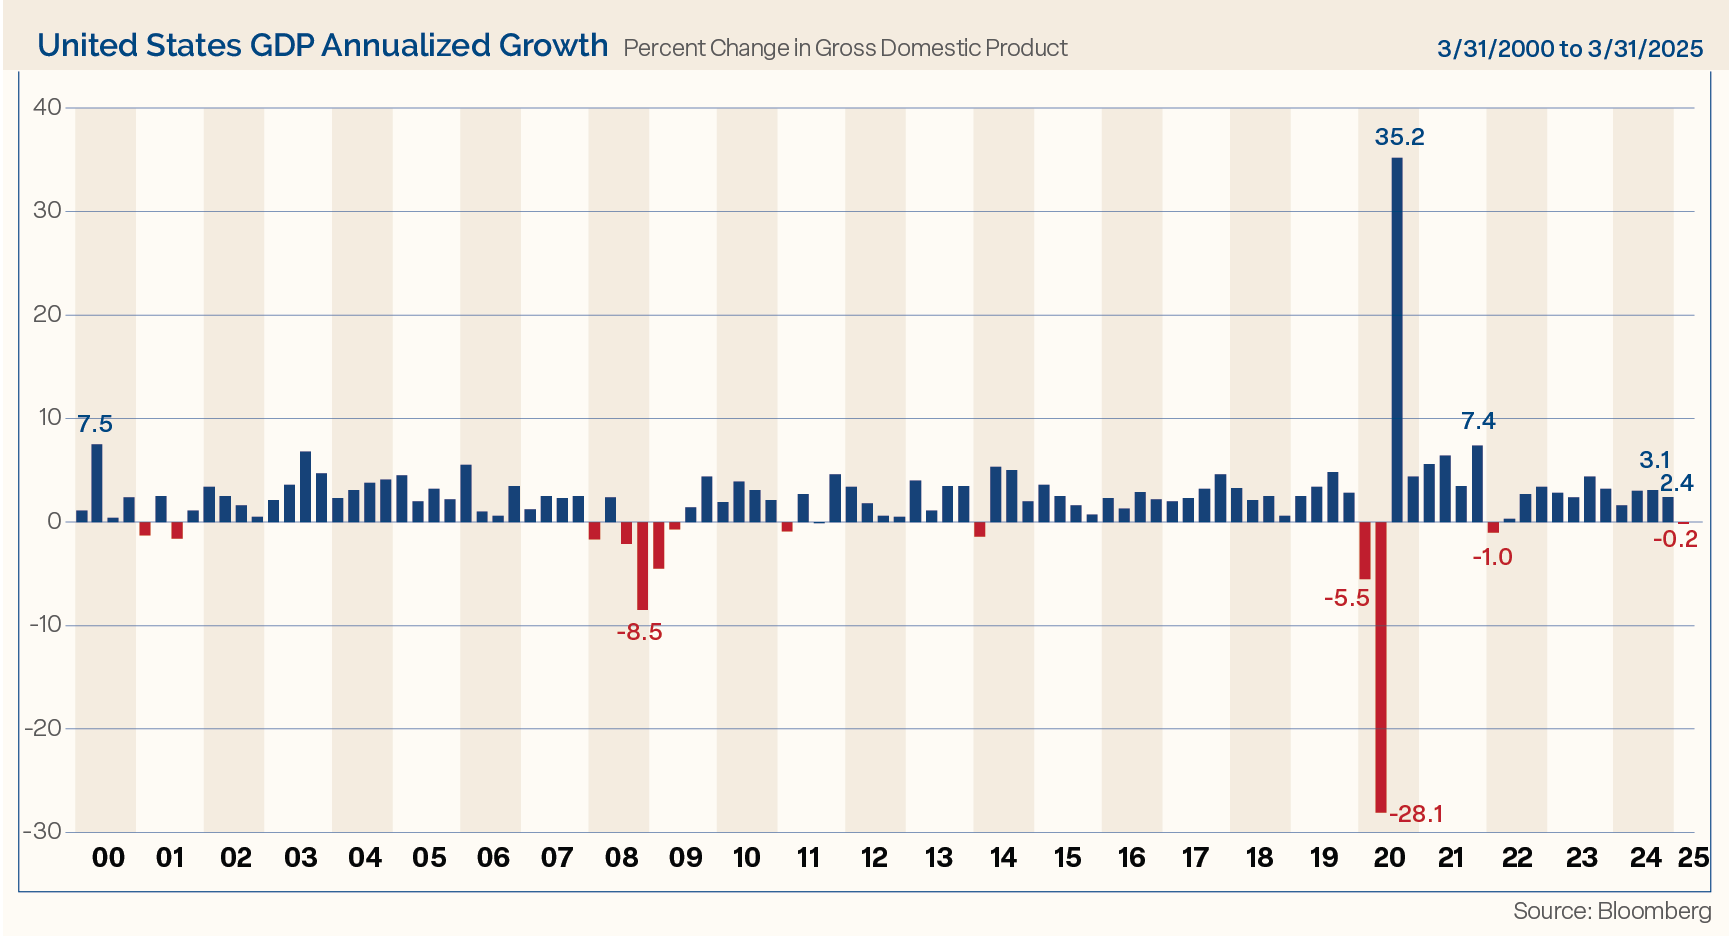
Q1 gross domestic product (GDP) declined slightly by 0.2%. (See Figure 2.) The negative number was driven by a massive surge in imports (41.3%) to get ahead of pending tariff increases. Trade subtracted 4.84% from GDP. Currently, the Atlanta Fed GDPNow is forecasting 3.8% growth for Q2 while the NY Fed Nowcast is 2.3%.
Figure 2
The labor market remains solid, though there are signs of moderation. The economy continues to add jobs, and the unemployment rate is holding steady at 4.2%. Nonfarm payrolls expanded by 139,000 in May. The average workweek was unchanged at 34.3 hours, while average hourly earnings picked up 0.4% from the prior month and 3.9% from a year ago. The year-over-year growth rate in hourly earnings has been near steady, suggesting that the labor market is not driving up inflation pressures.
So far this year, non-farm payrolls have been averaging monthly gains of 124,000. That compares to 168,000 on average last year. So, there is some loss of momentum on the jobs front, which is not too surprising given that companies are trying to balance macro headwinds facing the economy
with the tariff uncertainty, DOGE cuts that have hit the Federal government job rolls, and a crackdown on immigration.
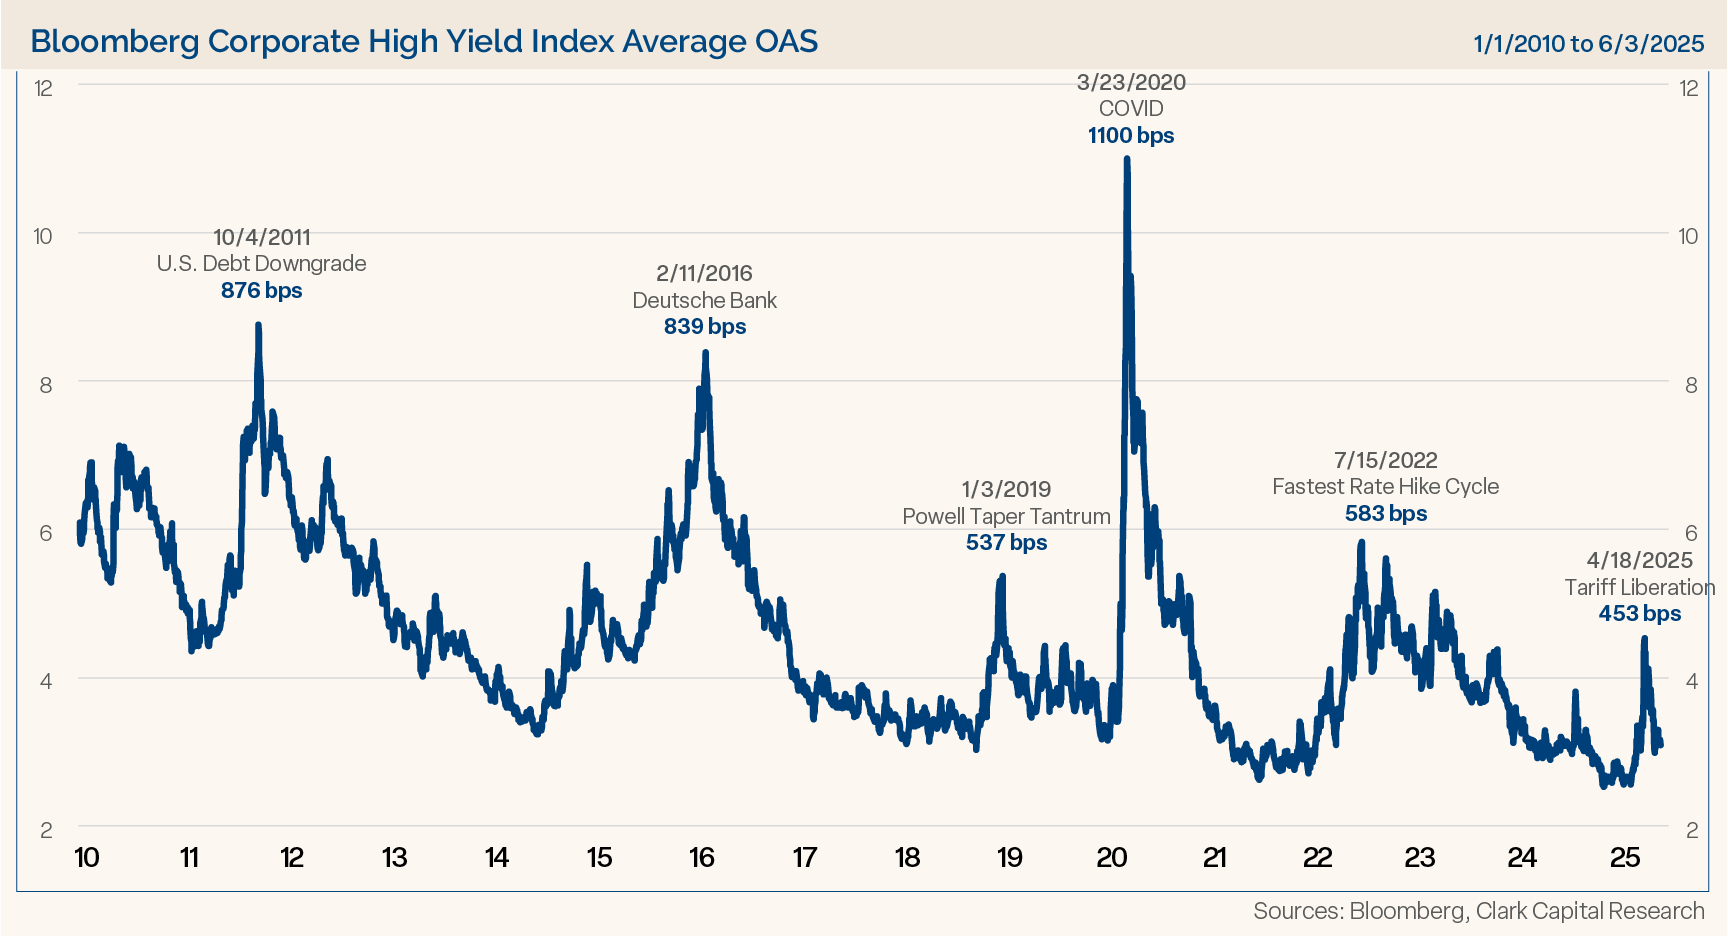
Turning to credit markets, high yield bond indices were very firm prior to “Tariff Liberation Day,” indicating a lack of stress in the economy. However, the April 2 tariff announcement was a lot worse than was previously messaged. As a result, risk assets sold off sharply. Credit spreads normally widen out considerably in advance of economic stress. However, looking at credit spreads, after a brief bump from the tariff drama, spreads have again retraced much of their advance. This indicates there is little evidence of stress in the economy compared to the stress that spreads showed in previous spikes such as the 2011 Debt Downgrade, 2016 Deutsche Bank troubles, the Powell Taper Tantrum, COVID, and the fast rate hike cycle in 2022. (See Figure 3.)
Figure 3
Recently, broad high yield bond indices and CCC-rated debt have traded at new all-time highs, signaling relative calm in the credit markets. This is consistent with our expectations for continued economic growth. Even so, we are downgrading
our forecast for economic growth this year from 2.5% to 1.5% given the uncertainties around tariffs and government fiscal policies.
Inflation and Fed Policy: A Waiting Game
As shown in Figure 4, inflation has come down from peak levels, hovering in the mid 2% range across CPI, PPI, and Core PCE. CPI is higher by 2.4% and PPI is up 2.6% year over year. Each of the past four monthly CPI reports have been lower than consensus expectations.
Figure 4
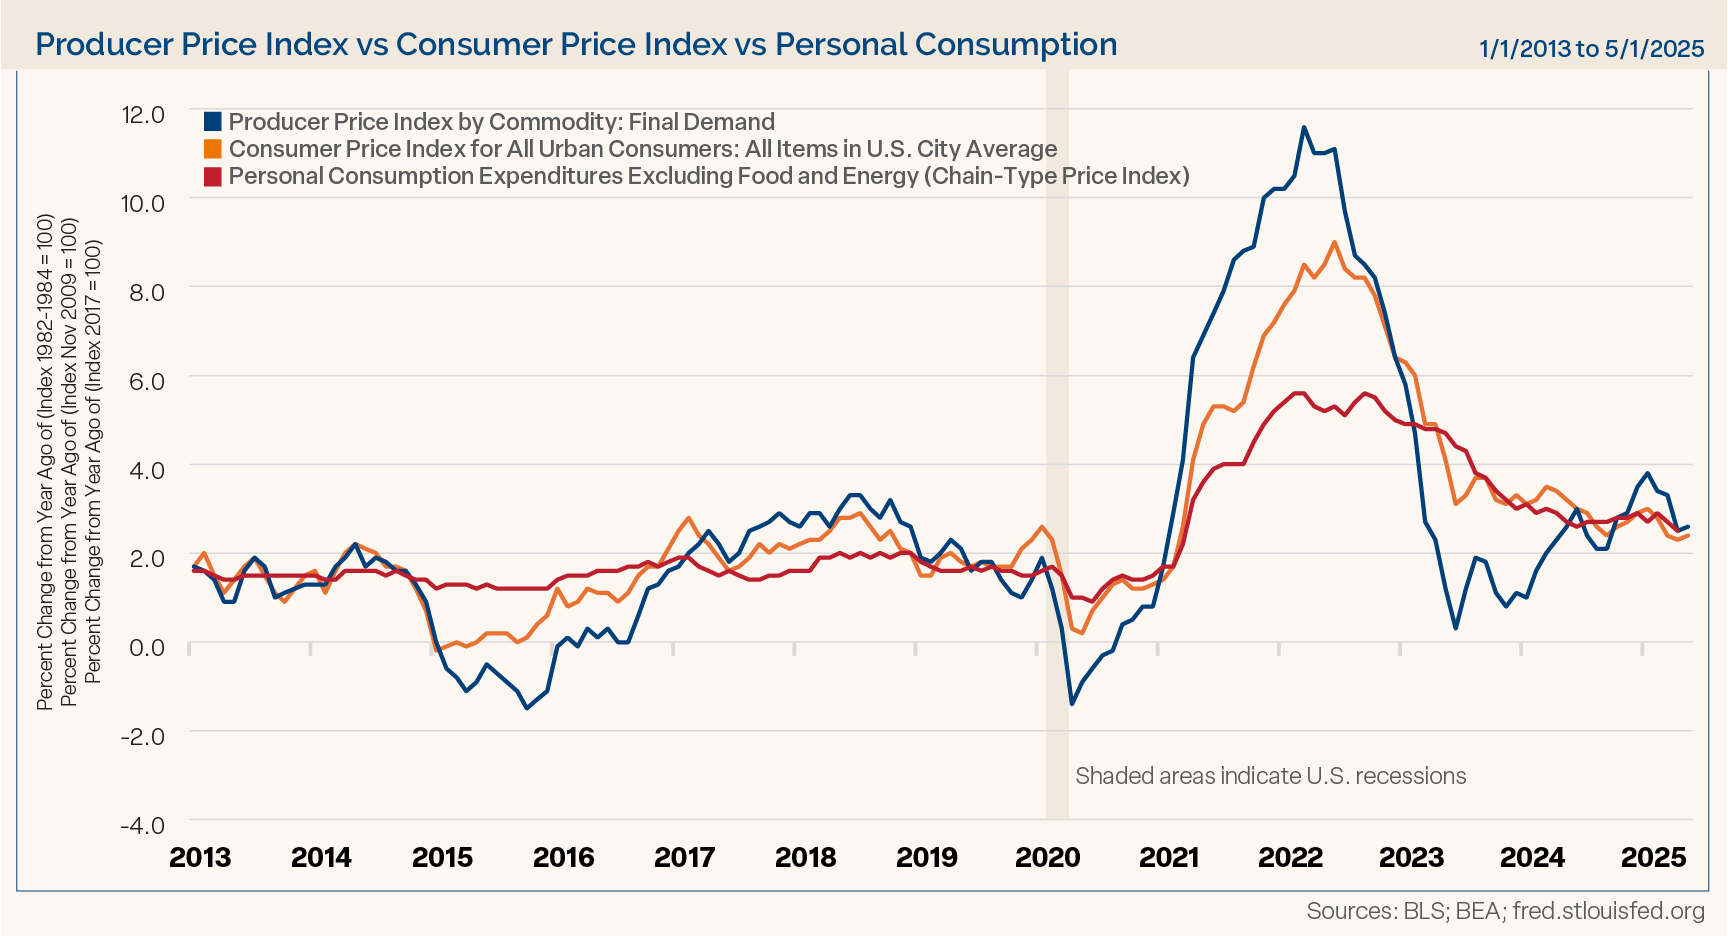
In our 2025 Outlook, we said, “We do not believe inflation is set to reaccelerate higher as many fear as four of the key drivers of the inflation surge the past couple of years continue to moderate. For example, housing, auto insurance, and used car prices are softening, and labor markets are not showing an inflationary impulse.”
So far, the expected boost in inflation from tariffs has been a no show. We are in wait-and-see mode as we expect tariffs to have an impact. Recent analysis from Goldman Sachs indicates an eventual 14 percentage point increase in the effective tariff rate. Based on that assumption, they expect core PCE inflation to rebound to a peak of 3.4%, GDP growth to slow by roughly one percentage point from the tariff increase (matching our revised estimate for slower GDP), and the unemployment rate to rise 0.2 percentage points to 4.4%.
Inflation ex-shelter has also continued to decelerate, rising just 1.4% year over year, and it is set to continue moderating. According to Redfin, the U.S. housing market has nearly 500,000 more sellers than buyers, the most on record. That will likely keep a lid on home prices and exert downward pressure. That is important because housing has represented 55% of all inflation since 2019, and housing plus auto services has accounted for 76% of all the inflation.
The inflation statistics are likely neither comforting nor worrying for the Fed, as inflation remains above the Fed’s 2% target. The potential tariff impact remains uncertain. Much of what we have seen in markets is a repricing of tail-risk. Tariffs increase the upside risks to inflation and the downside risks to growth. Removing tariffs narrows the risks to some degree. Given that the economy is still growing and the labor market has softened but has not broken, the Fed can afford to wait on more data. The Fed held rates steady at June’s FOMC meeting, and we expect the same at July’s meeting. The Fed could move to cut rates again at the September meeting, following their long-term policy review and Powell’s Jackson Hole speech.
The Fed will need to see additional signs of labor market weakness before cutting rates. That means that the FOMC will be late in reacting to the data but will catch up quickly if needed.
Cyclical Data Points to Positive Performance
The Ned Davis Research (NDR) Cycle Composite is a market trend tool developed by Ned Davis Research, a well-respected institutional research firm. It is primarily used to help us understand potential turning points in the stock market by combining multiple historical cycles into a single composite indicator. It combines the one-year cycle, four-year cycle (election years), and decennial cycle into a single composite.
In our Outlook for 2024 we said, “The composite suggests a choppy/sideways market into the summer, which would buy the market time to consolidate its large gains from 2023, then a strong rally in the second half of the year.” While that script mostly played out, the market was stronger than the composite suggested early in the year, modestly corrected in the summer, and finished the second half of 2024 strong.
The Cycle Composite for 2025 (Figure 5) painted a bullish picture for the year. It suggested a choppy Q1, and we got a little more than choppy with a fast 19% decline, but the market is tracking higher along with the composite.
Figure 5
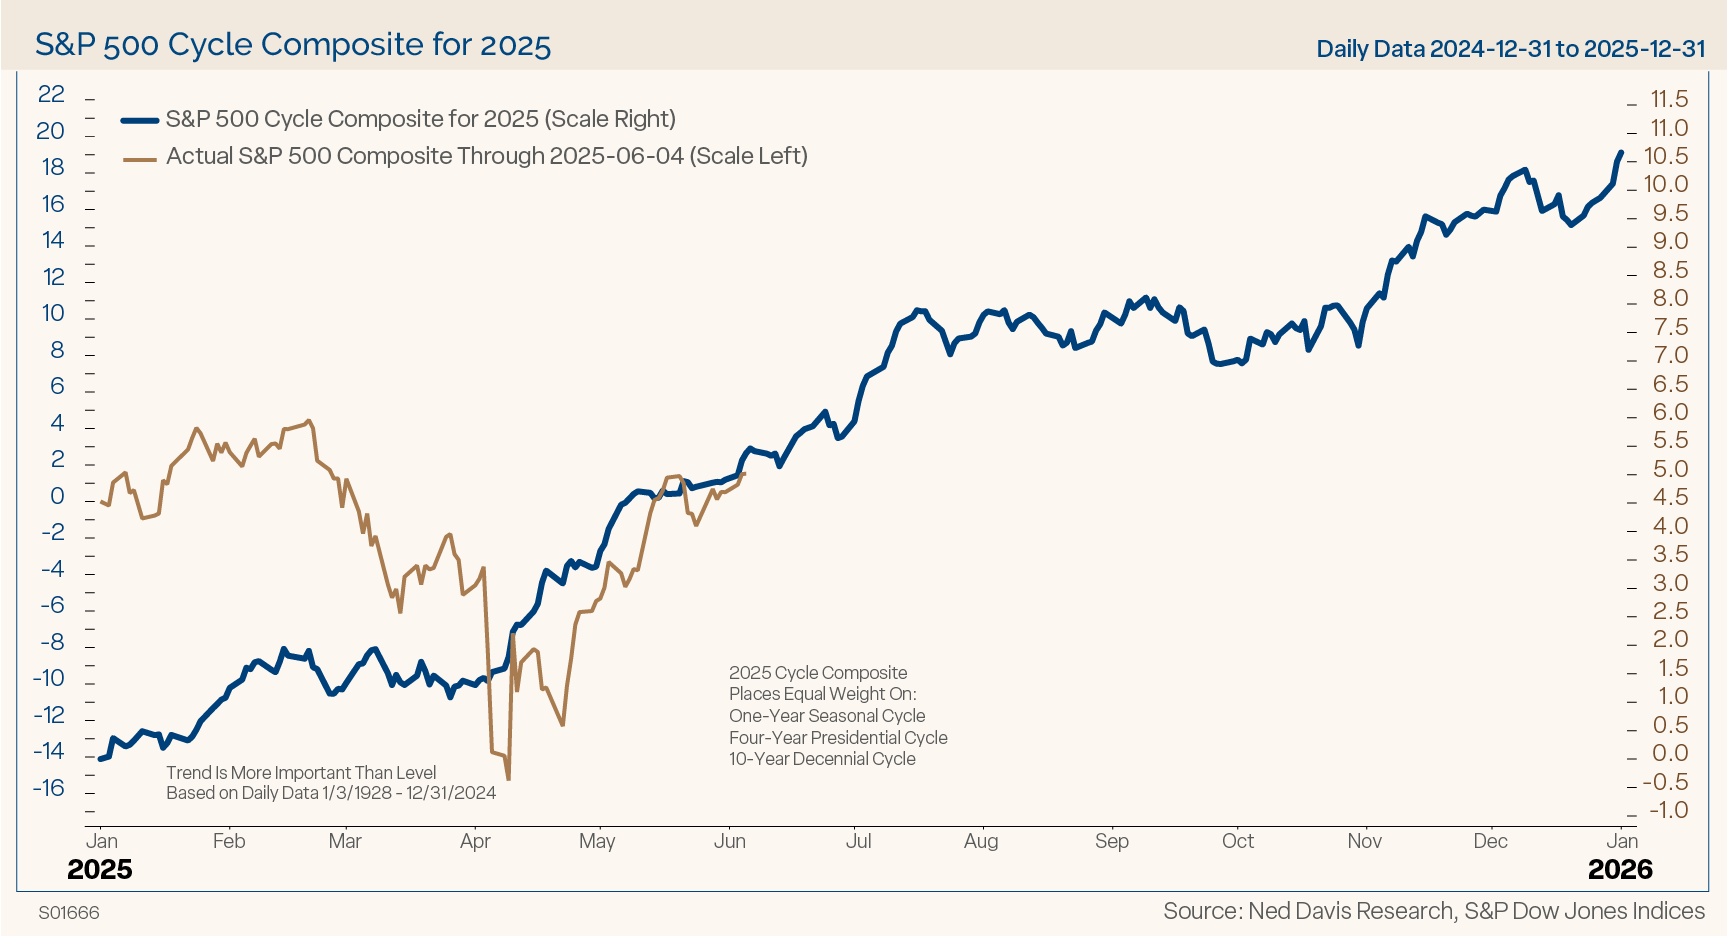
It shows a strong first half, the potential for a third quarter pullback, and a year-end rally. That seems like a pretty good roadmap. We suspect the market can work higher given still pessimistic investor sentiment, several breadth thrust signals coming off the April lows, and strong credit conditions. Much of how the market behaves in the second half of the year will likely depend on the direction of tariff negotiations. Are we past peak chaos or in the eye of the storm? The next several weeks will be key as the first 90-day pause is set to last until July 9, and the pause with China is set to expire on August 12.
Performance Through the Political Cycle
Historical performance for the market during the first year of a presidential administration has been positive. (See Figure 6.) The post WWII median gain for the S&P 500 in the first year of a president’s term has been 9.1% in terms of simple price appreciation.
Figure 6
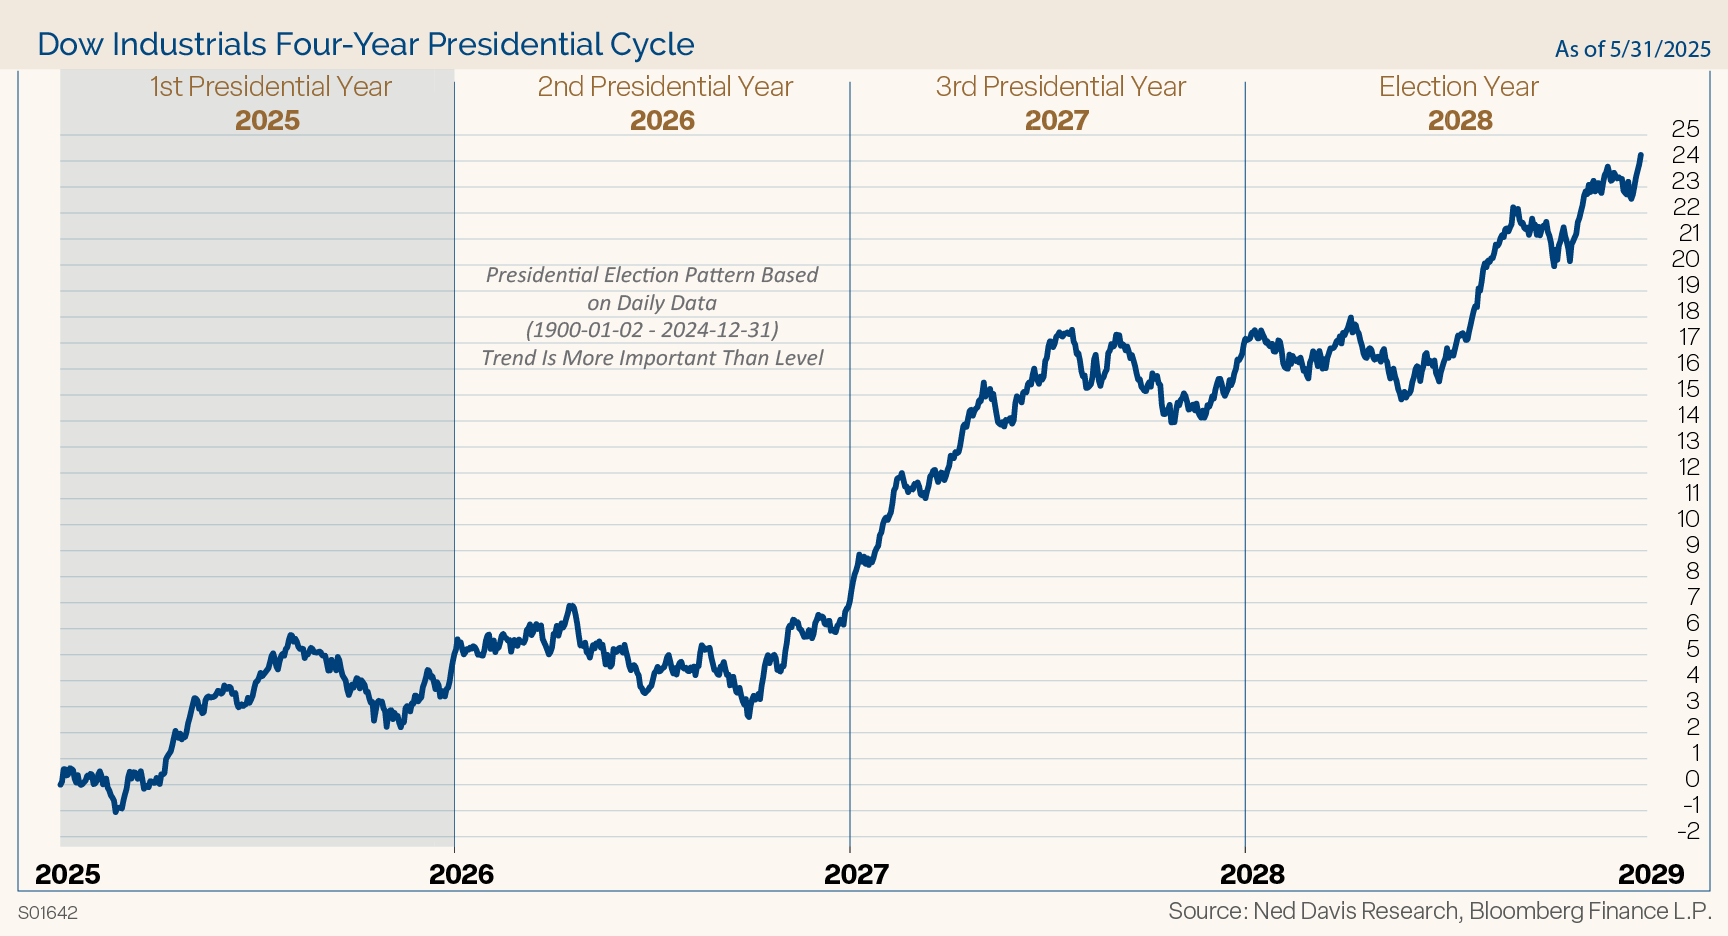
Looking out to the end of the first year shows there is historically a broad period of consolidation into a mid-term election year low. One reason is that monetary and fiscal policy tends to be restrictive from late in the post-election year until the mid-term elections. We will soon see if that is the case this time. Depending on the passage of the Big Beautiful Bill currently being negotiated in Congress, and potential for rate cuts late this year and next year, fiscal and monetary policy may be more stimulative than normal.
Next year is a mid-term election year, and it could be a volatile year, if history is any guide. All 435 House of Representative and 35 Senate seats will be up for election.
History shows that the market has endured a 21% correction on average into the mid-term election year lows. The silver lining is that the market has also historically rebounded very strongly from those mid-term lows. The average gain from the mid-term low to the high point in the following year is 47%. Naturally, the years accompanied by a recession have had steeper declines, 31% on average, than those with continued economic growth, 17% on average.
Markets Are Cyclical, Corrections Are Normal
We always remind advisors and investors that markets are cyclical, and corrections are normal. We have market data since 1928 that indicates the frequency of market declines. On average the S&P 500 has experienced three 5% corrections a year, a 10% decline once a year, a 15% decline every two years, and a 20% or greater bear market every
three years.
Last year, we had two corrections greater than 5%, and no 10% or greater correction. After 57 new all-time record highs in 2024, and no real correction, we expected the markets to become more cyclical with normal corrections in 2025.
We certainly got that correction with the Trump tariff drama, as the tariffs announced on April 2 were much worse than what was messaged. Risk assets sold off sharply, and the S&P 500 declined 19%.
High Volatility and Bearish Investor Sentiment
Volatility spiked in April with the VIX Index hitting panic levels. (See Figure 7.) It did not take long for the administration to reverse course and pause the tariffs. Risk assets formed a V-shaped bottom and have surged higher since the April 8 lows.
Figure 7
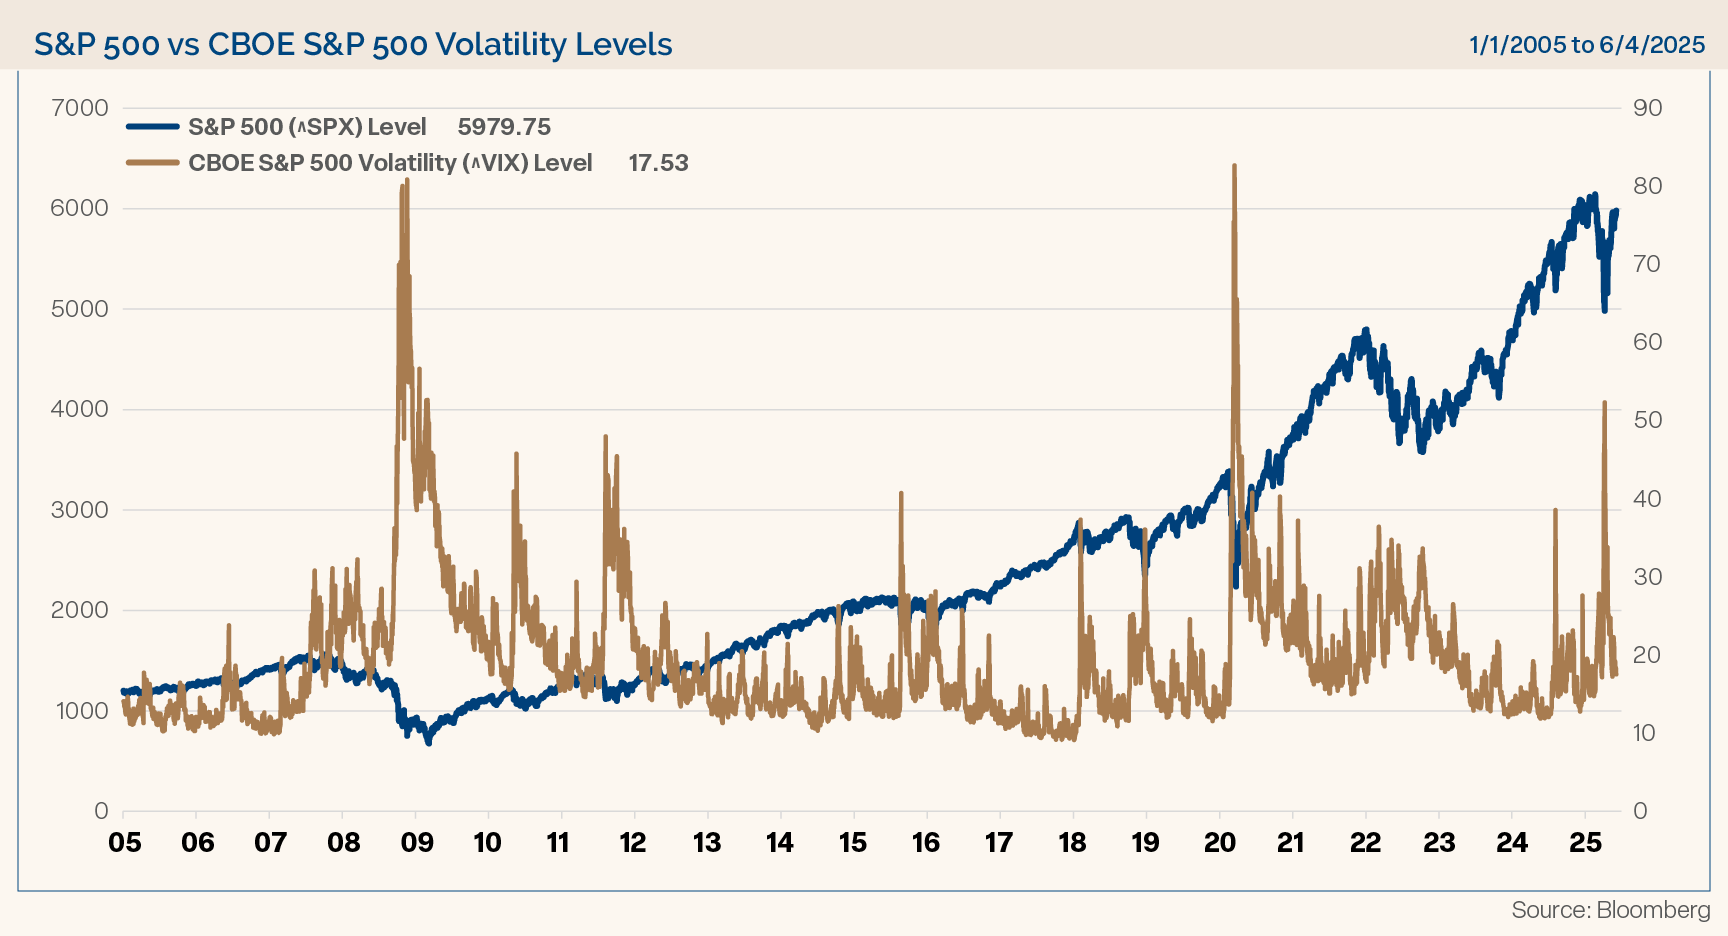
Sentiment reached extraordinarily pessimistic levels during the tariff declines, and investors have been slow to turn bullish, which from a contrarian standpoint, has bullish implications.
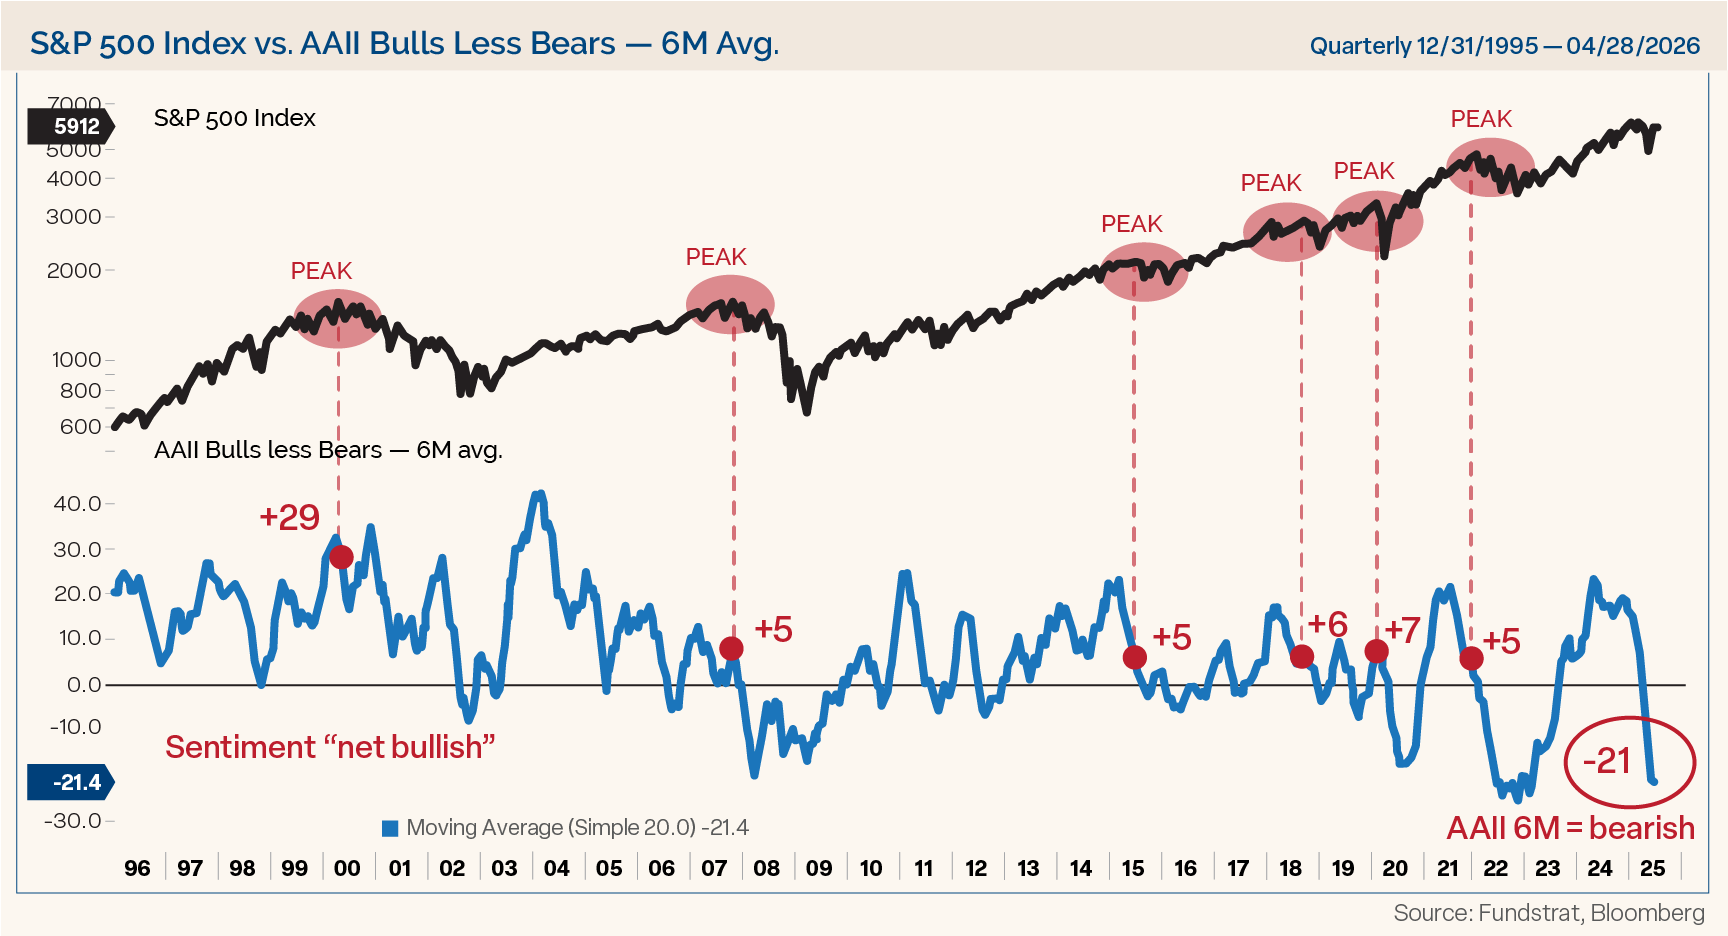
For the stock market, fundamentals matter over the long run, however, in the short run, sentiment is an important driving factor. The American Association of Individual Investors (AAII) sentiment poll and other measures of investor behavior, showed a long stretch of excessive pessimism as politics, tariffs, and debt concerns weighed on sentiment. For example, AAII showed more than 50% of investors were bearish for a record long streak of 11-weeks, from February to May. In April, 61.69% of investors were bearish, the only other time they were more bearish was in March 2009, just before the Global Financial Crisis lows.
Another way to look at sentiment is to compare the percentage of bullish investors to bearish investors over time. Figure 8 shows the six-month average of bulls to bears, and it recently averaged 21% more bears than bulls. Markets peak when sentiment is overly bullish, not bearish like it is now. It feels like this is one of the most hated bull markets in recent memory, and there is no shortage of concerns for the market to climb the wall of worry.
Figure 8
Thrust Indicators Look Positive
On a short- to intermediate-term basis, the “Trump tariff tantrum” certainly caused a severe oversold condition, which acted like a springboard from which the market has catapulted higher. The ensuing advance has been extremely strong and triggered several breadth thrust signals that normally portend strong gains to follow. For example, off its lows, the S&P 500 capped three straight 1.5% or greater days on April 24. As shown in Figure 9, that has happened only 14 other times since 1970, and the median gain one year later in those examples has been 21.7%.
Figure 9
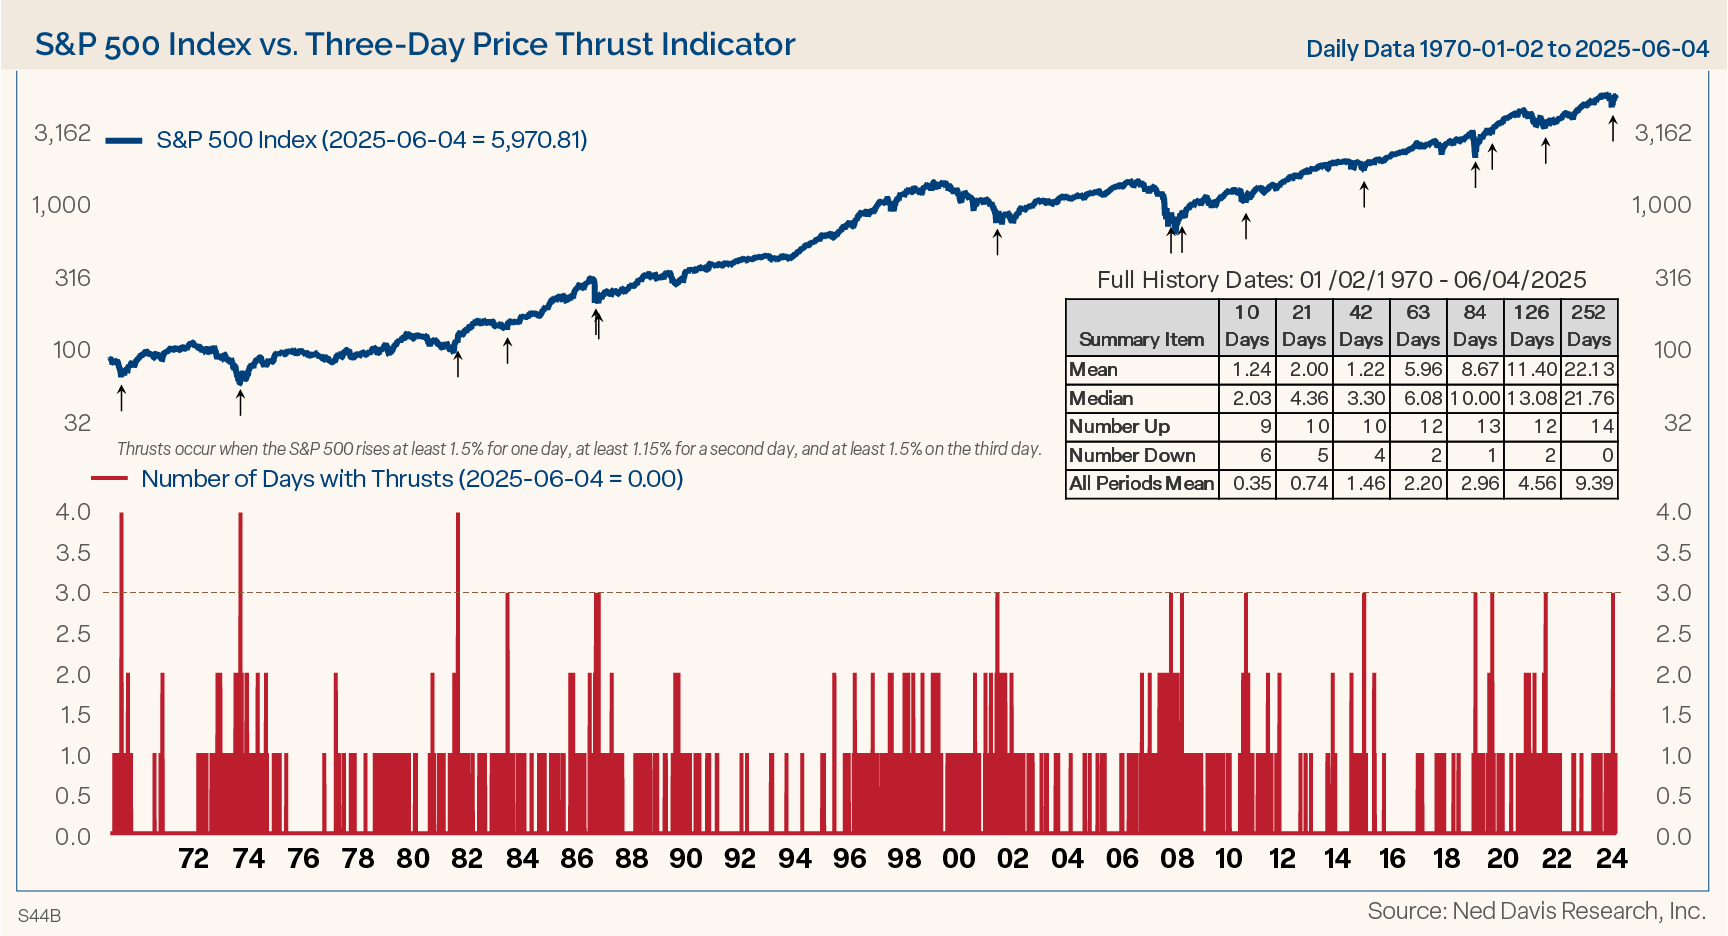
In addition, the DeGraaf Thrust Indicator gave a bullish indication on May 12 when 55% or more of the S&P 500 constituents hit new 20-day highs at the same time. The median gain one-year after the DeGraaf signal fires is 15.9%.
Of the several breadth thrust indicators that we follow — including the three-day price surge, the DeGraaf indicator, the Zweig Thrust indicator, and 10-day advances versus declines — the median average gain one-year later has been 17.5% with a 96% hit rate.
Market Scorecard After Historic Rallies
During the market decline from the mid-February highs through the “Tariff Liberation Day” lows, the S&P 500 never quite made it into bear market territory. But from the April 8 low, the index rallied just over 20% in less than two months, marking it one of the strongest rallies off a 50-day low on record.
Figure 10 shows every time the S&P 500 rallied 20% from a 50-trading-day low in two months or less. Before the current rally, the most recent surge of this magnitude was coming off the Covid lows in 2020, and before that, the Global Financial Crisis lows.
Figure 10
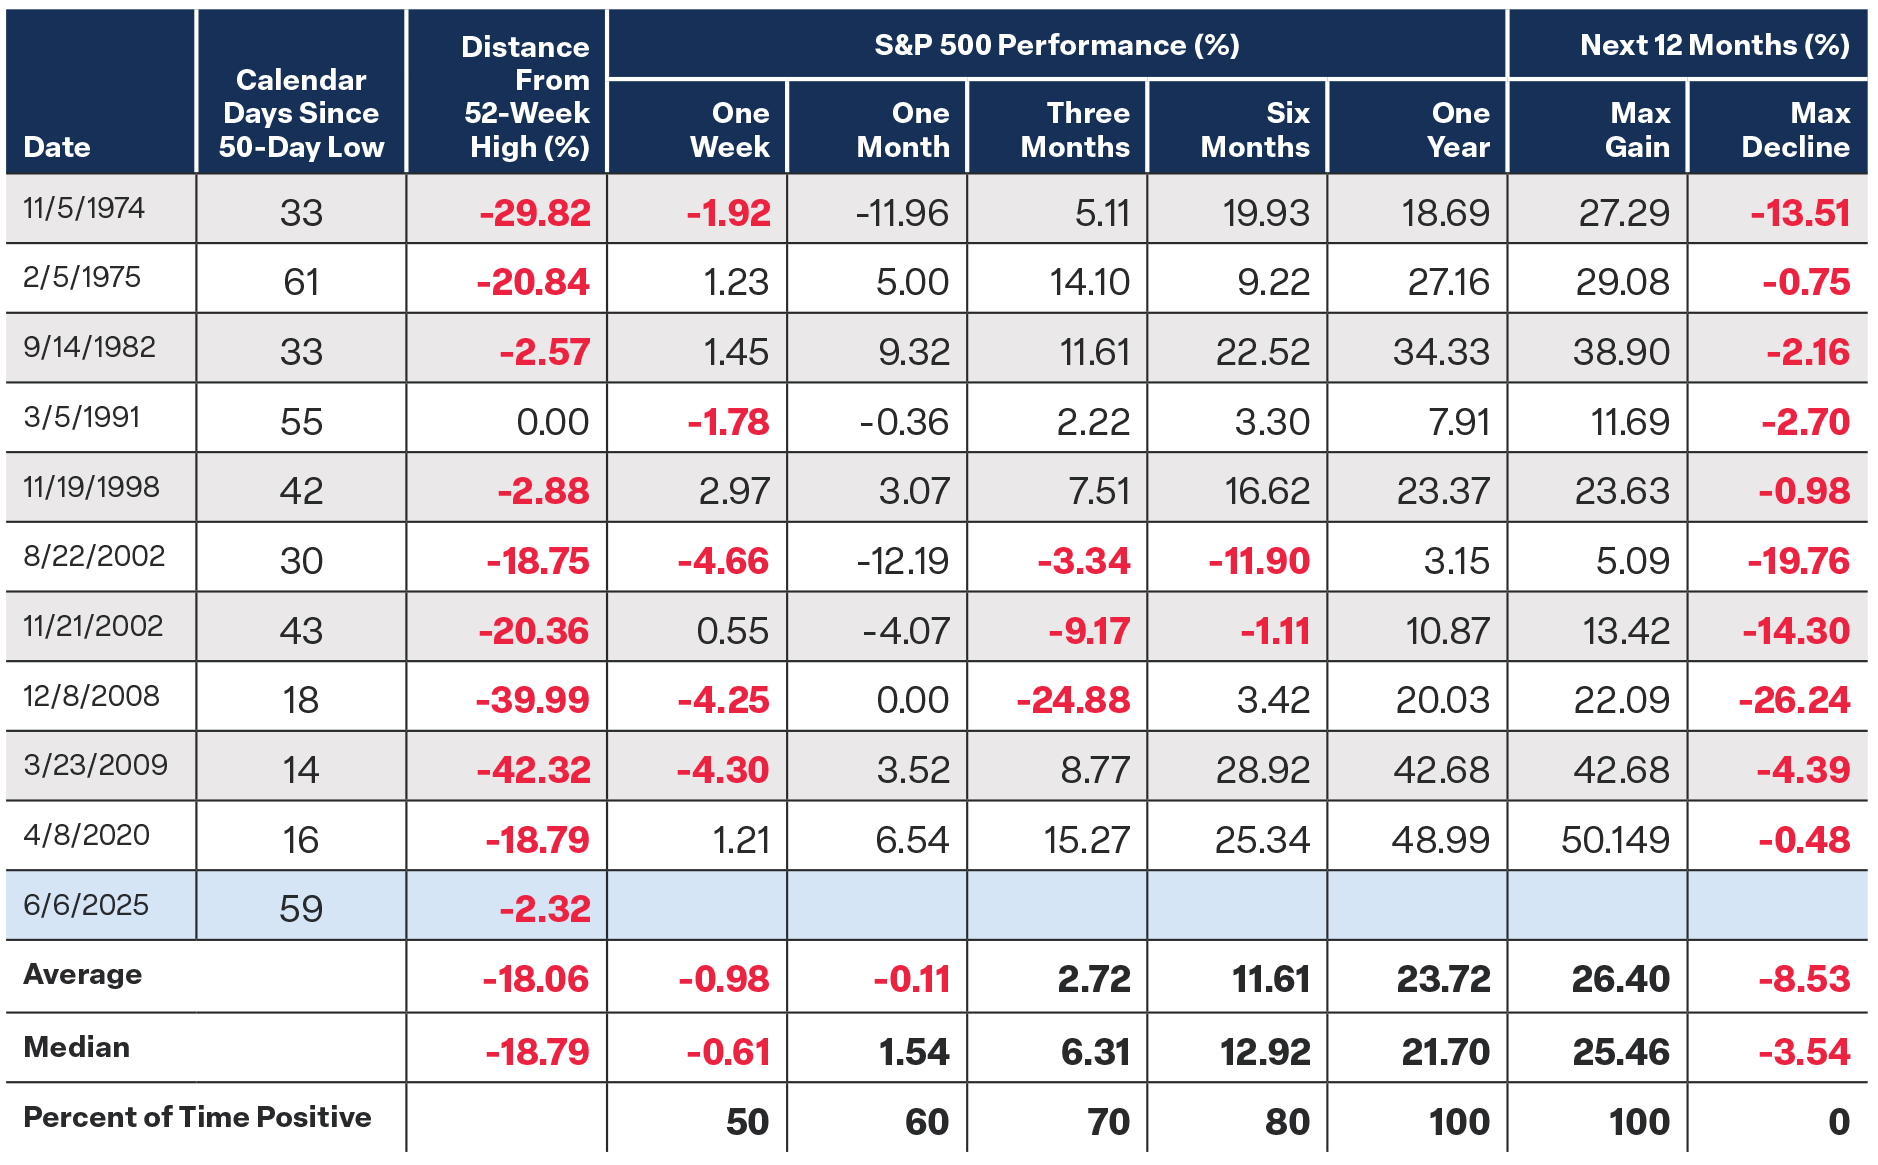
Past performance is not indicative of future results. This is not a recommendation to buy or sell a particular security.
Manufacturing Index Showing Contraction
The ISM Manufacturing Index has been in the contraction zone below 50 for 29 of the past 31 months (since November 2022), the longest stretch of time it has been in contraction since its inception. It is rare to be in contraction for more than a couple of quarters. Even during the Global Financial Crisis, it was only in contraction for 16 months. ISM below 50 is more consistent with “early cycle” economic and market trends. The market historically performs well from the depth of the manufacturing sector’s contraction until it is well into expansion.
Valuations
In general, the market is expensive for large caps, and much cheaper for mid- and small-cap stocks. We can see that the recent decline reset valuations lower across the board. (See Figure 11.)
Figure 11
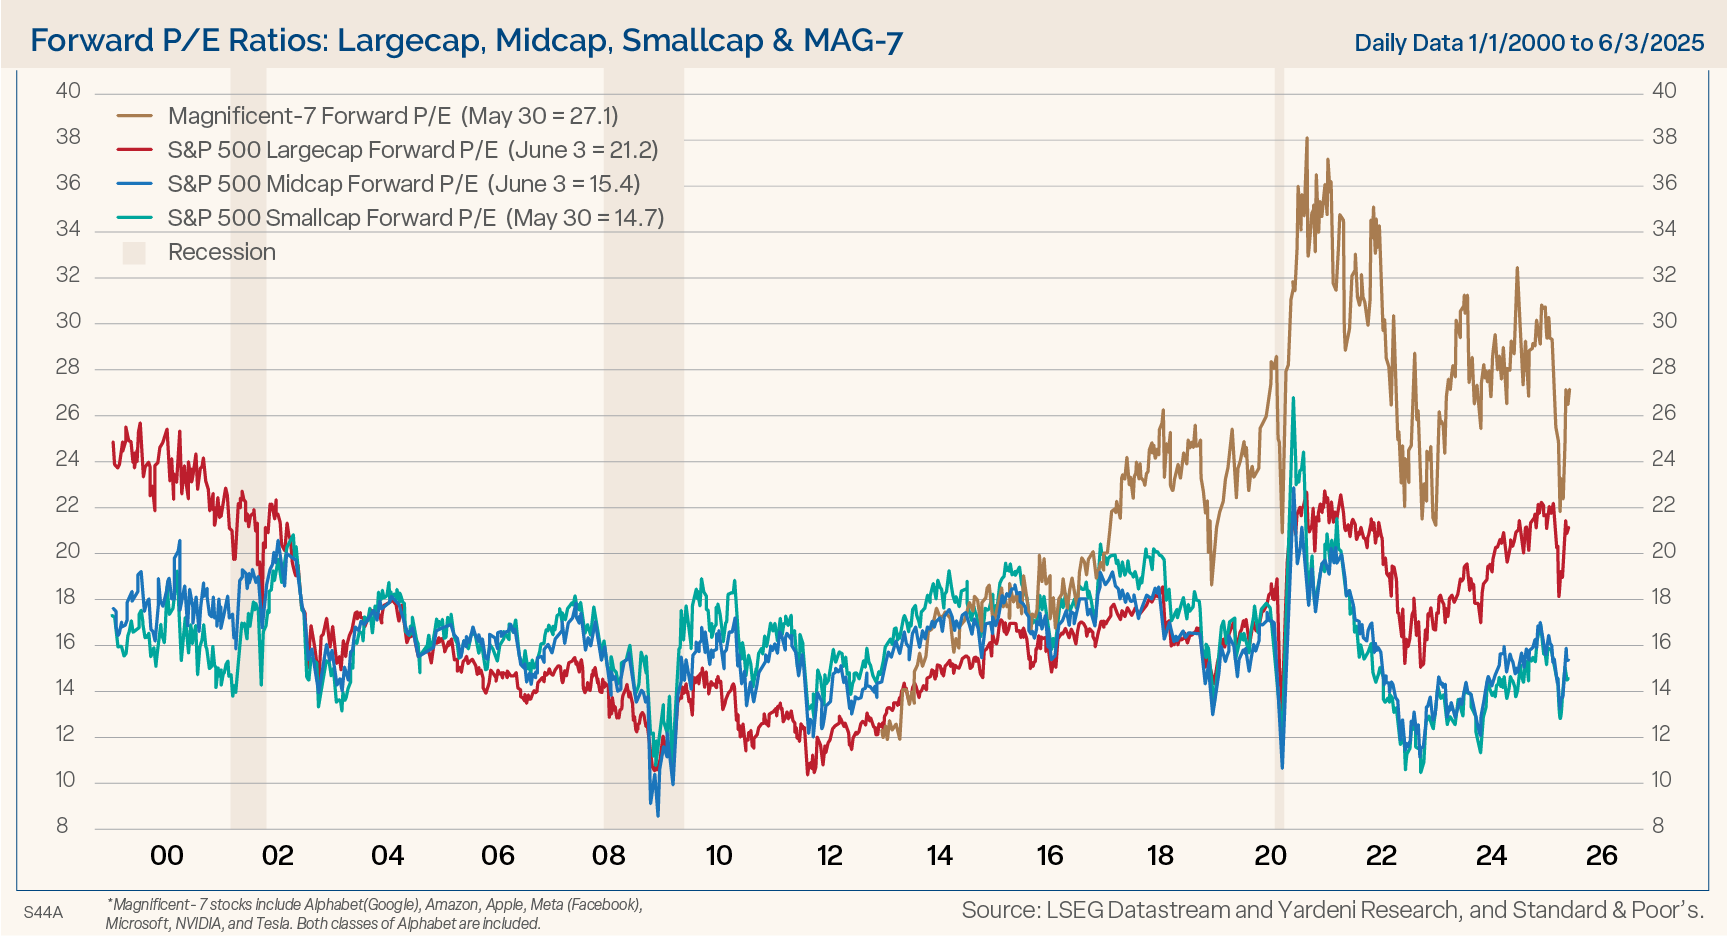
The forward P/E of the Magnificent Seven stocks plunged about 10 percentage points since the end of last year from roughly 32 to 22, before the sharp rebound in stocks lifted the multiple back up to 27.9 times forward earnings. The same can be seen for the S&P 500, mid cap and small cap valuations measures. We started the year with an S&P 500 forward P/E of 22, it slipped to 18 during the selloff, and it is currently back to 21.2. We have pretty much round tripped multiples, and they are back near where they were to start the year.
Coming into the year we said, “High stock valuations are the main worry for many investors. However, our bullish outlook for strong productivity-led economic growth means that earnings rather than valuations can lead the market higher.”
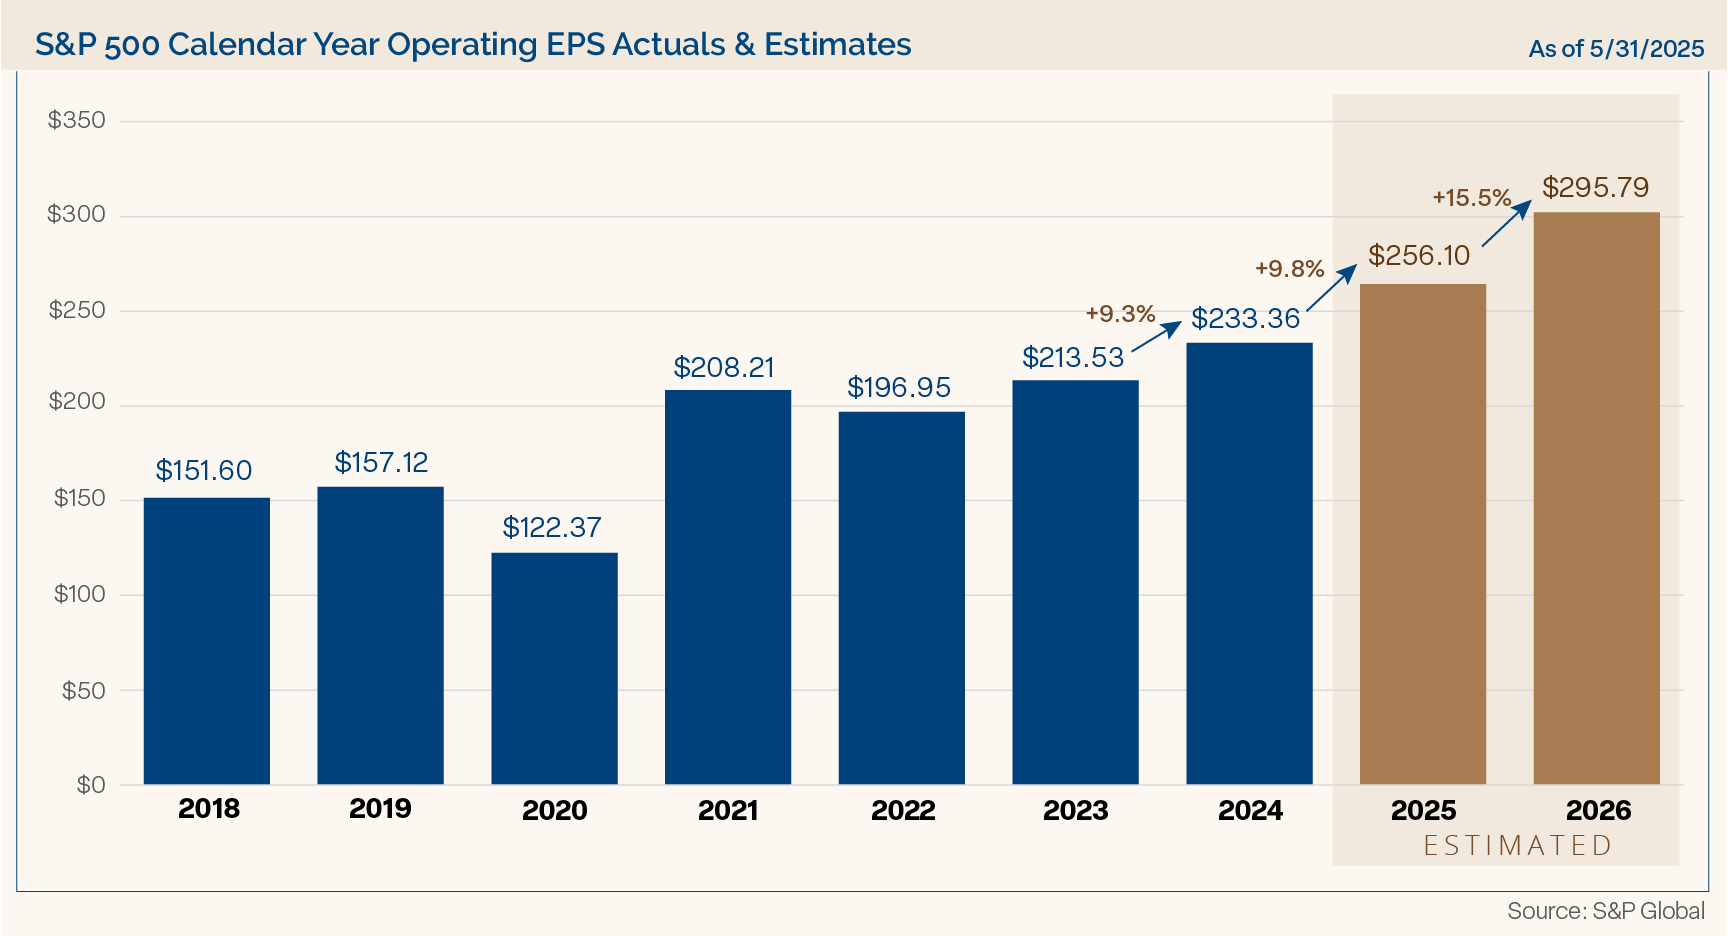
Bottom-up earnings estimates for calendar year 2026 called for $310 per share for the S&P 500. Earnings are still expected to move to new highs, but analysts have reduced their estimates and now see $296 per share in 2026. (See Figure 12.)
Figure 12
Our year-end target for the S&P was 6700 based on earnings growth, a slight forward P/E compression, bullish historical trends from the first year of a President’s term, and strong years following back-to-back 20% total return years. There is downside risk to our 6700 target given the uncertainty of policy, but we are still bullish for the second half of the year given pessimistic investor sentiment, the Cycle Composite, the history of gains following breadth thrust signals, and the precedence of follow-through from the quickest 20% rallies.
Taxes and Government Spending
Let’s turn to two risk factors that we are monitoring closely: the federal debt and deficits. The federal government is running deficits of over 6% of GDP. In the post WWII era, government spending averaged 20.7% of GDP, it is currently running at 24% of GDP, near the highest levels of spending other than during the COVID pandemic. Meanwhile, taxes as a % of GDP have averaged 17.6% of GDP, and are currently running at 17.8% of GDP.
In our Annual Outlook we said it’s doubtful that DOGE will be able to trim the size of spending meaningfully enough to make a dent in the deficit, and, as it turns out, the savings have fallen short of expectations.
As a result of growing debt and deficits, bond vigilantes have pushed Treasury yields higher at the long end of the curve. (See Figure 13.)
Figure 13
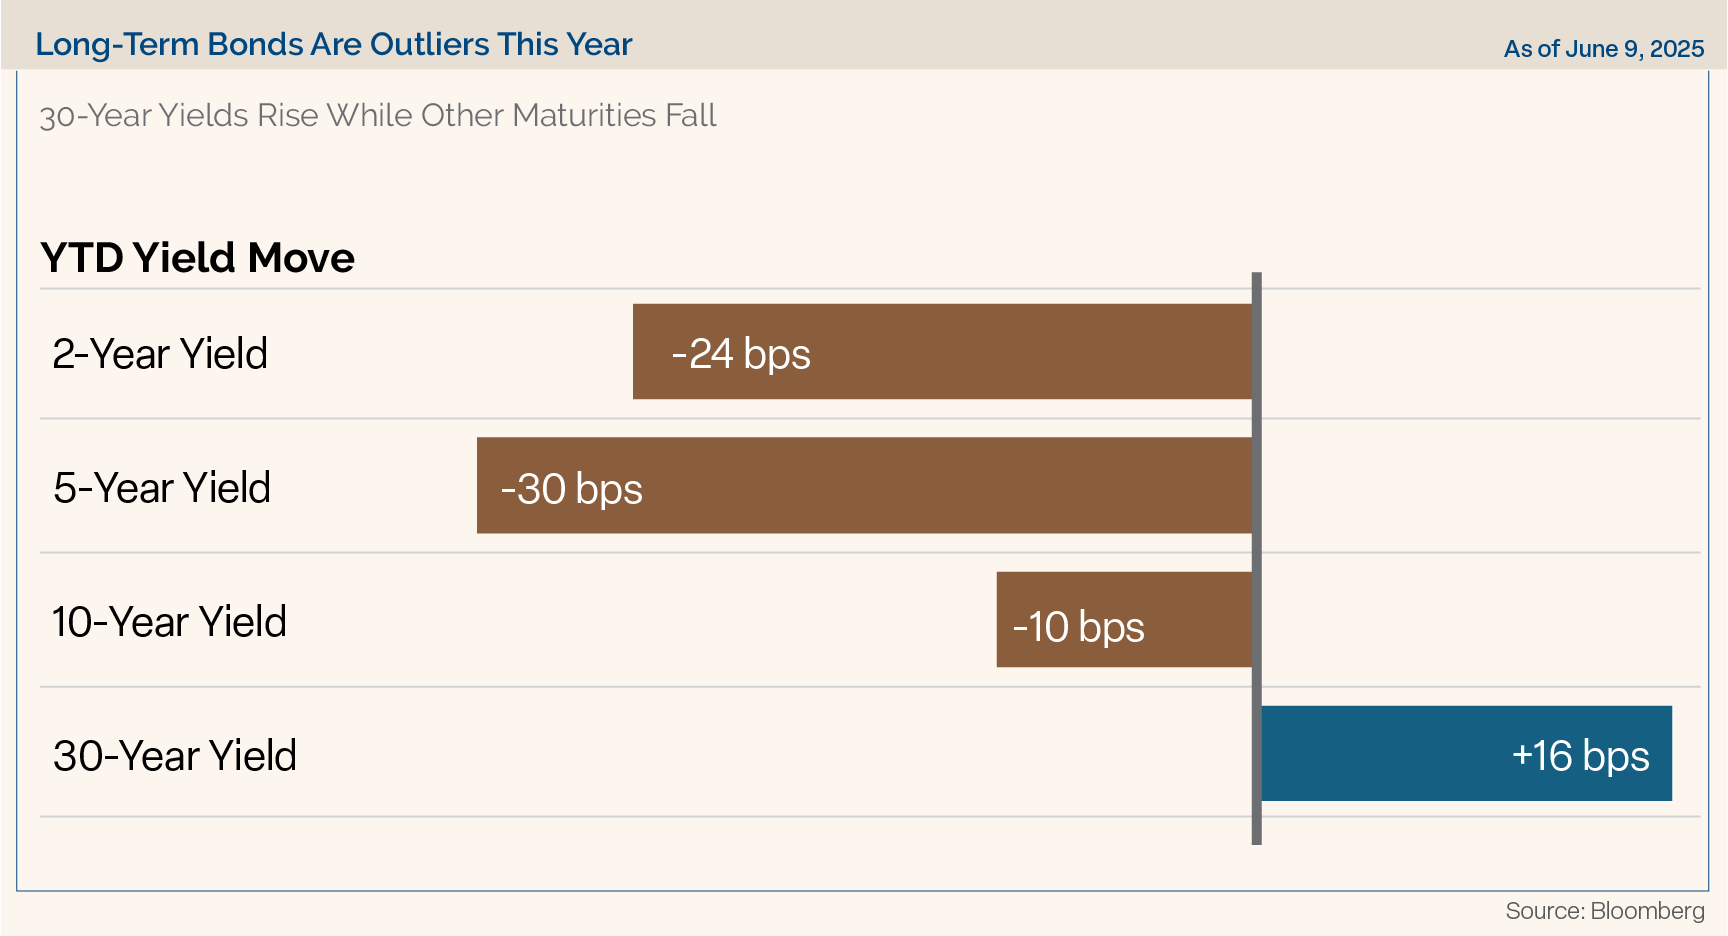
Investors are demanding higher yields to compensate for the growing fiscal risks. That has played out this year as shorter maturity tenors have seen yields decline while only the 30-year Treasury yield has moved higher.
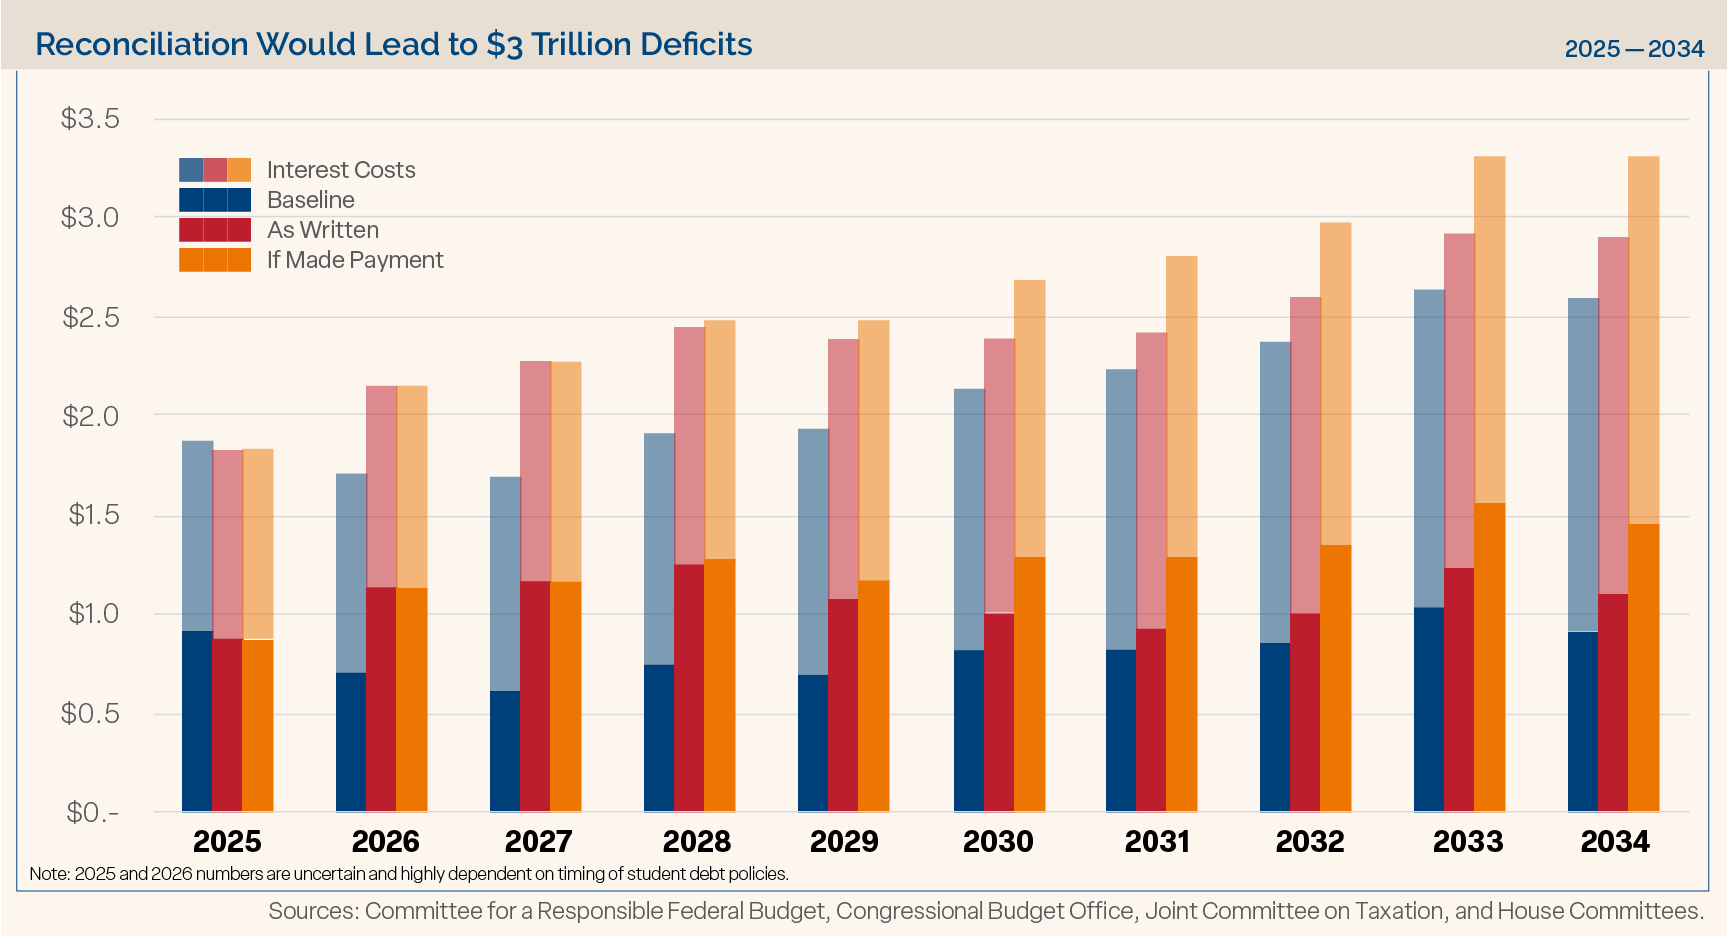
One reason investors are demanding higher interest rates from U.S. government bonds is America’s persistent budget deficit. The current version of the “Big Beautiful Bill” being negotiated in Congress is seen to add between $2 – $5 trillion to the federal debt — on top of the $20 trillion increase that the Congressional Budget Office (CBO) currently projects over the next 10 years. As Figure 14 shows, we face the possibility of $3 trillion deficits if expiring tax cuts are permanently extended.
Figure 14
forward-looking statements regarding future financial performance of markets are only predictions and actual events or results may differ materially.
Market Resilience During Crisis
Finally, on the geopolitical front, we saw a further escalation in the Middle East, so we wanted to review how the market responds to crisis events. Intuitively, you might think that geopolitical events would impact the market. It’s true that in general, investors tend to sell risk assets first and ask questions later. But over time, the market cares more about earnings and less about everything else.
That’s evident in Figure 15, which shows how the S&P 500 has reacted to geopolitical events. After initial reactions to geopolitical events, the market usually rallies. The median initial response is a 3% decline, then the market recovers. One month later 4.7%, three months later 6.1%, six months later 9.2%, and one year later 16.9% higher on average.
Figure 15
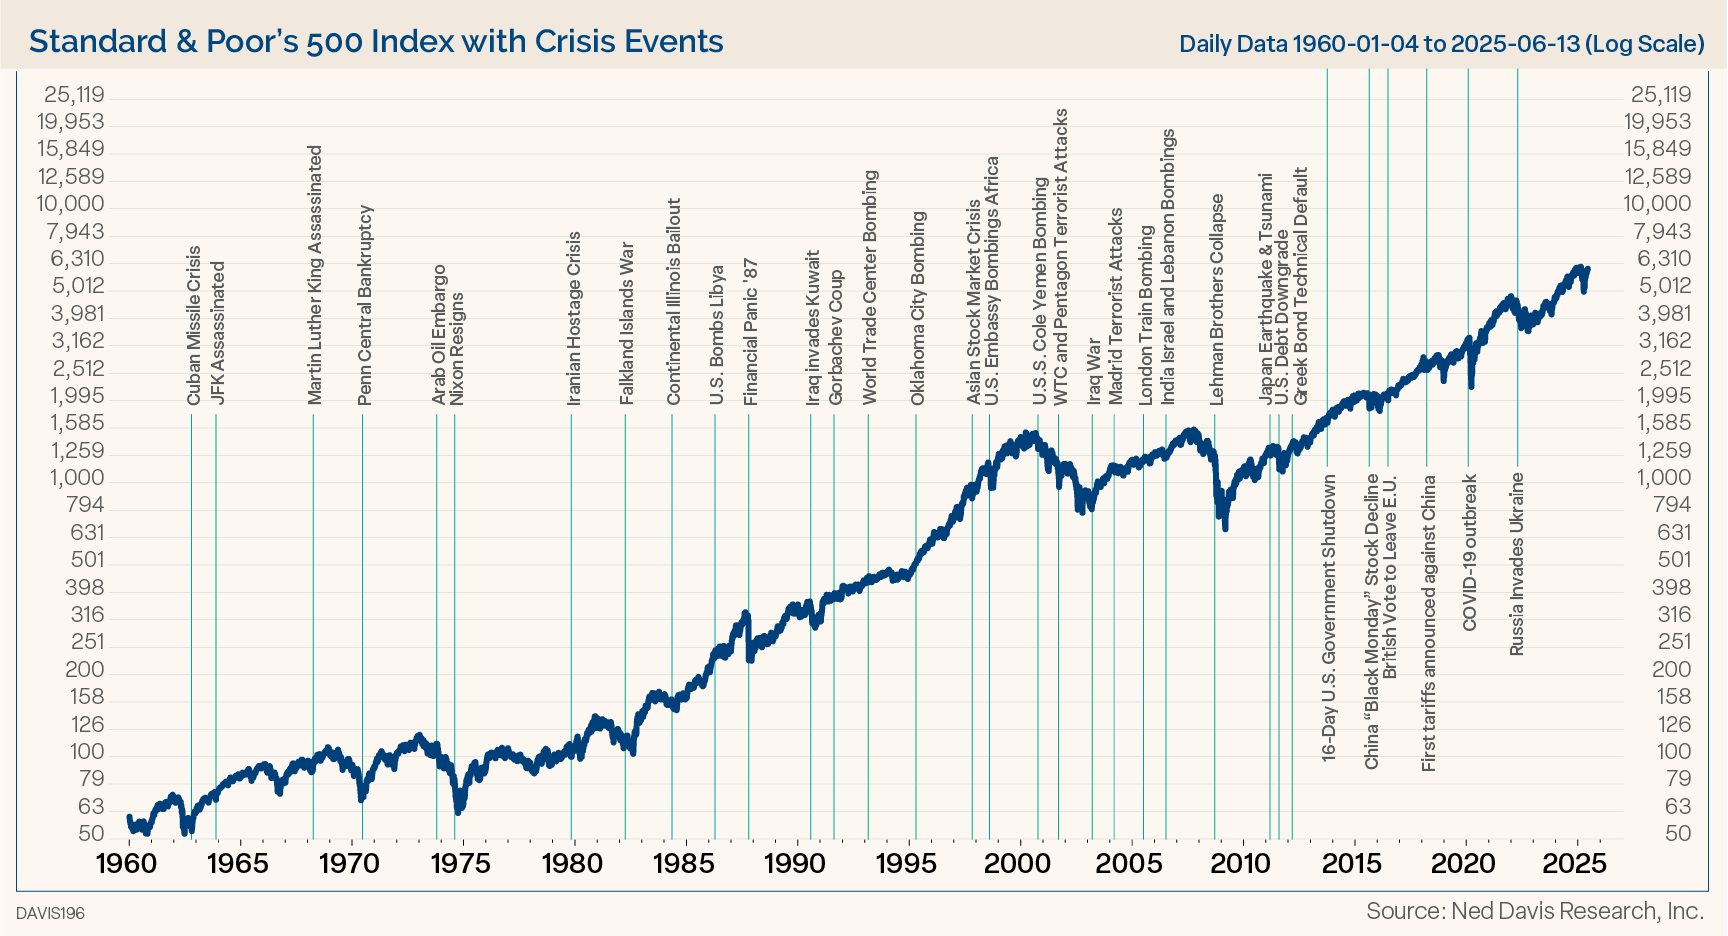
The bottom line is this: The world is a scary place. It always has been and always will be. Do not let that fear come between you and your portfolio and derail your long-term goals.
Looking for More Insights? Visit Our Resource Center.
The opinions expressed are those of Clark Capital Management Group. The opinions referenced are as of the date of publication and are subject to change due to changes in the market or economic conditions and may not necessarily come to pass. There is no guarantee of the future performance of any Clark Capital investment portfolio. Material presented has been derived from sources considered to be reliable, but the accuracy and completeness cannot be guaranteed. Nothing herein should be construed as a solicitation, recommendation or an offer to buy, sell or hold any securities, other investments or to adopt any investment strategy or strategies. For educational use only. This information is not intended to serve as investment advice. This material is not intended to be relied upon as a forecast or research. Investors must make their own decisions based on their specific investment objectives and financial circumstances. Past performance does not guarantee future results.
This document may contain certain information that constitutes forward-looking statements which can be identified by the use of forward-looking terminology such as “may,” “expect,” “will,” “hope,” “forecast,” “intend,” “target,” “believe,” and/or comparable terminology (or the negative thereof). No assurance, representation, or warranty is made by any person that any of Clark Capital’s assumptions, expectations, objectives, and/or goals will be achieved. Nothing contained in this document may be relied upon as a guarantee, promise, assurance, or representation as to the future.
Clark Capital Management Group, Inc. is an investment adviser registered with the U.S. Securities and Exchange. Commission Registration does not imply a certain level of skill or training. More information about Clark Capital’s advisory services can be found in its Form ADV and/or CRS, which are which is available upon request.
The Barclays U.S. Corporate High-Yield Index covers the USD-denominated, non-investment grade, fixed-rate, taxable corporate bond market. Securities are classified as high-yield if the middle rating of Moody’s, Fitch, and S&P is Ba1/BB+/BB+ or below.
Fixed income securities are subject to certain risks including, but not limited to: interest rate (changes in interest rates may cause a decline in market value or an investment), credit, prepayment, call (some bonds allow the issuer to call a bond for redemption before it matures), and extension (principal repayments may not occur as quickly as anticipated, causing the expected maturity of a security to increase).
Non-investment-grade debt securities (high-yield/junk bonds) may be subject to greater market fluctuations, risk of default or loss of income and principal than higher-rated securities.
The S&P 500 measures the performance of the 500 leading companies in leading industries of the U.S. economy, capturing 75% of U.S. equities.
The Russell 1000 Value Index measures the performance of the large-cap value segment of the U.S. equity universe. It includes those Russell 1000 companies with lower price-to-book ratios and lower expected growth values.
The Russell 1000 Growth Index measures the performance of the large-cap growth segment of the U.S. equity universe. It includes those Russell 1000 Index companies with higher price-to-book ratios and higher forecasted growth values.
The Russell 1000 Index measures the performance of the large-cap segment of the U.S. equity universe. It is a subset of the Russell 3000® Index and includes approximately 1000 of the largest securities based on a combination of their market cap and current index membership. The Russell 1000 represents approximately 92% of the U.S. market.
The Russell 2000 Index measures the performance of the 2000 smallest U.S. companies based on total market capitalization in the Russell 3000, which represents approximately 10% of Russell 3000 total market capitalization.
The Russell 3000 Index measures the performance of the 3000 largest U.S. companies based on total market capitalization, which represents approximately 98% of the investable U.S. equity market.
The MSCI USA Index is designed to measure the performance of the large and mid cap segments of the US market.
The MSCI Emerging Markets Index is a free float-adjusted market capitalization index that is designed to measure equity market performance of emerging markets. The MSCI Emerging Markets Index consists of the following 21 emerging market country indices: Brazil, Chile, China, Colombia, Czech Republic, Egypt, Hungary, India, Indonesia, Korea, Malaysia, Mexico, Morocco, Peru, Philippines, Poland, Russia, South Africa, Taiwan, Thailand, and Turkey.
The MSCI World ex US Index is a market capitalization-weighted index designed to measure equity performance in 22 global developed markets, excluding the United States. The benchmark for this composite is used because the MSCI World Ex US Net Index is generally representative of international equities.
BBgBarc U.S. Aggregate Bond Index covers the U.S. investment-grade fixed-rate bond market, including government and credit securities, agency mortgage pass-through securities, asset-backed securities and commercial mortgage-based securities. To qualify for inclusion, a bond or security must have at least one year to final maturity, and be rated investment grade Baa3 or better, dollar denominated, non-convertible, fixed rate and publicly issued.
The BBgBarc US Treasury Index measures US dollar-denominated, fixed-rate, nominal debt issued by the US Treasury. Treasury bills are excluded by the maturity constraint but are part of a separate Short Treasury Index. STRIPS are excluded from the index because their inclusion would result in double-counting. The US Treasury Index is a component of the US Aggregate, US Universal, Global Aggregate and Global Treasury Indices.
The BBgBarc US Corporate Bond Index measures the investment grade, fixed-rate, taxable corporate bond market. It includes USD-denominated securities publicly issued by US and non-US industrial, utility and financial issuers. The US Corporate Index is a component of the US Credit and US Aggregate Indices, and provided the necessary inclusion rules are met, US Corporate Index securities also contribute to the multi-currency Global Aggregate Index.
The BBgBarc U.S. Municipal Index covers the USD-denominated long-term tax-exempt bond market. The index has four main sectors: state and local general obligation bonds, revenue bonds, insured bonds and prerefunded bonds.
Created by the Chicago Board Options Exchange (CBOE), the Volatility Index, or VIX, is a real-time market index that represents the market’s expectation of 30-day forward-looking volatility. Derived from the price inputs of the S&P 500 index options, it provides a measure of market risk and investors’ sentiments.
The Institute of Supply Management (ISM) Non-Manufacturing Index is an economic index based on surveys of more than 400 non-manufacturing (or services) firms’ purchasing and supply executives.
Gross domestic product (GDP) is the standard measure of the value added created through the production of goods and services in a country during a certain period.
GDPNow is not an official forecast of the Atlanta Fed. Rather, it is best viewed as a running estimate of real GDP growth based on available economic data for the current measured quarter.
A Treasury Bill (T-Bill) is a short-term U.S. government debt obligation backed by the Treasury Department with a maturity of one year or less. Treasury bills are usually sold in denominations of $1,000.
The 10 year treasury yield indicates the interest rate that the US government pays to borrow money for a 10-year period.
References to market or composite indices or other measures of relative market performance over a specified period of time are provided for your information only. Reference to an index does not imply that your account will achieve returns, volatility or other results similar to that index. The composition of the index may not reflect the manner in which a portfolio is constructed in relation to expected or achieved returns, portfolio guidelines, restrictions, sectors, correlations, concentrations, volatility or tracking error targets, all of which are subject to change. Investors cannot invest directly in indices.
A leading indicator is a measurable set of data that may help to forecast future economic activity. Leading economic indicators can be used to predict changes in the economy before the economy begins to shift in a particular direction.
The volatility (beta) of an account may be greater or less than its respective benchmark.
The Consumer Price Index (CPI) measures the change in prices paid by consumers for goods and services. The CPI reflects spending patterns for each of two population groups: all urban consumers and urban wage earners and clerical workers.
Core inflation removes the CPI components that can exhibit large amounts of volatility from month to month.
The Producer Price Index (PPI) measures the average change over time in the prices domestic producers receive for their output.
The ISM Prices Paid represents business sentiment regarding future inflation. A high reading is seen as positive for the USD, while a low reading is seen as negative.
Nonfarm payroll refers to the number of jobs in the private sector and government agencies. It excludes farm workers, private household employees, proprietors, non-profit employees, and actively serving military.
A CCC-rated bond is a debt instrument considered to be speculative grade or “junk” by credit rating agencies. This means the issuer has a high risk of defaulting on its debt obligations. CCC-rated bonds are issued by companies facing significant financial difficulties, high debt levels, or operating in unstable industries.
Core PCE, or Core Personal Consumption Expenditures, is a measure of inflation that excludes food and energy prices. It represents the prices of goods and services purchased by consumers, but with the most volatile components (food and energy) removed to provide a clearer picture of underlying inflation trends. The Federal Reserve uses Core PCE as a key indicator when making monetary policy decisions.
VIX of VIX (or VVIX) is a measure of the volatility of the Chicago Board Options Exchange (CBOE) Volatility Index (VIX). The CBOE’s VIX measures the short-term volatility of the S&P 500 indexes, and the VVIX measures the volatility of the price of the VIX. In other words, VVIX is a measure of the volatility of the S&P 500 index and alludes to how quickly market sentiment changes.

