
Over the Horizon – Opportunity & Risk
Highlights
We believe:
- The economy is in solid shape and continues to surprise to the upside. The second quarter of 2025 posted 3.8% growth and accelerated in Q3 to a 4.3% annualized real GDP growth rate. The fourth quarter is likely to be much lower due to the longest government shutdown in history. However, the economy has embedded momentum with the government restart and combination of fiscal and monetary stimulus set for 2026. We expect the economy to grow by 3.0% in 2026.
- Bullish trends include a wall of worry for individual investors, a dovish Federal Reserve, record high corporate earnings, moderating inflation (disinflationary trend), and accelerating productivity gains. Continued economic growth and new highs in corporate earnings suggest another year of gains for the market. Our year-end target for the S&P 500 is 7700. Gains could be back-end loaded based on the presidential cycle trends and historical mid-term election statistics.
- A new Federal Reserve Chair and midterm election year trends suggest a period of volatility that could extend into Q2/Q3 before the market rallies into year end.
- The Federal Reserve is expected to cut overnight rates 2–3 times in 2026. We expect the 10-year Treasury note yield to remain rangebound between 3.5%–4.5%, with the curve steepening as the Fed cuts short-term rates.
- Risks to the outlook include the valuation landscape, labor market weakness, continued challenges to Fed independence, AI capital spending, geopolitics (Russia/Ukraine, Middle East, China/Taiwan, Venezuela), and the U.S. government fiscal position.
2025: Another Wall of Worry Conquered
Looking back, 2025 was a year where we endured political turmoil, tariffs and reversals, challenges to the Federal Reserve’s independence, the longest government shutdown on record, and more. Despite the noise and uncertainty, the markets did what they do best. They climbed a “wall of worry” and capped off another year of solid gains. Following the Tariff Liberation Day announcement, the S&P 500 tumbled 10% in two days. The markets then reversed course following the tariff pause and staged a massive recovery rally, with the S&P 500 advancing for seven consecutive months.
The S&P 500 notched 39 record highs and finished with a double-digit percentage point gain for the third straight year, returning 17.86%, which followed gains of 24.2% in 2023 and 23.3% in 2024. In the S&P 500’s history since 1928, rallies of 10% or more three years in a row happened only five other times: 1942 to 1944, 1949 to 1951, 1995 to 1997, 2011 to 2014, and 2019 to 2021. Of those five prior streaks, only the streak beginning in 1995 extended for five years. Two streaks lasted four years, and the 2012 and 2019 instances ended in their third year. So, are further gains in store for this year? We think so and we’ll explain as we continue.
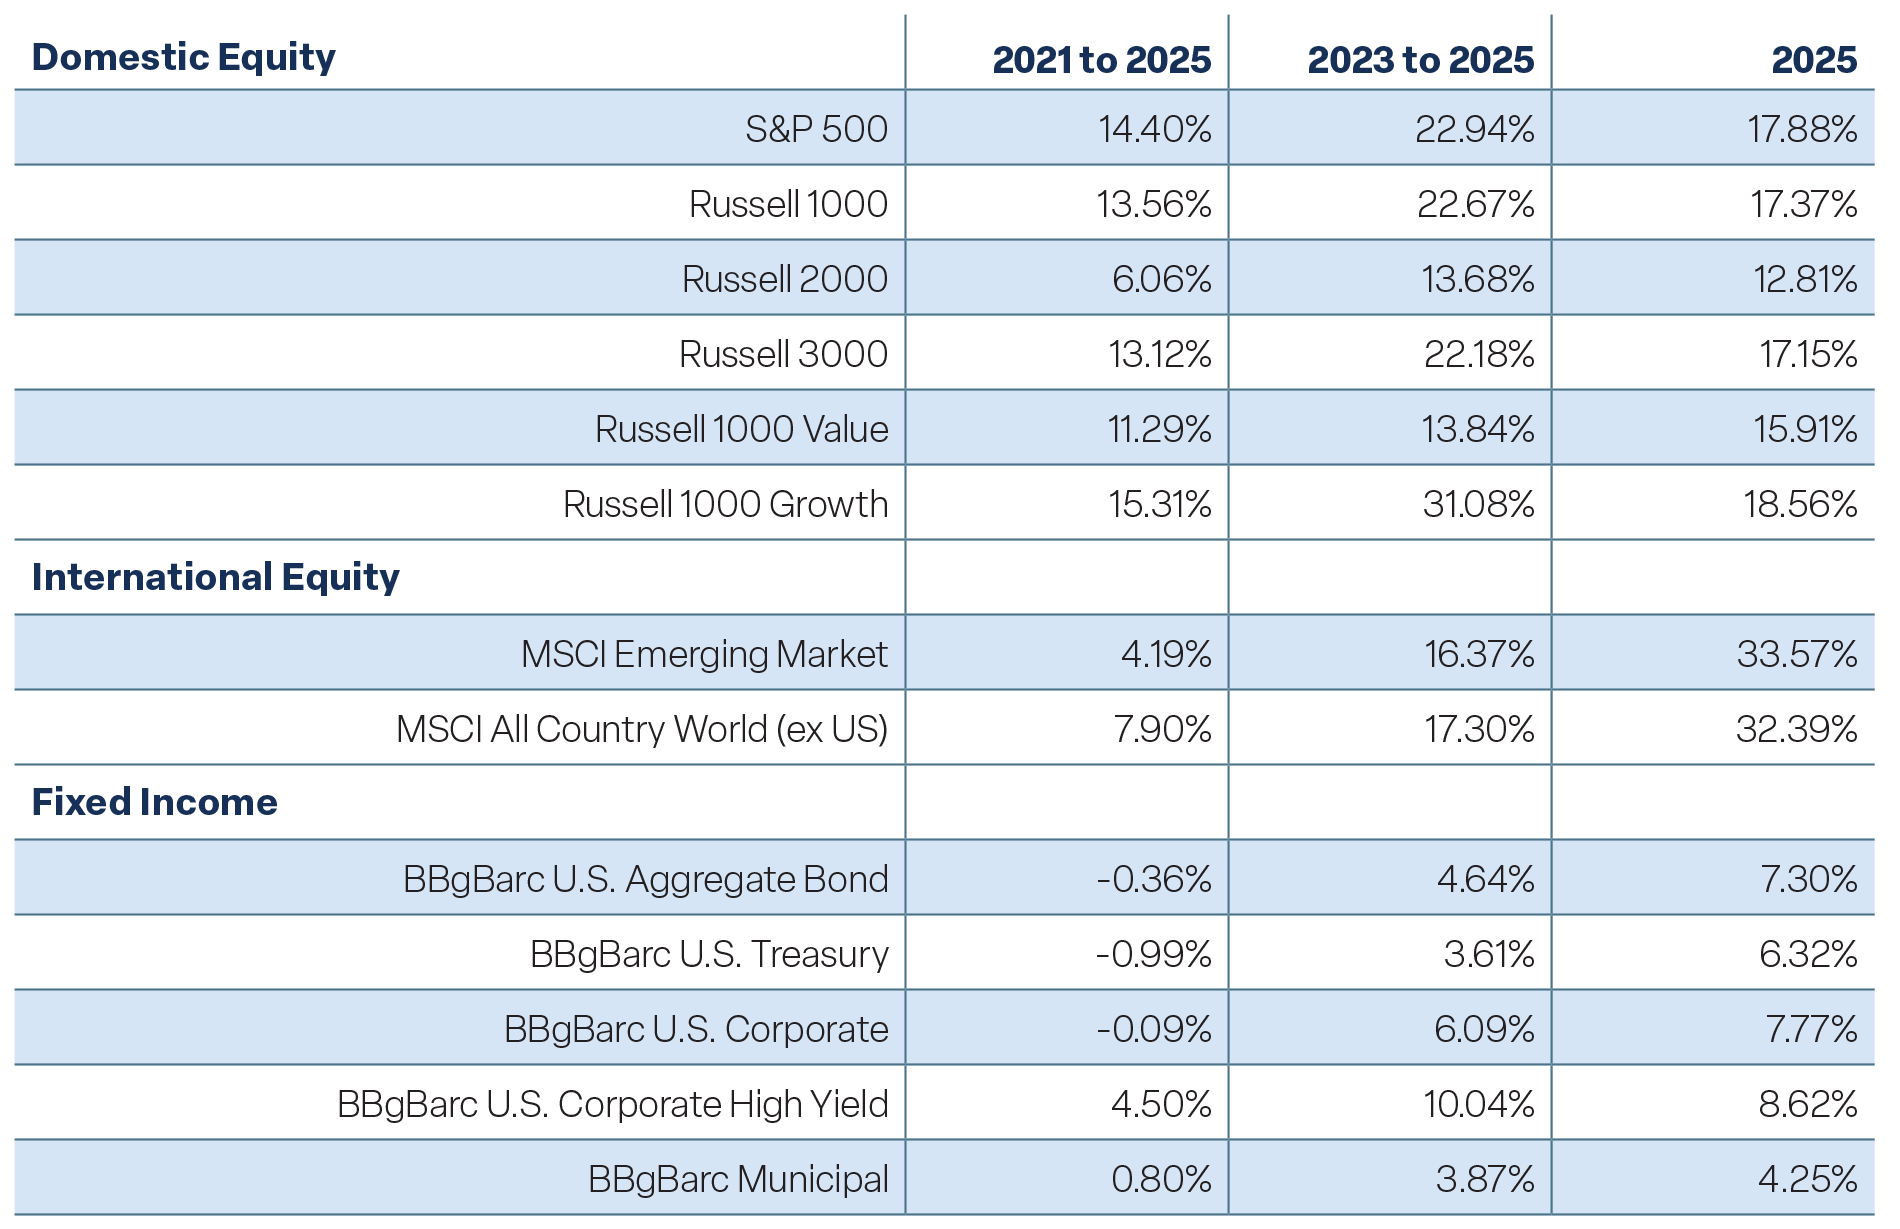
Markets delivered broad-based gains, with U.S stocks, international stocks, and fixed income all posting solid gains. For only the third time in the past 15 years, international markets outperformed the U.S. The U.S. Dollar Index tumbled 9.4% in 2025, its second-worst return in the last 20 years. The Trump administration’s weak-dollar policy and the Fed’s resumption of its easing policy—while other central banks moved toward the end of their own cycles—contributed to the greenback’s tough year. See Figure 1.
Figure 1
Perspective
Past performance is not indicative of future results. This is not a recommendation to buy or sell a particular security. Please see disclosures at the end of this document.
Don’t Fight the Fed. Don’t Fight the Trend.
This time last year we said, “Our outlook for 2025 calls for a bullish continuation of the cyclical bull market, but not another straight line higher. While valuations are lofty, they are not a good timing tool. Looking ahead, we expect the pace of price appreciation to slow and earnings to again be the primary driver for stock prices in 2025.” Our year-end target for the S&P 500 was 6700, with the market buoyed by continued growth in corporate earnings.
Even in the face of the tariff meltdown, we did not lower our year-end target, fully expecting the market to rebound given the remarkably resilient economy. The S&P 500 ended the year at 6845.50 after having been less than 1% from our target in mid-December. We believe our call was pretty spot on.
In 2026, we expect the market to push further into new-high territory and the economy to continue its expansion with solid real GDP growth. The mantra should be “Don’t fight the Fed. Don’t fight the trend and watch credit.” The Fed is dovish and is expected to continue cutting rates in 2026. The trend is positive, and we have recently seen a broadening of participation beyond just the Mag-7 mega tech companies. Finally, credit conditions remain supportive of risk assets, spreads are low, and liquidity is abundant.
As you know, we were not in the recession camp even though many strategists were calling for one. They are not anymore either. We expect the economy to grow 3.0% in 2026 supported by the government restart and a combination of fiscal and monetary stimulus set for 2026. Many bullish trends exist for the market including a “wall of worry,” a dovish Fed, record corporate earnings, and disinflation that supports the market. Looking ahead, we expect earnings to be the primary driver for stock prices again in 2026. Our year-end target for the S&P 500 is 7700.
Risks to the outlook are many, including a new Federal Reserve Chair and the midterm elections, both of which historically contribute to volatility and sizable corrections. In addition, labor market weakness remains a concern as well as challenges to Fed independence, the AI capital spending spree, and geopolitics.
U.S. Economy Enters 2026 With Momentum
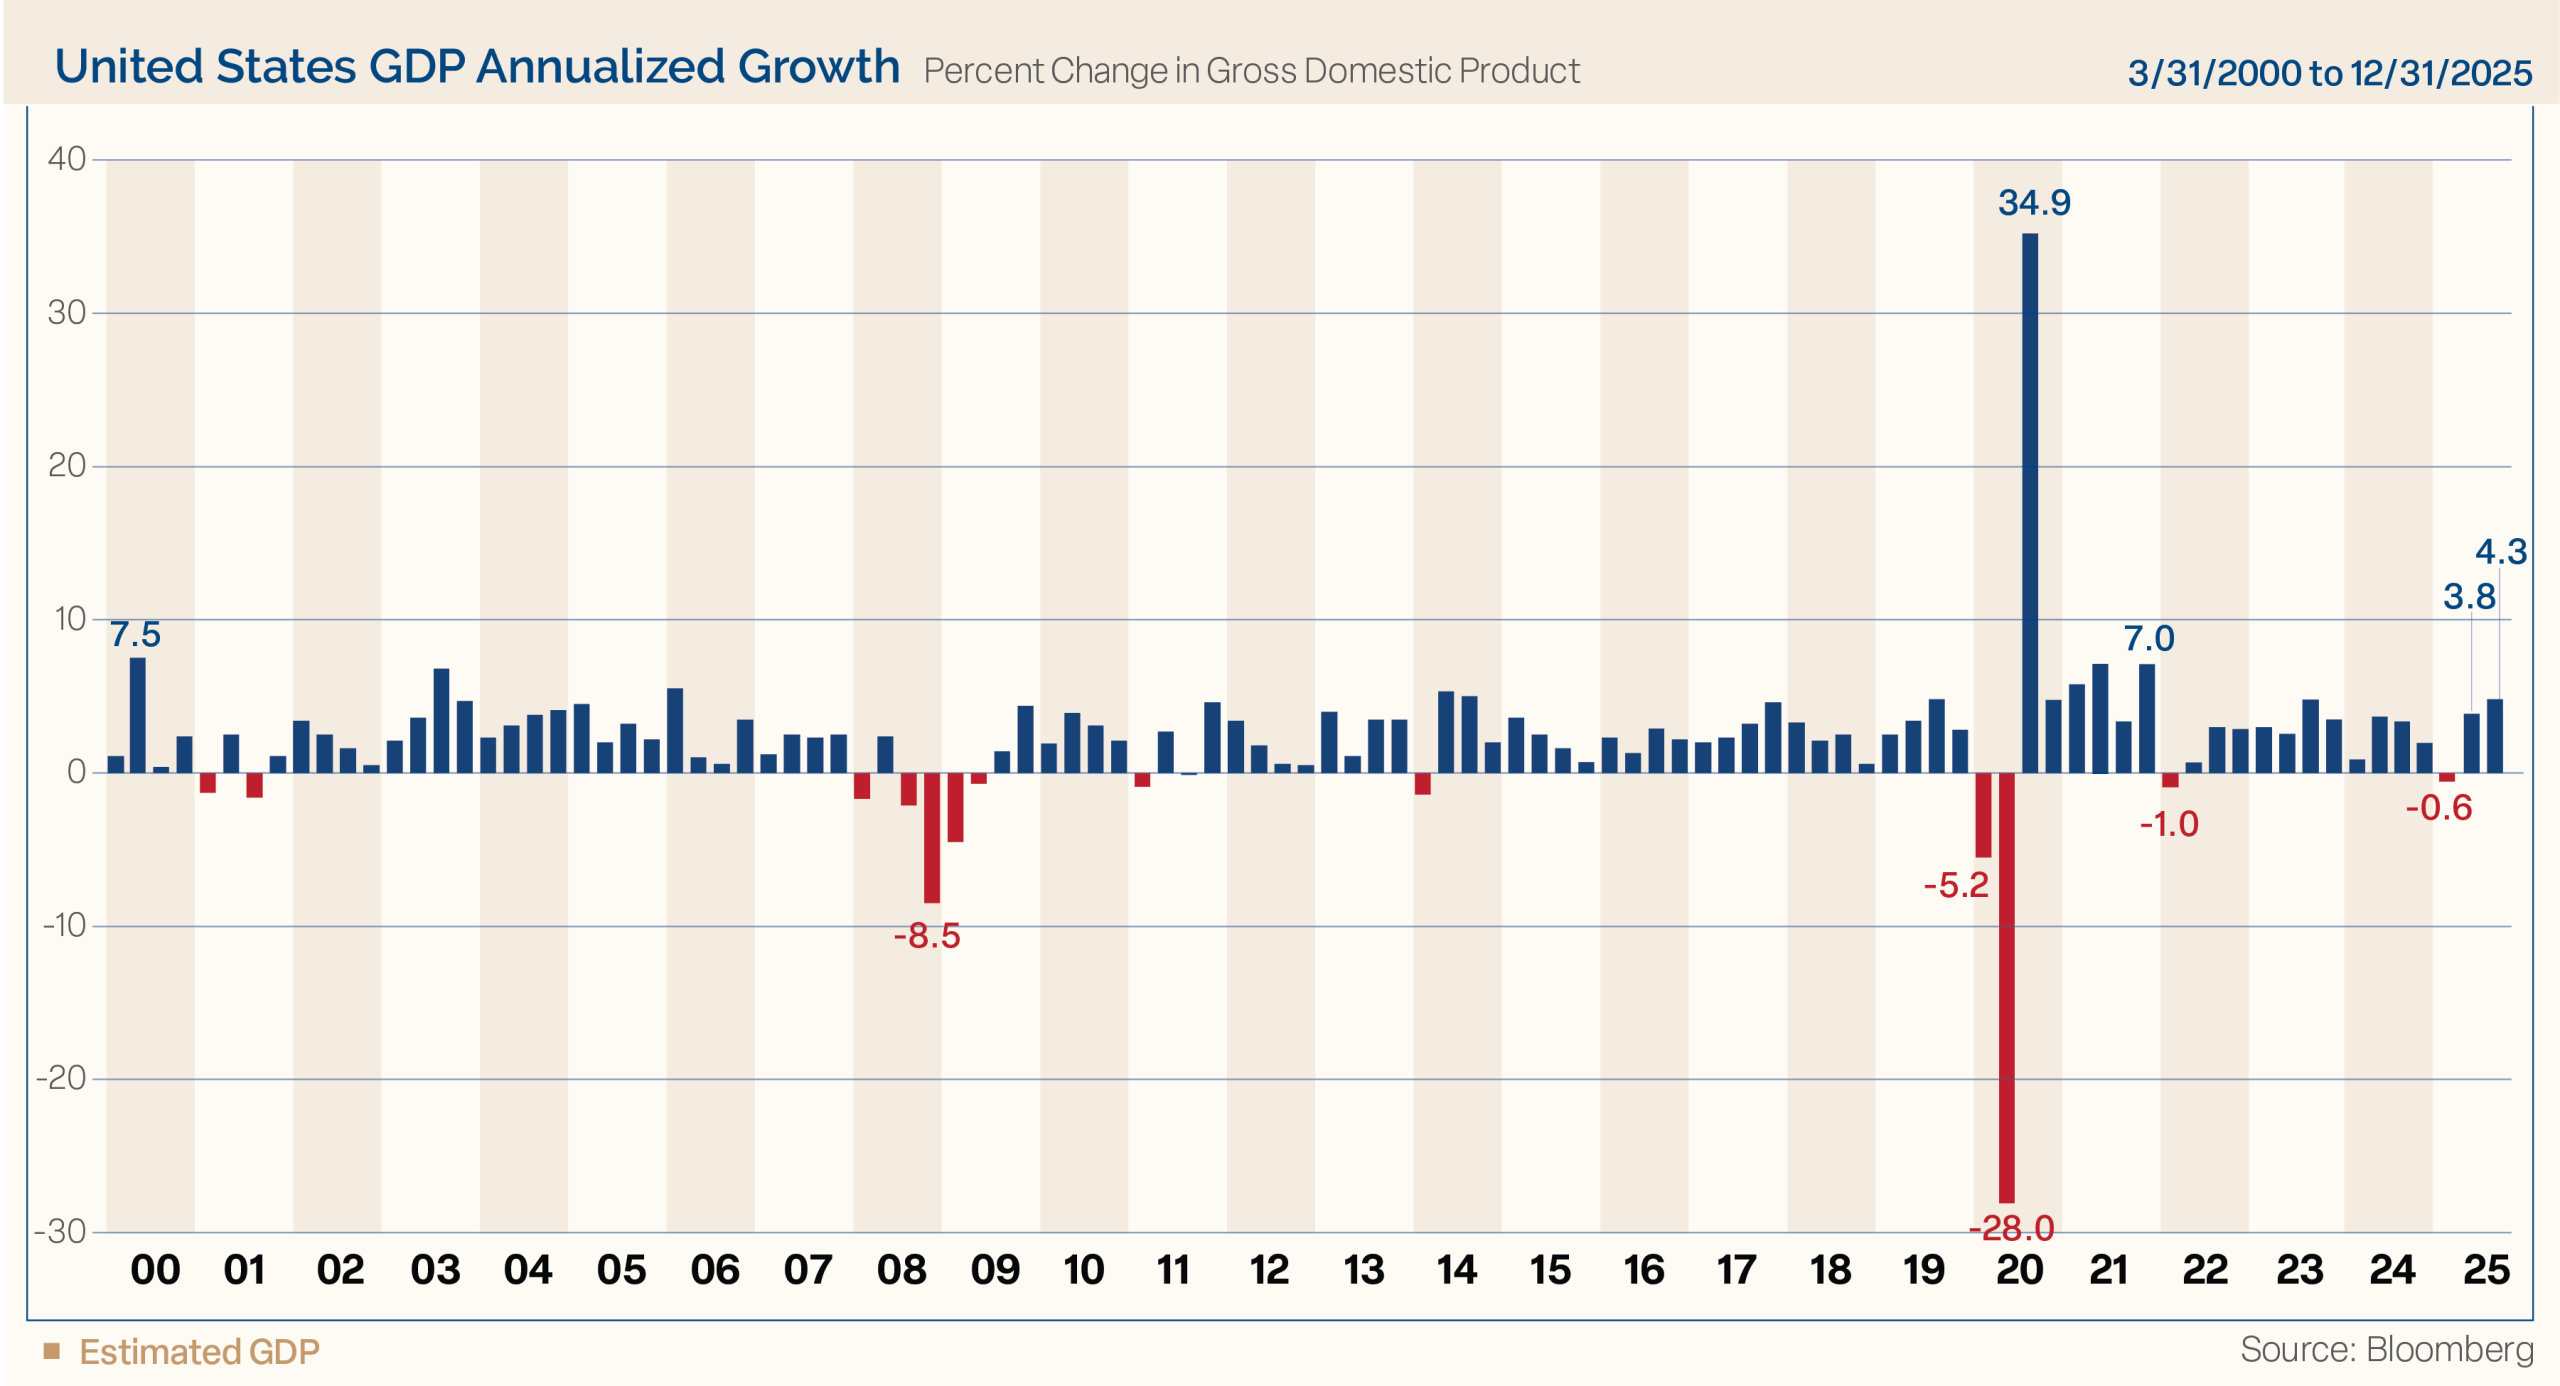
Let’s begin by taking a high-level look at the U.S. economy. As shown in Figure 2, during the third quarter of 2025, real GDP jumped 4.3%, and corporate profits hit a new record high. The economy enters the new year with a clear tailwind. That breeze is set to strengthen with loose financial conditions and a dovish Fed, fiscal support from the One Big Beautiful Bill (OBBBA), and continued disinflation. We expect the U.S. economy to grow 3.0% in 2026.
Figure 2
The AI CapEx cycle is set to accelerate in 2026 with regulatory relief and potential reform that could accelerate energy investment. According to the Congressional Budget Office (CBO), 2025’s OBBBA legislation is expected to boost real GDP by 0.6–0.9% in 2026. The bill will stimulate the economy primarily through a massive wave of tax refunds and renewed business incentives. Because the bill passed mid-year but made many tax cuts retroactive to January 1, 2025, most workers didn’t see the benefits in their weekly paychecks. Instead, these benefits will arrive as lump-sum payments when Americans file their taxes in early 2026.
A Cooling Labor Market Bears Watching
Amid the hopeful economic data, the labor market remains a fly in the ointment. The unemployment rate is now 4.5%, up from 4.1% in June. The economy barely added any jobs in the back half of last year, with only 87,000 jobs created between July and December. That’s less than 15,000 per month over that period. The labor market has cooled, but it hasn’t collapsed. In our opinion, several factors have contributed to the softer labor market including immigration policies, uncertainty around the long-run impact from tariffs, and productivity gains from AI that has slowed hiring, especially impacting first time job seekers.
The main risk going forward is rising unemployment. Consumers continue to report difficulties finding jobs. This tends to lead what happens with unemployment, which has increased 0.3 percentage points in each of the last three years. We believe that trend is likely to continue this year too in a jobless economic expansion.
Manufacturing at a Trough, not a Breakdown
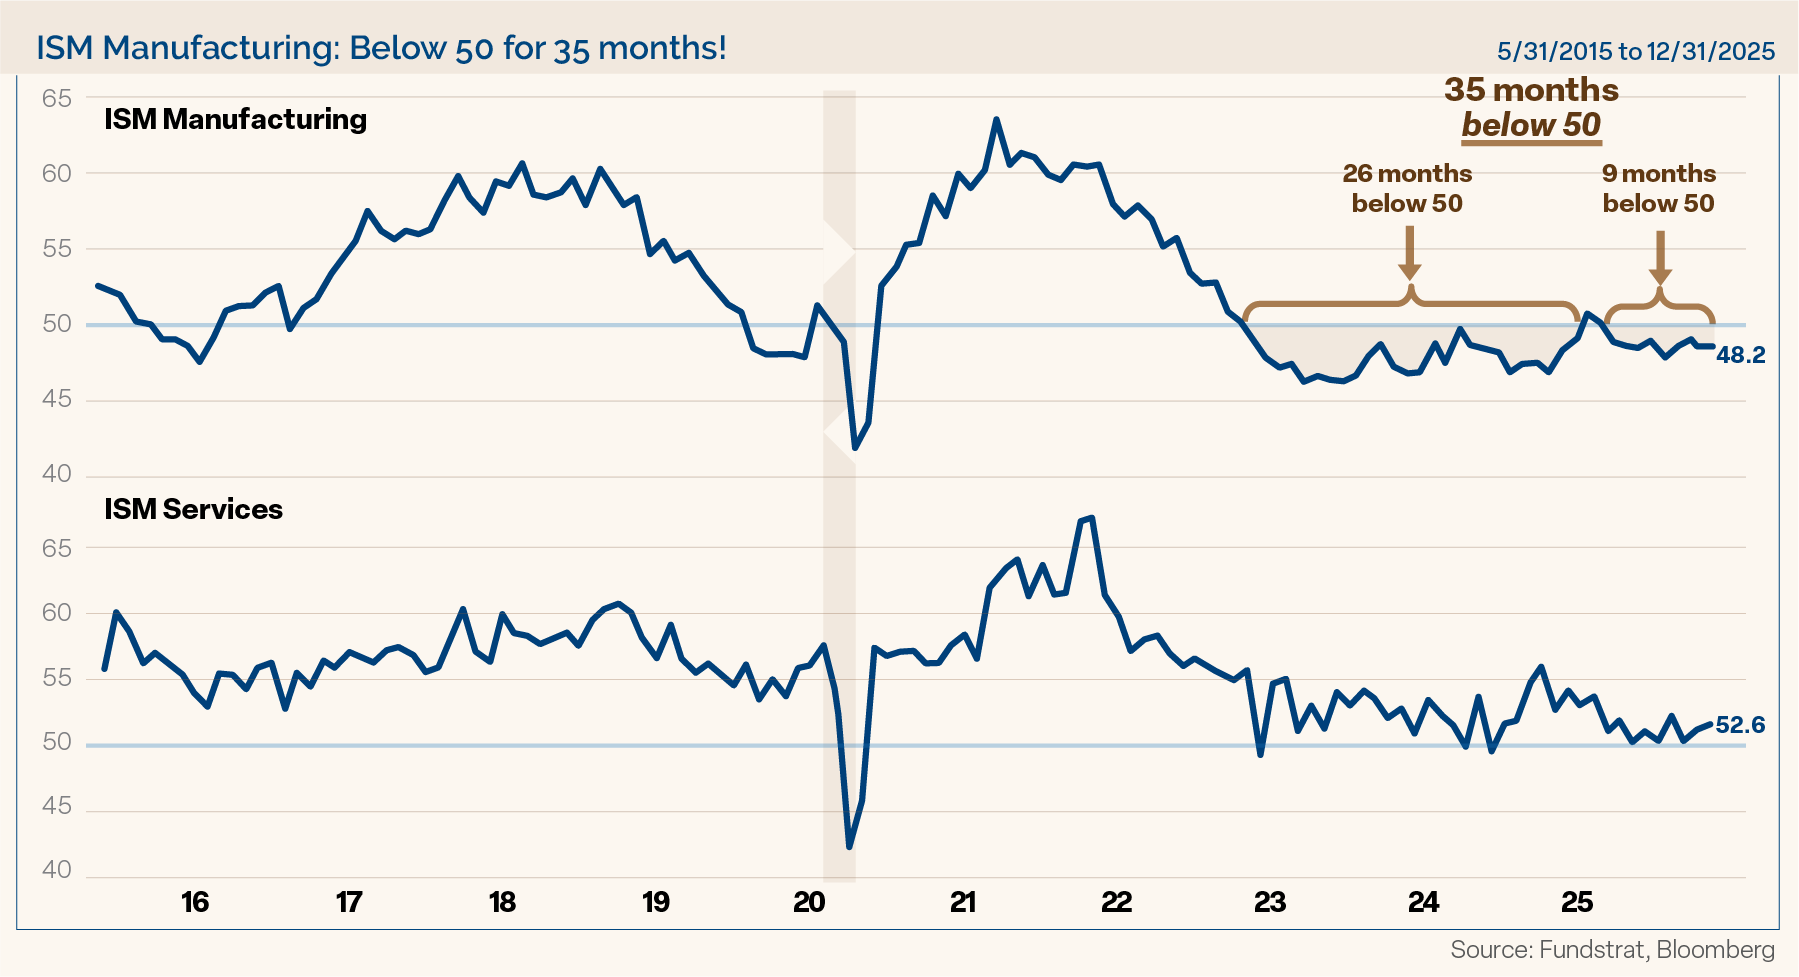
The ISM Manufacturing Index, shown in Figure 3, has been in the contraction zone below 50 for 35 of the past 37 months (since November 2022), the longest stretch of time it has been in contraction since its inception. I’d like to share a few points on this. First, it is rare to be in contraction for more than a couple of quarters. Even during the Global Financial Crisis, the index was only in contraction for 16 months. Second, ISM below 50 is more consistent with “early cycle” economic and market trends. Third, given the expectation of both fiscal and monetary stimulus, continued economic growth, and AI buildout, we expect the manufacturing sector to enter expansion territory early this year.
Figure 3
Using Cycles as a Guide: What the Patterns May Tell Us
Figure 4 shows the Ned Davis Research Cycle Composite for last year. It combines the one-year cycle, four-year cycle (election years), and decennial cycle into a single composite. The blue line is the composite, and the red line is the actual S&P 500. We use the Cycle Composite as a guide to how the market may trade directionally in the upcoming year. It has had a very good track record in previous years.
Figure 4
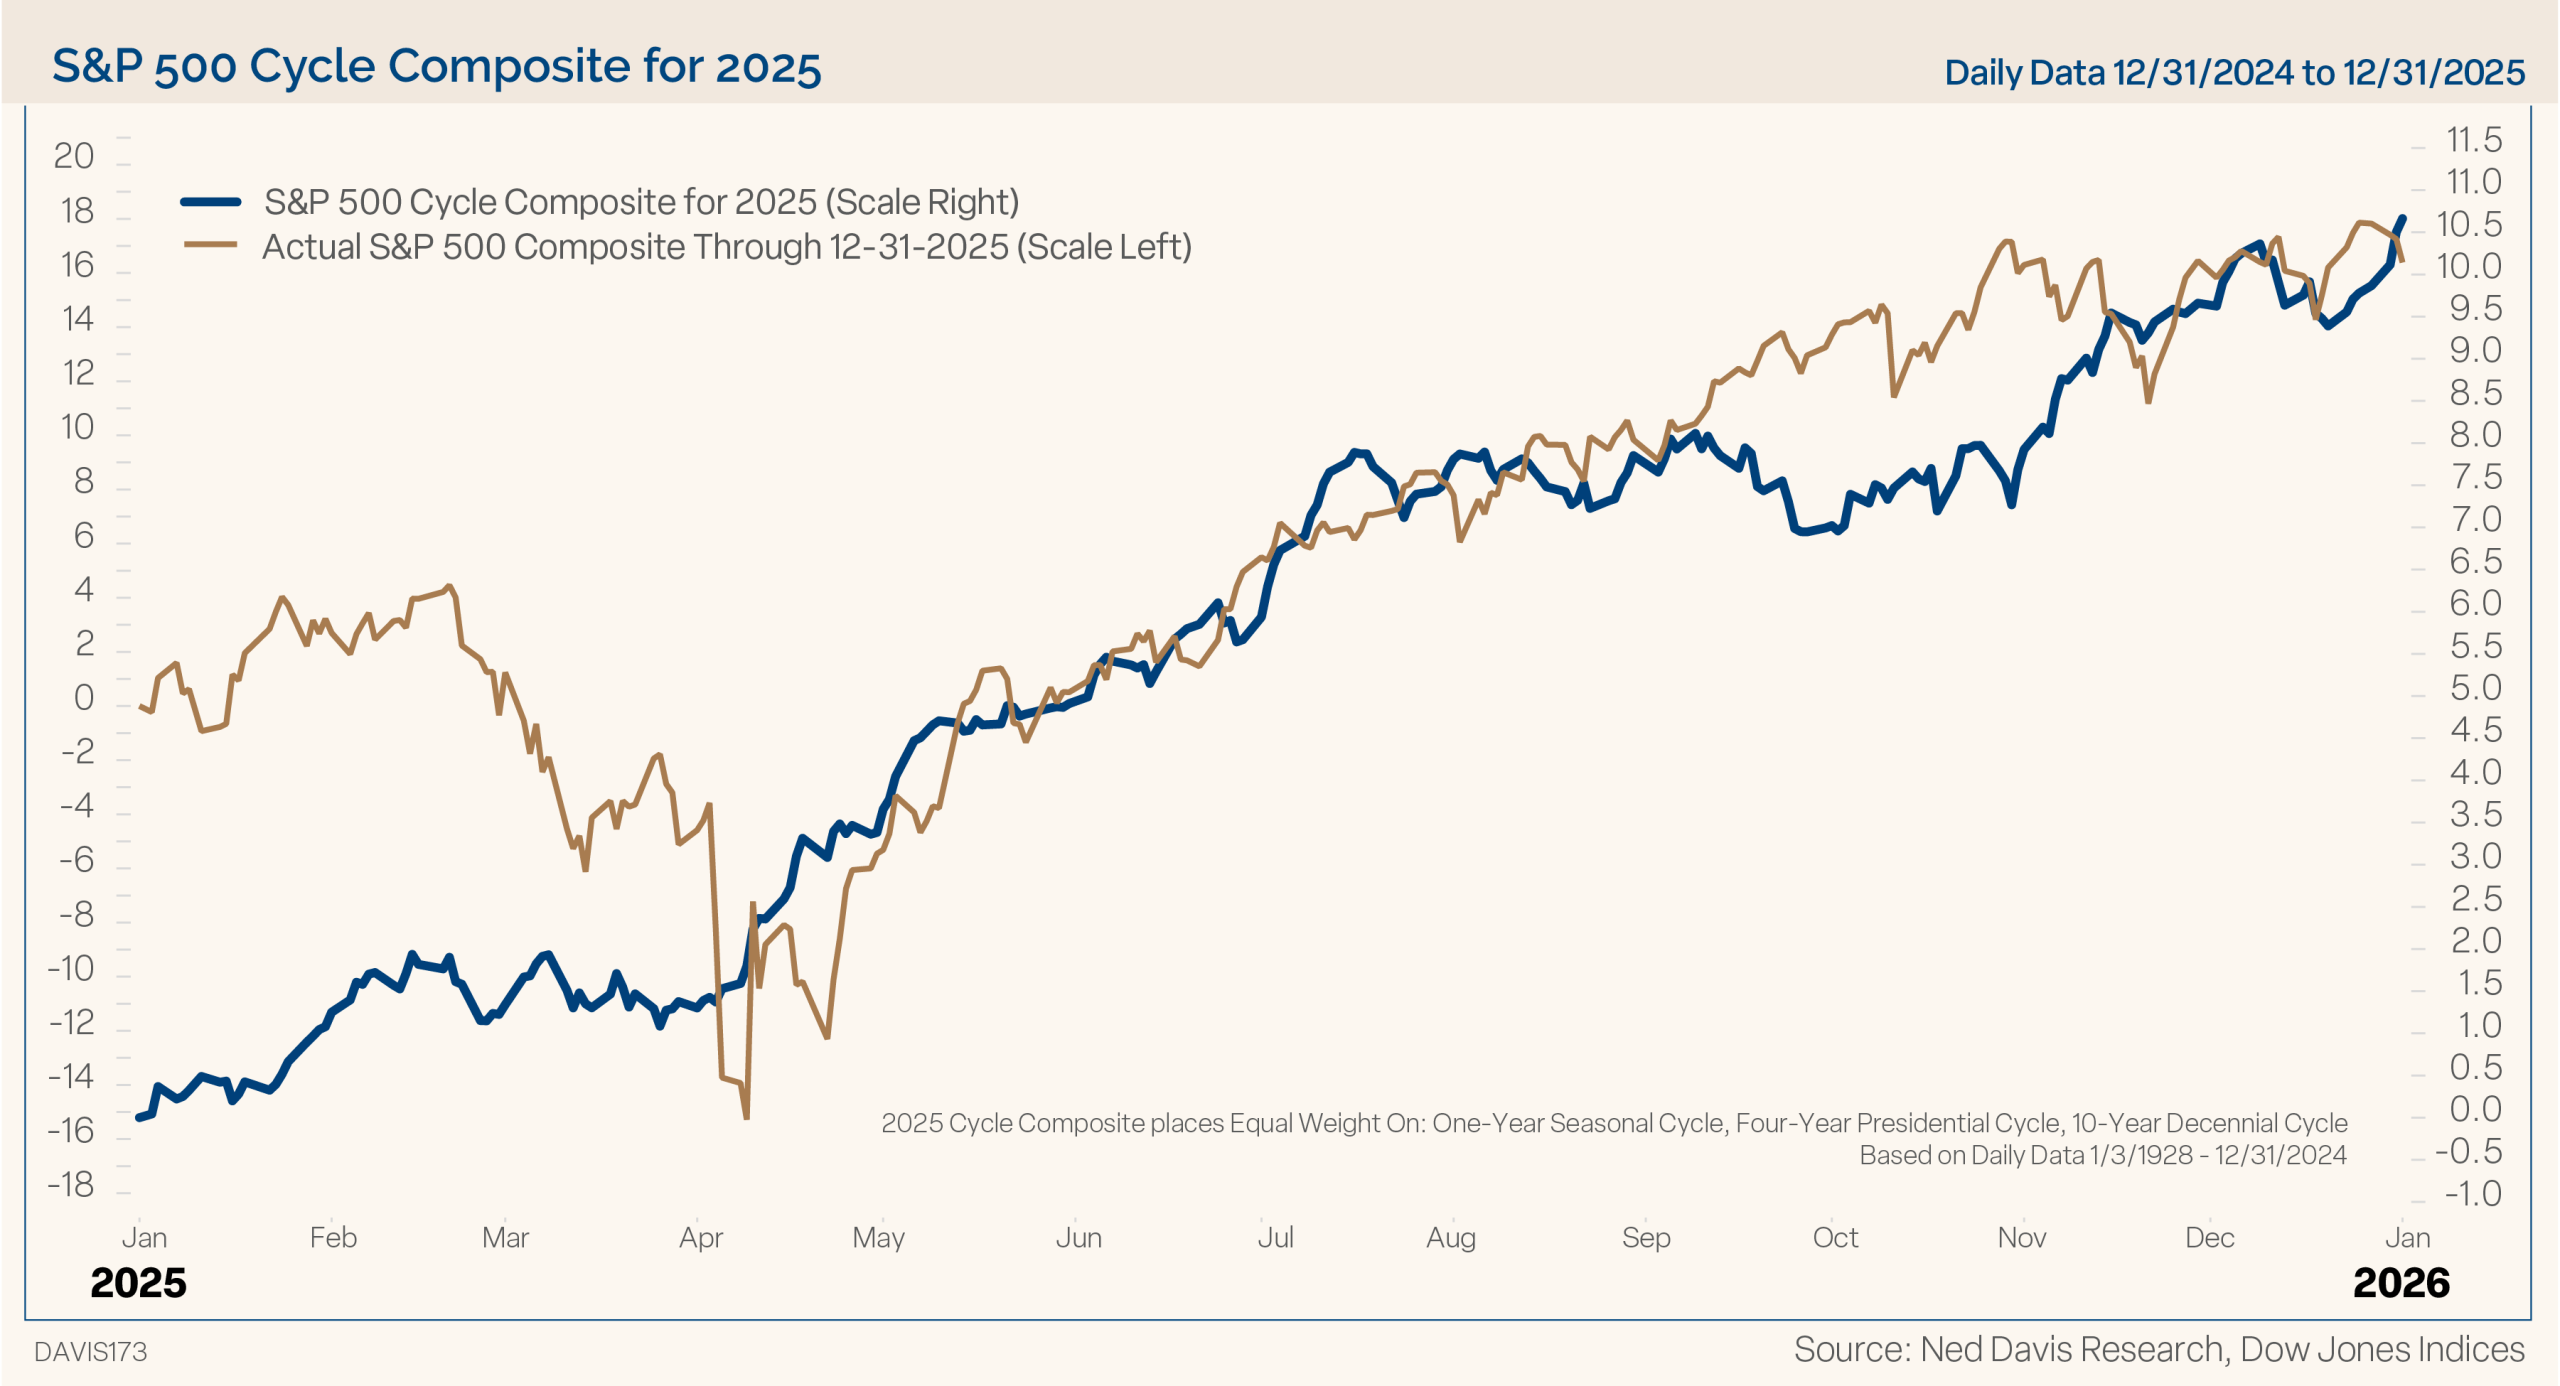
In last year’s outlook we said, “The Cycle Composite shows a strong first half, third quarter pullback, and year-end rally. Whether the second half of the year follows the more bullish Cycle Composite or the cautious four-year cycle may depend on inflation and EPS growth.” The market followed the composite well. The exception was that the tariff volatility was more extreme, but the rest of the year trended higher, driven by disinflation and strong earnings growth, as we suggested.
The Cycle Composite for 2026 (Figure 5) shows potential for the uptrend to continue into April, a pullback in the second and third quarters, and a year-end rally.
Figure 5
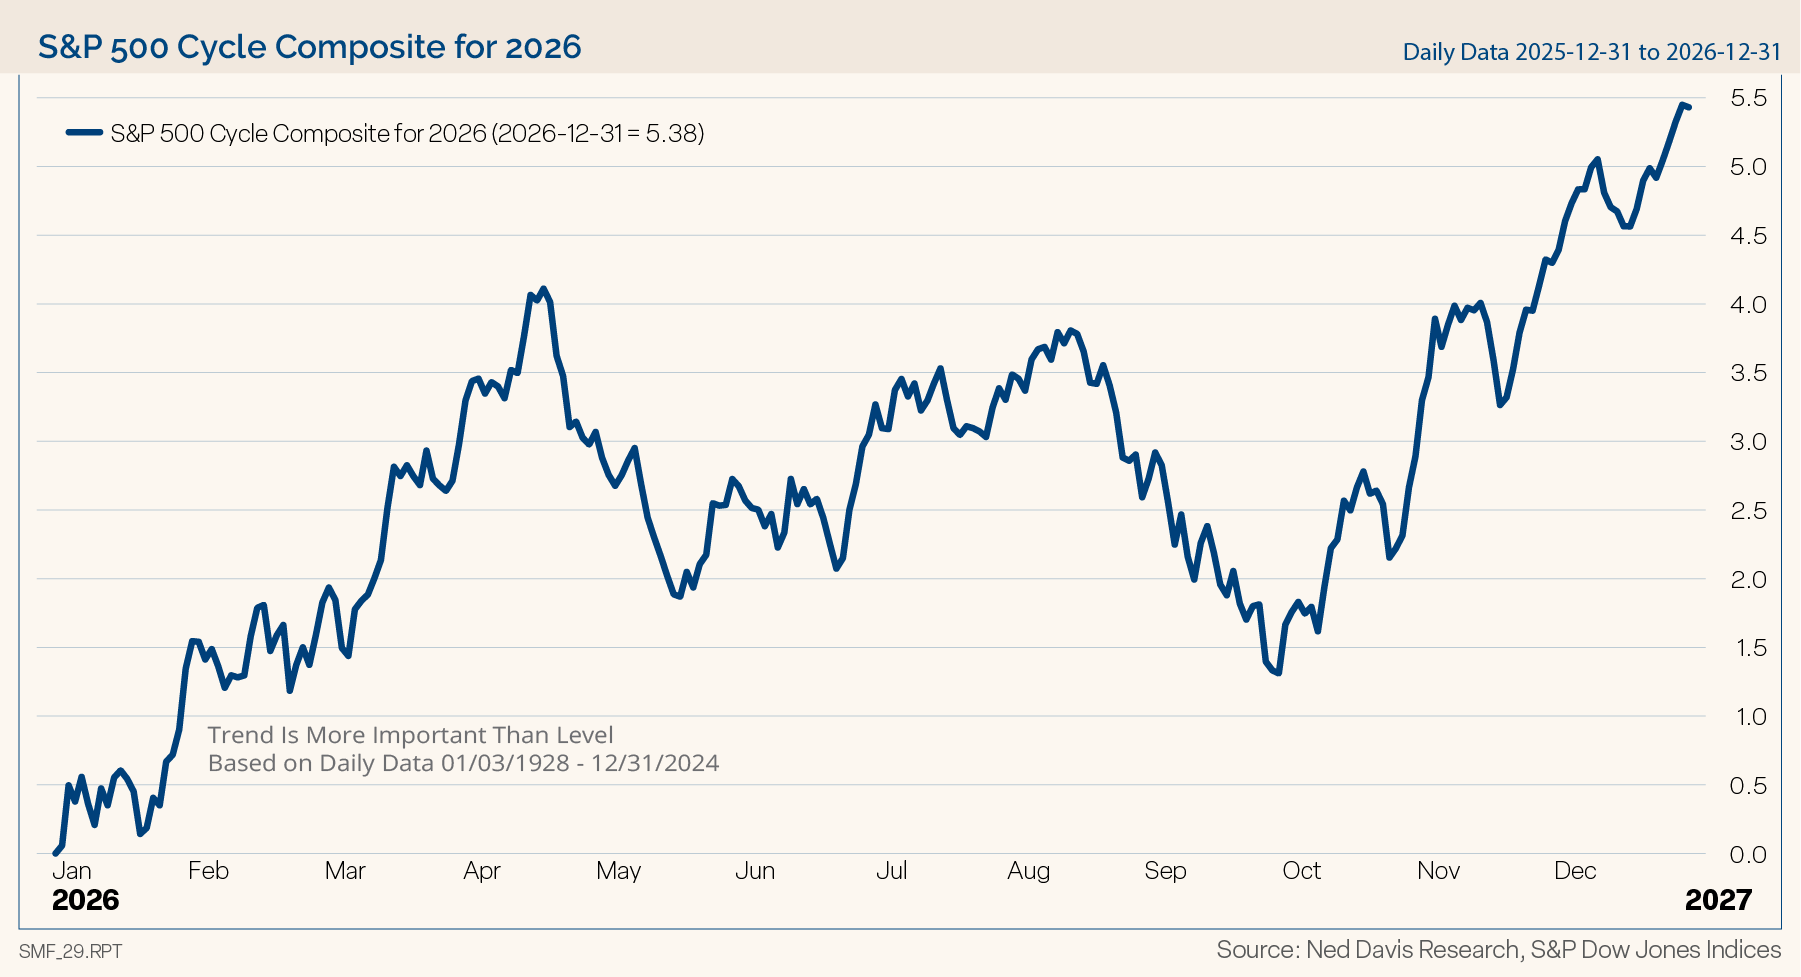
The consensus among Wall Street investment strategists is that the upside will persist. According to Bloomberg, the average analyst estimate for the S&P 500 by year end is 7555 with a low of 7000 and a high of 8100. That average is 9.0% above today’s close (January 13, 2026). Our forecast of 7700 would be a 12.5% gain.
Whether the market follows the weak Q2–Q3 pattern suggested by the Cycle Composite likely depends on how the market interprets the new Fed chair and the stimulative effects of a dovish Fed and the Big Beautiful Bill Act.
Midterm Years Tend to Be Volatile but Constructive
Figure 6 graphically shows the historical trend of the market during the four years of the presidential cycle, dating back to the early 1900s. We are currently in the second year of the term, a midterm election year, which has historically been mediocre for the equity markets. In the post WWII era (since 1948), the S&P 500 has delivered an average gain of just 4.6% in midterm election years, posting positive returns only 58% of the time, by far the lowest calendar year return during the four-year cycle.
Figure 6
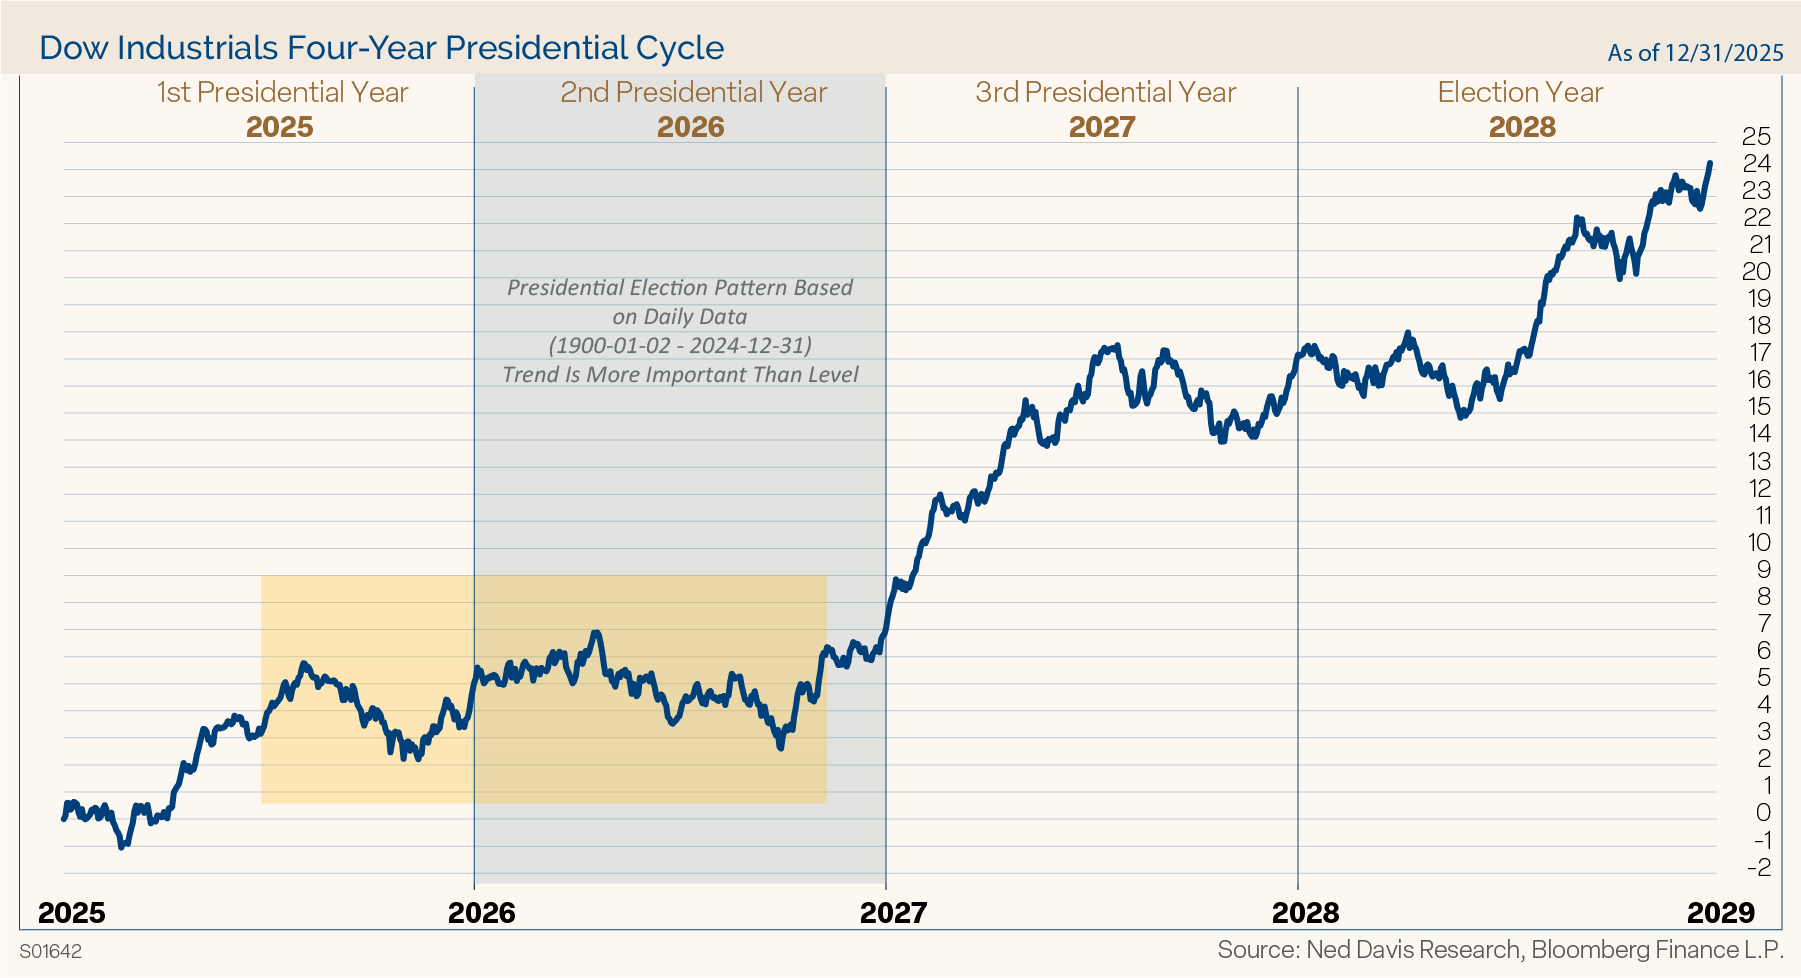
The horizontal shaded zone from about the middle of the first year of the term into midterm elections shows historically that the market normally trades in a sideways consolidation. Part of the rationale for this pattern is that government stimulus follows the presidential cycle. Stimulus normally picks up prior to the midterm elections as the party in power tries to maintain its status, with that stimulus continuing through the general election year.
Midterm elections are almost always referendums on the party controlling the White House. The best predictor of outcomes is the President’s approval rating, which needs to be in the mid-60s to potentially not lose House seats (based on the past 20 midterms). President Trump’s job approval is presently 42%. The Senate, by contrast, is more influenced by which seats are up and the candidate’s quality. Prediction markets currently give the GOP two out of three odds to hold the Senate, with Dems 77% likely to capture the House.
The party holding the White House has lost seats in the House of Representatives in 18 of the past 20 midterm elections. American voters have always been suspicious of concentrated government power and have consistently sought balance over time. Nine of the past 11 elections were change elections with the party in the White House losing the House, Senate, or the Presidency. In addition, during President Trump’s first term, the Republicans lost 40 seats in the House. Advantage Democrats in this election.
History shows that the market has endured a 21% correction on average into midterm election year lows. The silver lining to this is that the market has also historically rebounded very strongly from those midterm lows to a high the very next year. The average gain from the midterm low to the high point in the following year is 47%. Naturally, the years accompanied by a recession have had steeper declines, 31% on average, than those with continued economic growth, 17% on average. With no recession on the horizon, if we get the normal midterm correction, we expect it to be of the milder variety.
Markets Are Cyclical, Corrections Are Normal
On average the S&P 500 has experienced three 5% corrections a year, a 10% decline once a year, a 15% decline every two years, and a 20% or greater bear market every three years.
Last year the S&P 500 suffered an 18.9% correction in the aftermath of Tariff Liberation Day. After the tariff volatility, from late April through the end of the year, the S&P 500 had four brief pullbacks of less than 3% each and one 5% correction. That was a period of relative calm and virtually straight up markets. Through that entire rally, investors remained very cautious and pessimistic.
Investor Pessimism Persists Despite Strong Markets
Let’s look at investor sentiment. For the stock market, fundamentals matter over the long run, however, in the short run, sentiment is also important. We know that markets climb a “wall of worry,” and there was no shortage of worry in 2025.
The American Association of Individual Investors (AAII) sentiment poll showed a long stretch of excessive pessimism last year as politics, tariffs, inflation, Fed independence, and geopolitics weighed on sentiment. In fact, only 19 of 52 weeks last year showed more individual investors bullish than bearish. As Warren Buffet said, “Be fearful when others are greedy, and greedy when others are fearful.” Investors were excessively pessimistic last year, and the market rallied in the face of those fears.
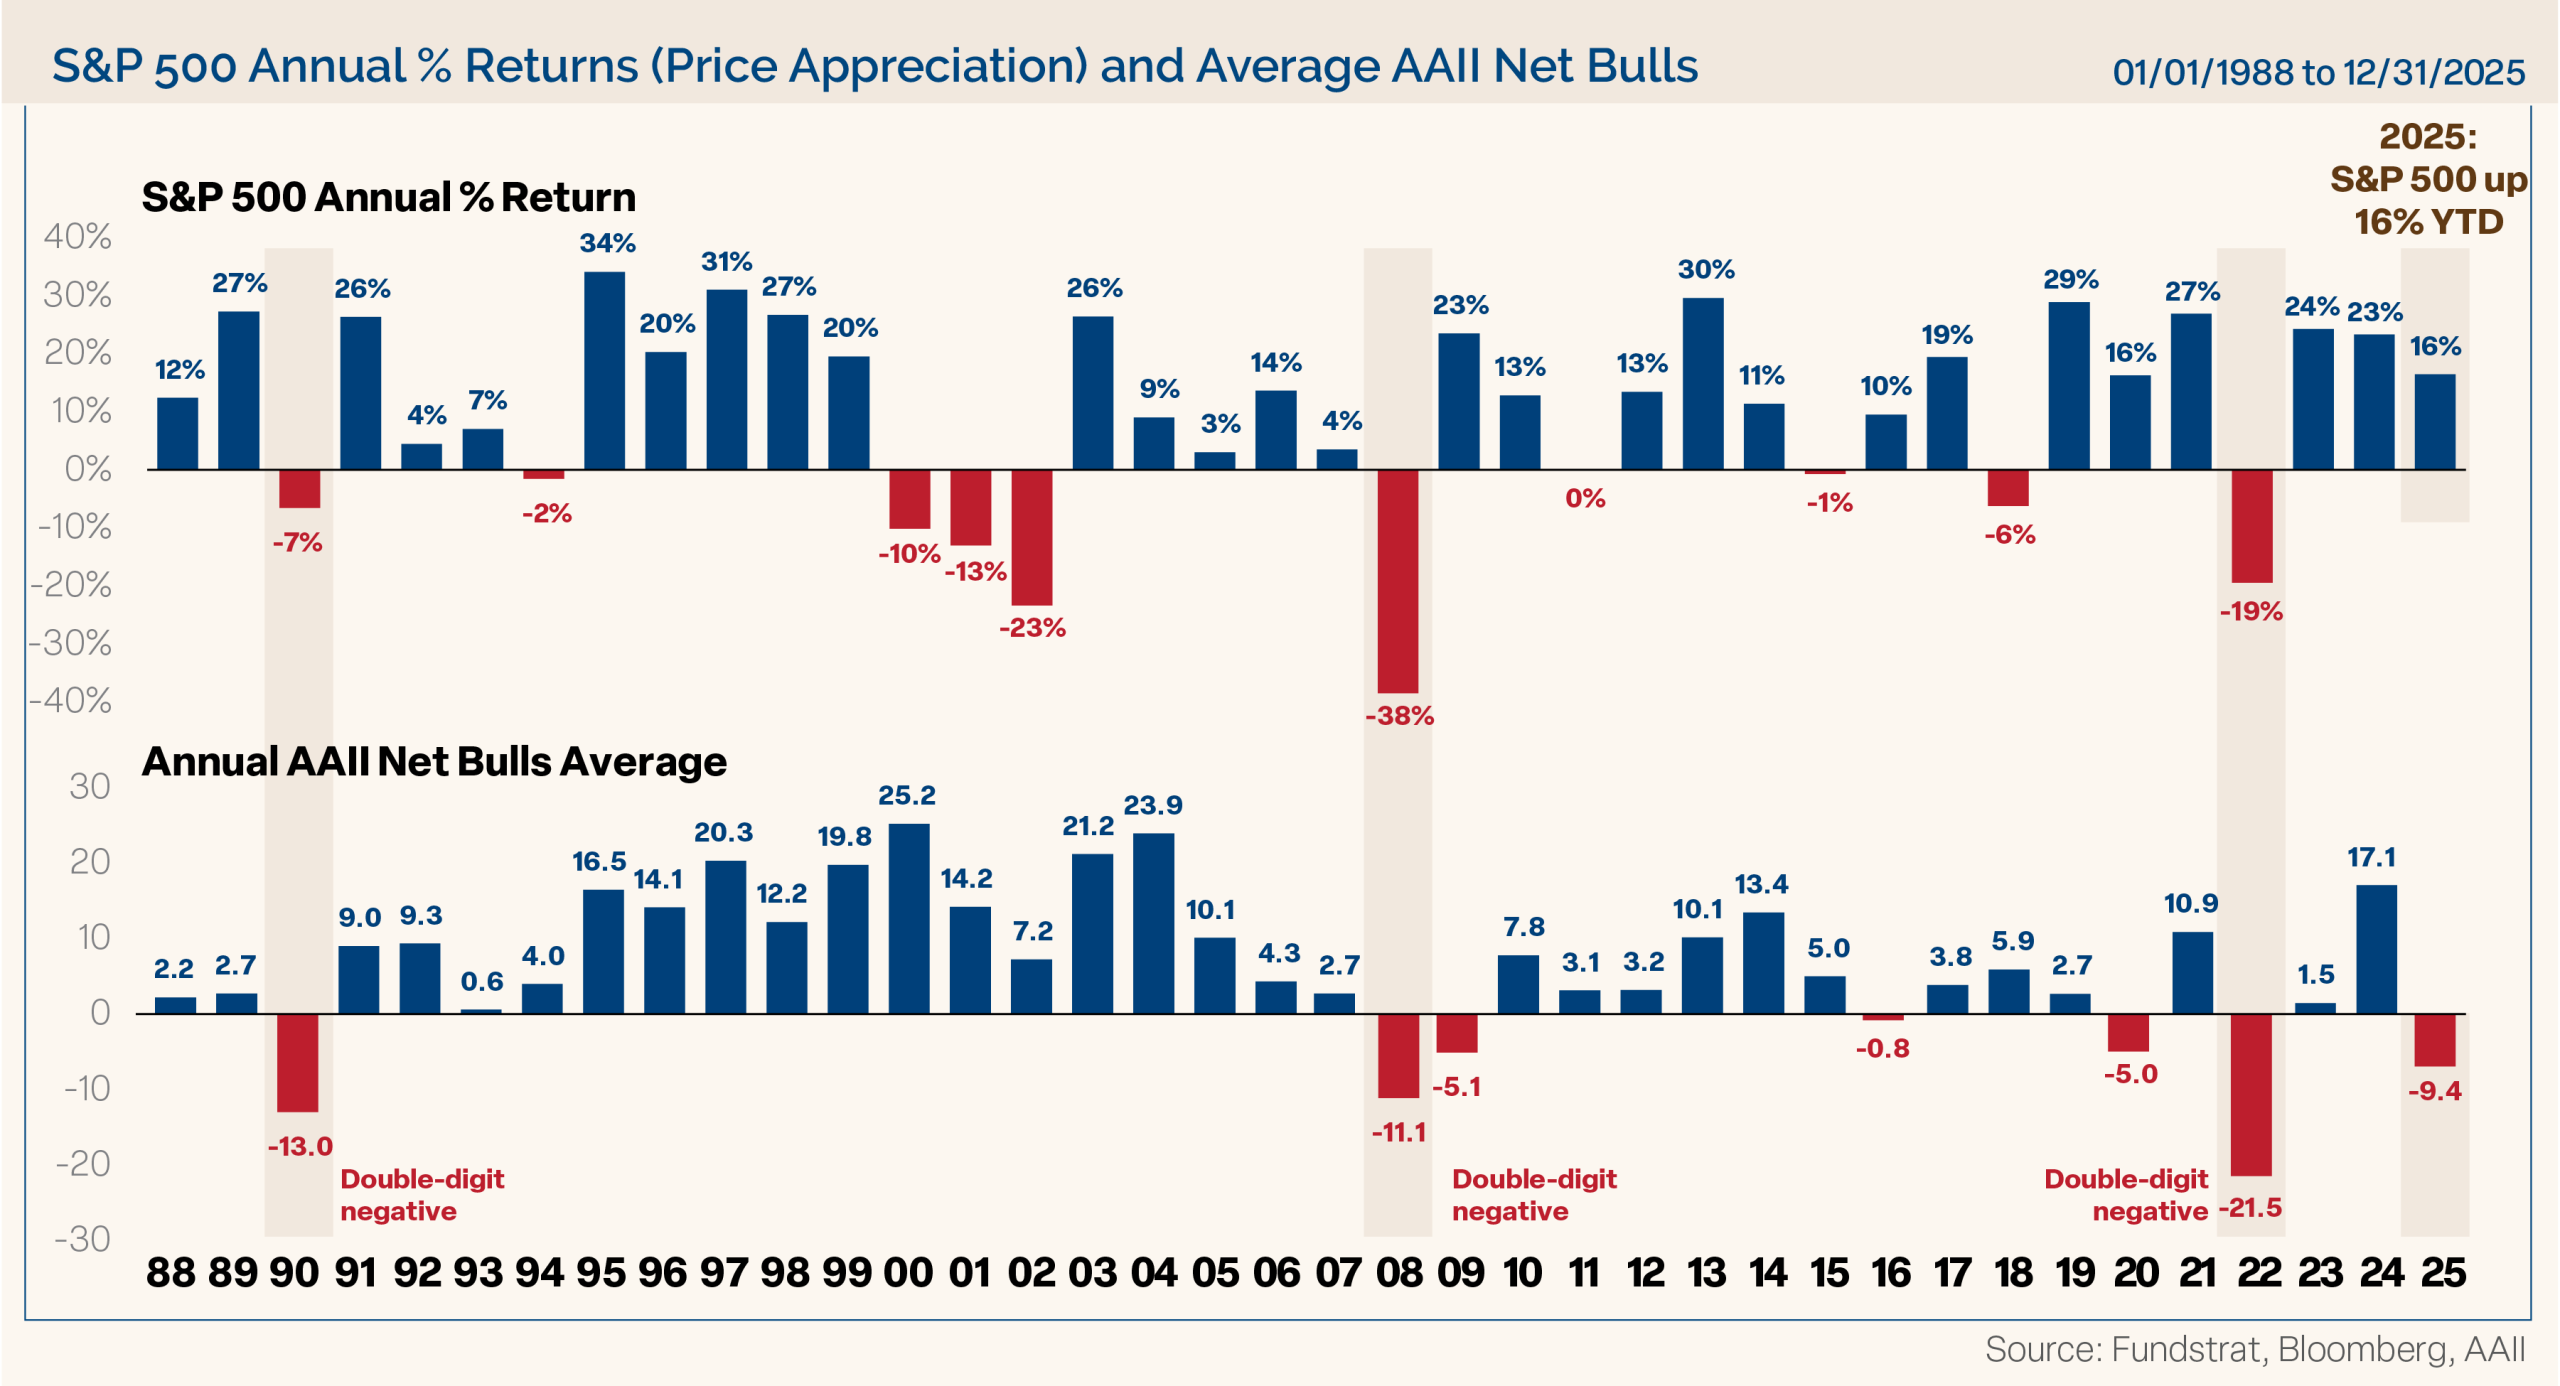
Figure 7 shows the S&P 500 annual price percentage gains dating back to 1988, along with the yearly average of bulls minus bears. Investors were bearish throughout the year for only the seventh time since 1988, with AAII averaging 9.4% more bears than bulls. Also noteworthy, only three years saw investors more bearish than last year, 1990, 2008, and 2022, all of which were large down years for the market. Last year was one of the most hated bull markets of all time, even as it set record high levels.
Figure 7
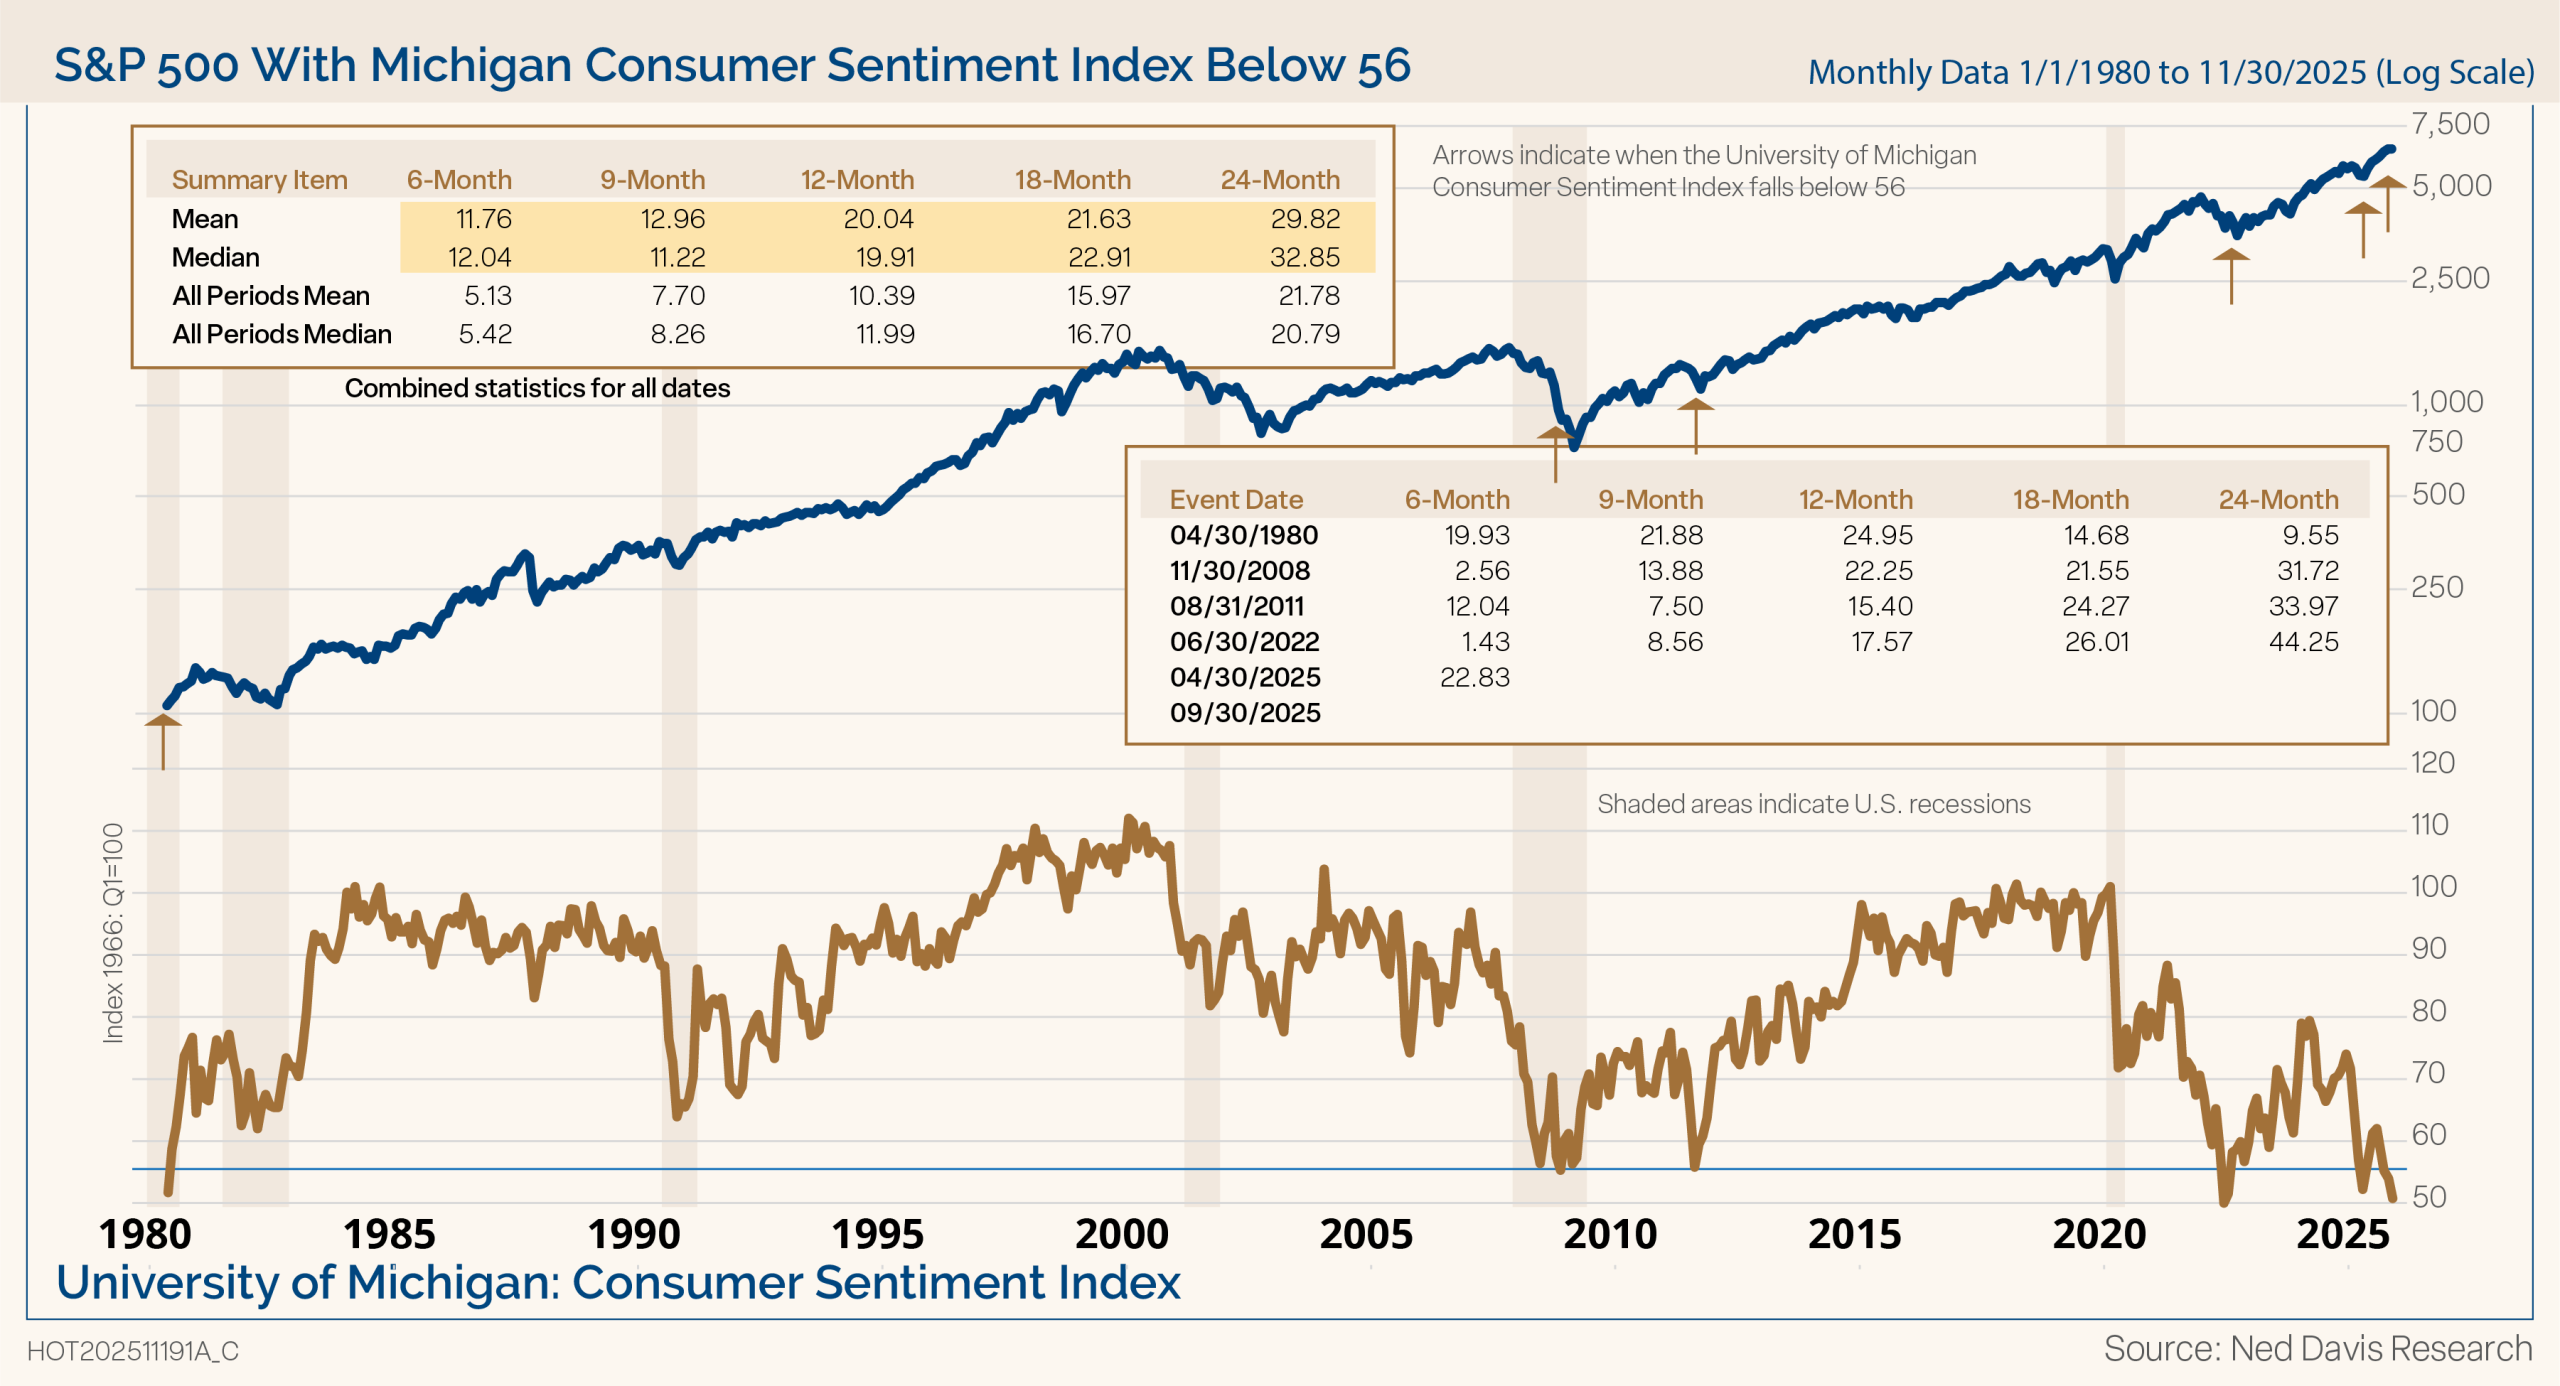
Another measure of crowd psychology is shown in Figure 8 is the University of Michigan Consumer Sentiment Index, which measures American consumers’ confidence in the overall economy and their personal finances, reflecting their feelings about current conditions, future economic growth, and their likelihood to spend. Consumers are overwhelmingly pessimistic, likely a function of the political climate and biases and a reflection of the K-shaped economy. Nonetheless, the market has been positive, and has posted above average returns six, nine, 12, 18, and 24 months later when consumer sentiment has been this low.
Figure 8
Cash Still on the Sidelines
A mountain of cash is sitting in money market funds, and it continues to grow seemingly to the sky. ICI data shows that total assets in money market funds reached a record $7.6 trillion, up from $6.8 trillion at the end of last year.
In the past we have said, “That is a lot of dry powder to potentially come off the sidelines. We certainly don’t expect it all to flow into the market, but around the margin there is a lot of cash to deploy into the market. The large amount of cash on the sidelines could help keep corrections in check.” It’s true today as it was before. Liquidity is abundant, and that is a positive factor for
the markets.
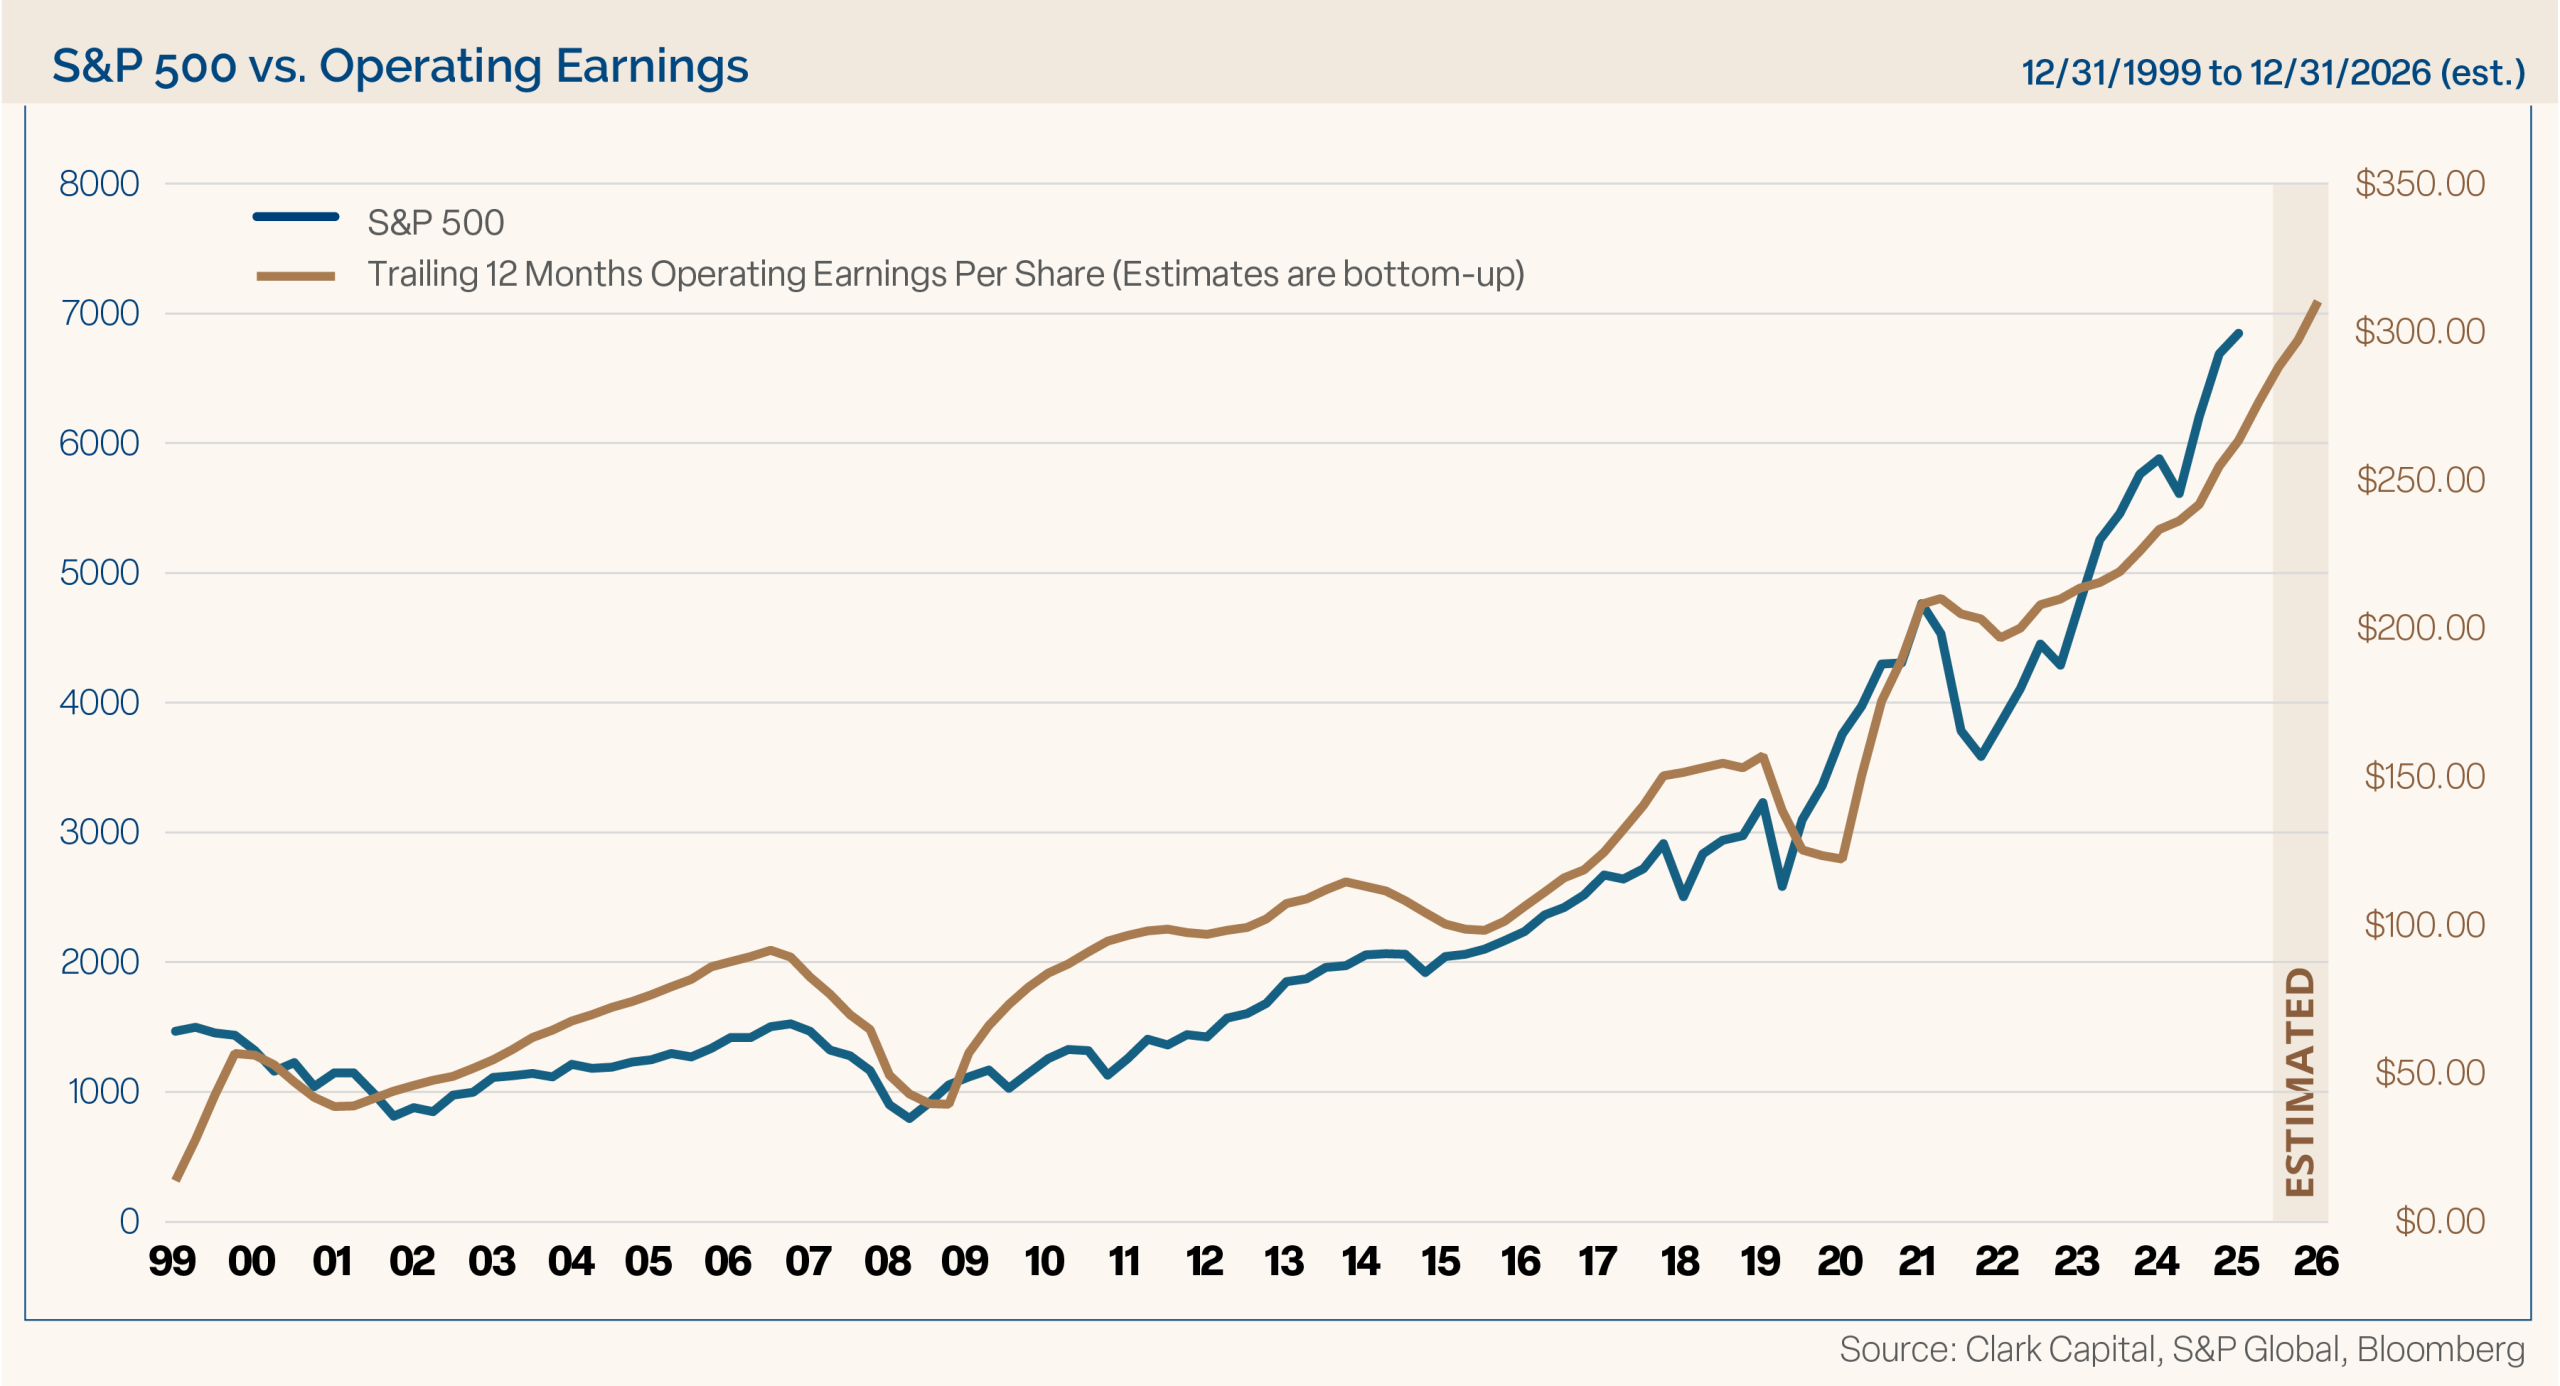
Earnings Growth Supports Further Upside
Let’s turn to earnings and valuations. In Figure 9, over time, stock prices and earnings growth are very correlated: economic growth generates earnings. Higher earnings have led to higher stock prices and in times of earnings decline, stock prices have followed suit. Earnings and stock prices have
been sprinting higher since the COVID lows.
Figure 9
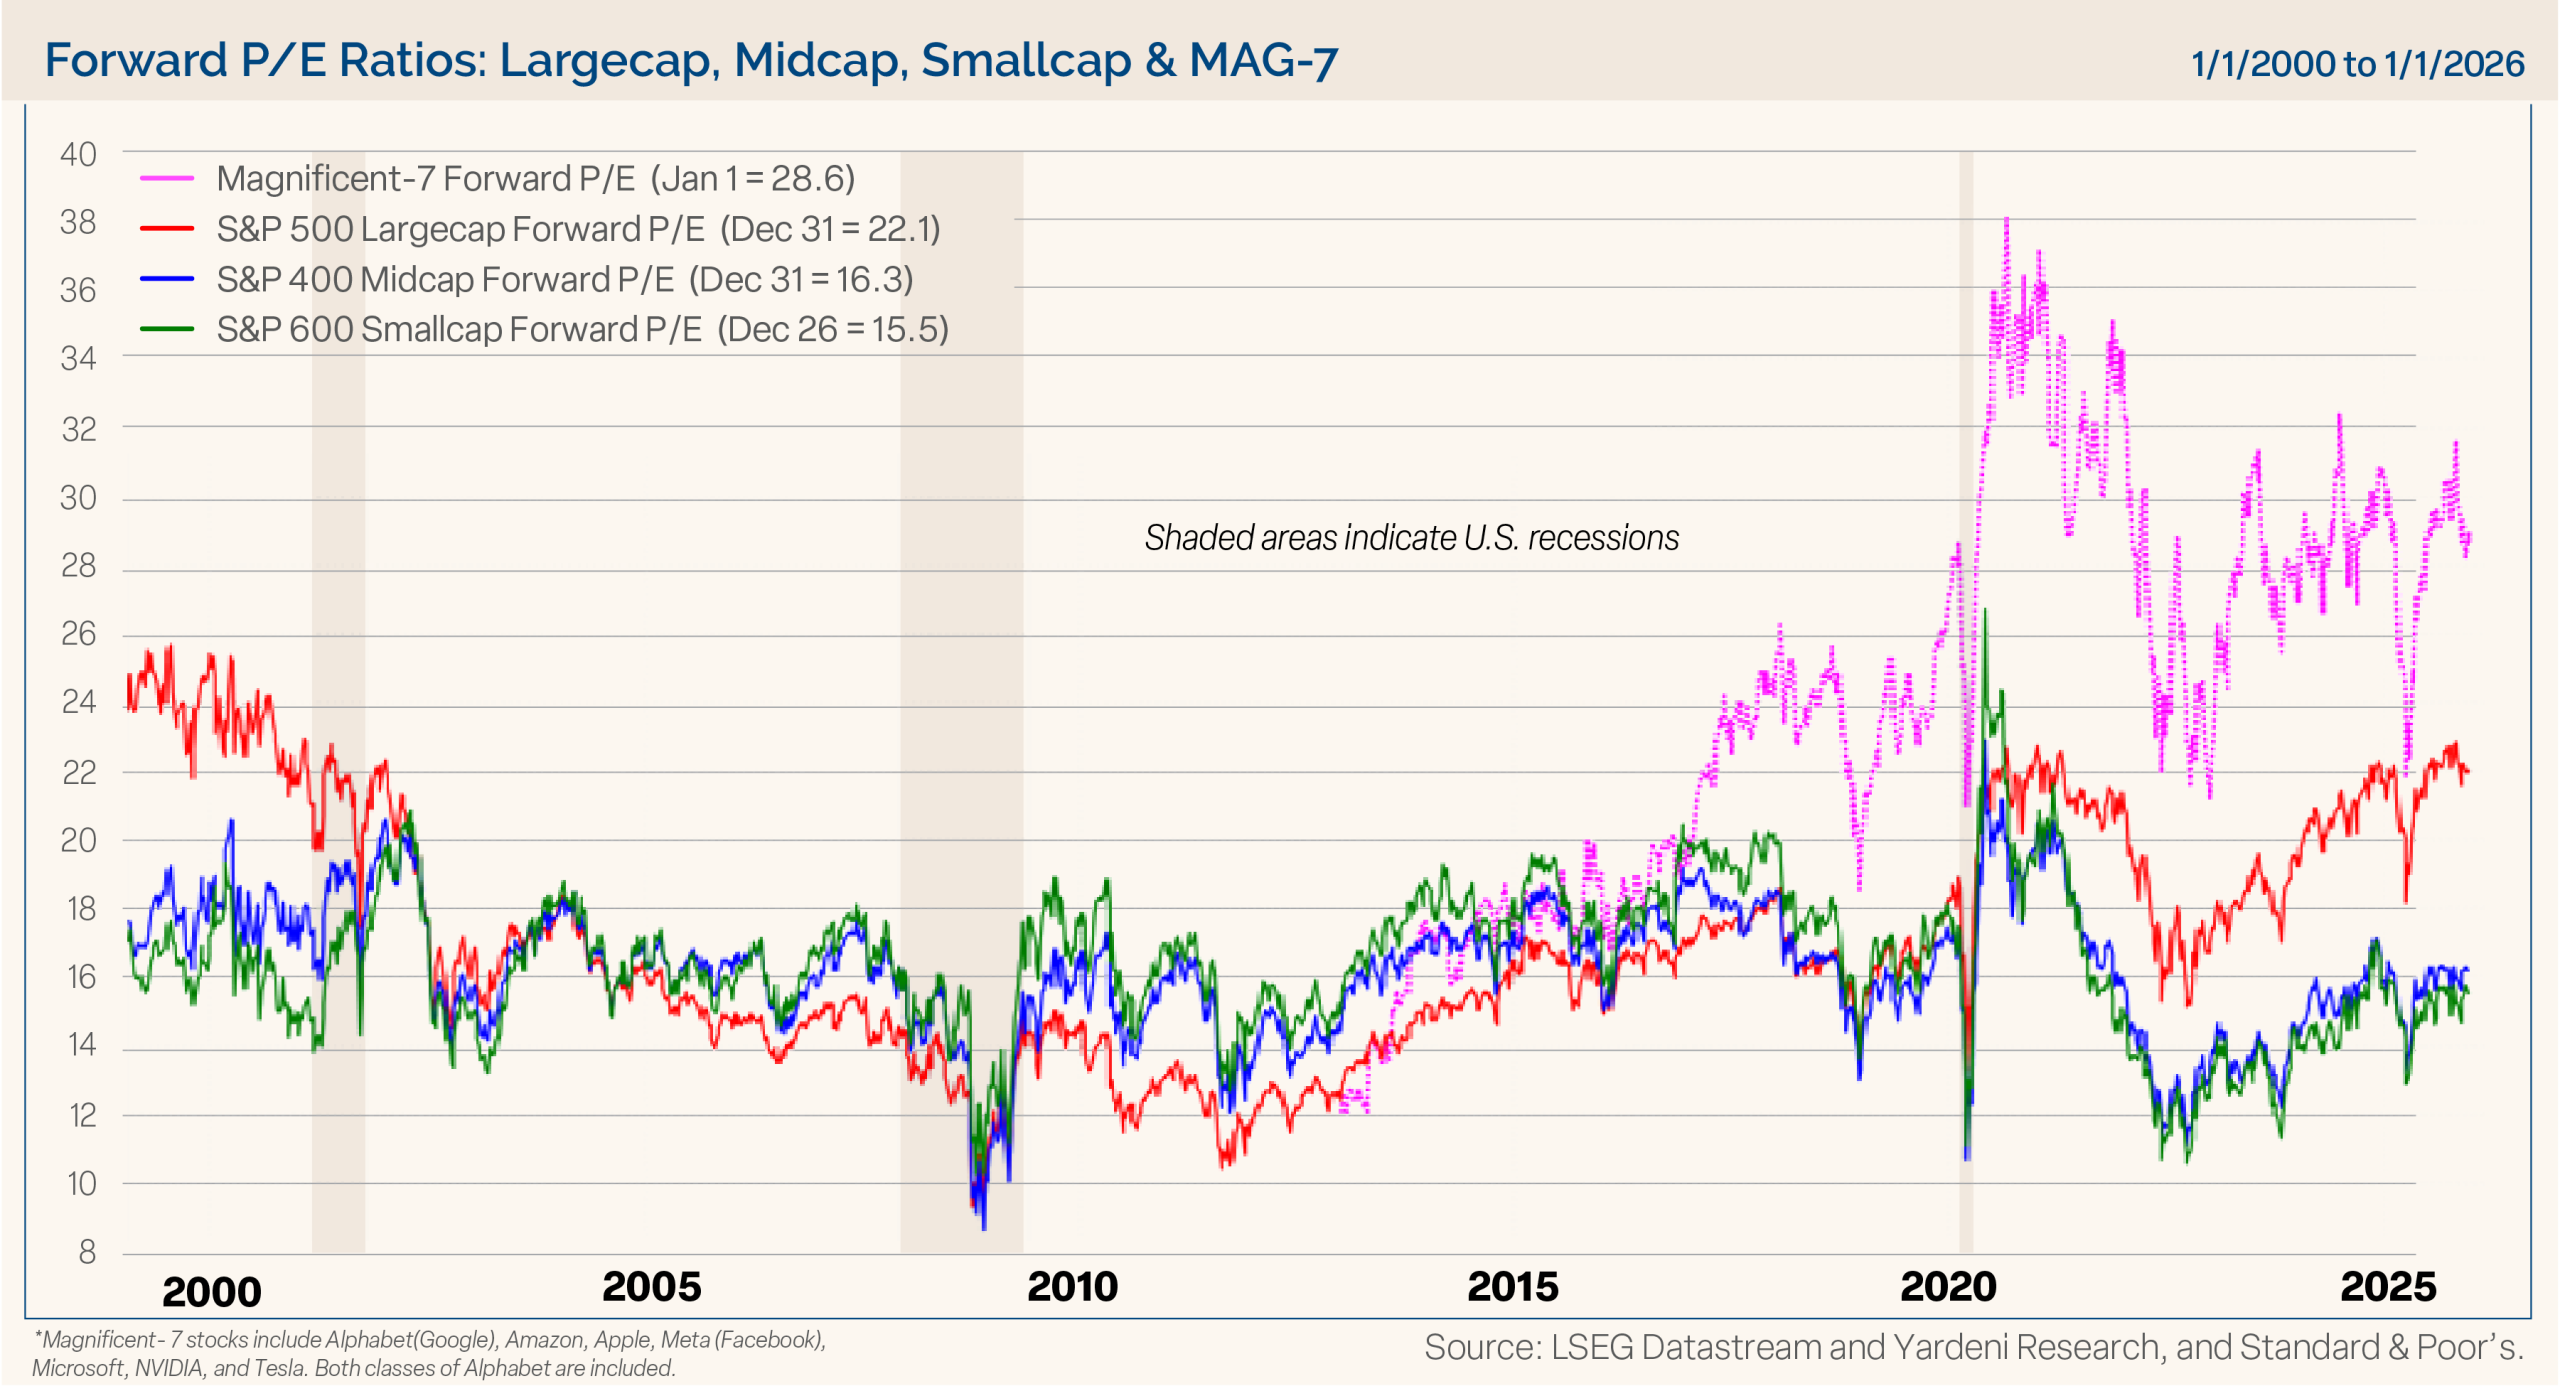
The valuation landscape is very nuanced. The market is expensive for large-cap stocks and much cheaper for mid- and small-cap stocks. As shown in Figure 10, the forward P/E of the Magnificent 7 is certainly down from its peak levels of the past several years, as earnings growth has outpaced stock prices. It’s even lower than in early 2025, but it still trades at 28 times next year’s earnings. The S&P 500 forward P/E is 22.1, trading at the high end of its recent range and right where it was at the beginning of last year. We know valuations are a very poor timing tool, as the market can stay rich for extended periods, but they do tell us that risks are elevated if earnings growth doesn’t materialize.
Figure 10
Broadened Participation May Extend the Market Run
The market has broadened out from the mega-cap technology stocks dominating the performance ranks, with participation and outperformance in recent months from the likes of large-cap value, mid-cap stocks, and small-cap stocks, which have a valuation advantage. For example, mid-cap and small-cap stocks trade at a 26% and 30% discount to the S&P 500, respectively. Broadening participation across other styles, market caps and sectors, other than just the mega-cap technology monopolies, is a welcome development for extending the cyclical bull market.
With extended valuation for large-cap stocks, continued earnings growth is key for additional gains. The outlook for S&P 500 earnings remains solid for the year ahead. Bottom-up industry analysts expect S&P 500 earnings per share to rise 15.6% in 2026 to $313.84. For 2027, they are forecasting $359.44. We expect slightly more modest earnings growth and are forecasting $310 and $350 for the two years, respectively.
Given that valuations are at cycle highs, we don’t expect more multiple expansion. Therefore, earnings growth will be the primary driver of further gains for the market moving forward. Applying a forward P/E multiple of 22 to our expected S&P 500 earnings per share of $350 in 2027, implies a 7700 target at year end. That represents a 12.5% gain from where it closed 2025.
Staying with valuations, international markets are trading at a steep discount to the U.S. The MSCI ACWI ex-U.S. Index forward P/E is 30% less than that of the S&P 500, not surprising given that in 12 out of the past 15 years, the S&P 500 outperformed the broad international index. Last year’s advantage went to international stocks, with most of the outperformance occurring during the tariff volatility. Nonetheless, given the valuation difference and weaker U.S. dollar, we think developed and emerging international markets may be primed for more outperformance.
A Dovish Fed Remains Supportive
Art Cashin, a former floor trader on the NYSE, was a fixture on CNBC and was known for saying, “Bull markets don’t die of old age, they’re killed by the Fed.” The Fed is dovish, which offers support and a Fed put to risk assets.
The Federal Reserve eased overnight rates again in the fourth quarter, lowering the fed funds rate by 0.25% at each of its October and December FOMC meetings. Since policy turned dovish in 2024, the Fed cut rates by 100 basis points (bps) in 2024 and 75 bps in 2025, for a total of 175 bps. The impetus for resuming rate cuts after pausing earlier in the year was a continued disinflationary trend and glidepath lower toward the Fed’s inflation target. After the December meeting, the DOTS plot shows the Fed expects to cut rates only once in 2026. However, the market is projecting between two and three cuts. Given recent lower than expected inflation and weaker labor market, we put higher odds on three cuts than the Fed’s own projection. The Fed is dovish. It ended QT and will start buying $40 billion of T-bills per month. That move is supportive of the market as it injects liquidity.
Don’t fight the Fed.
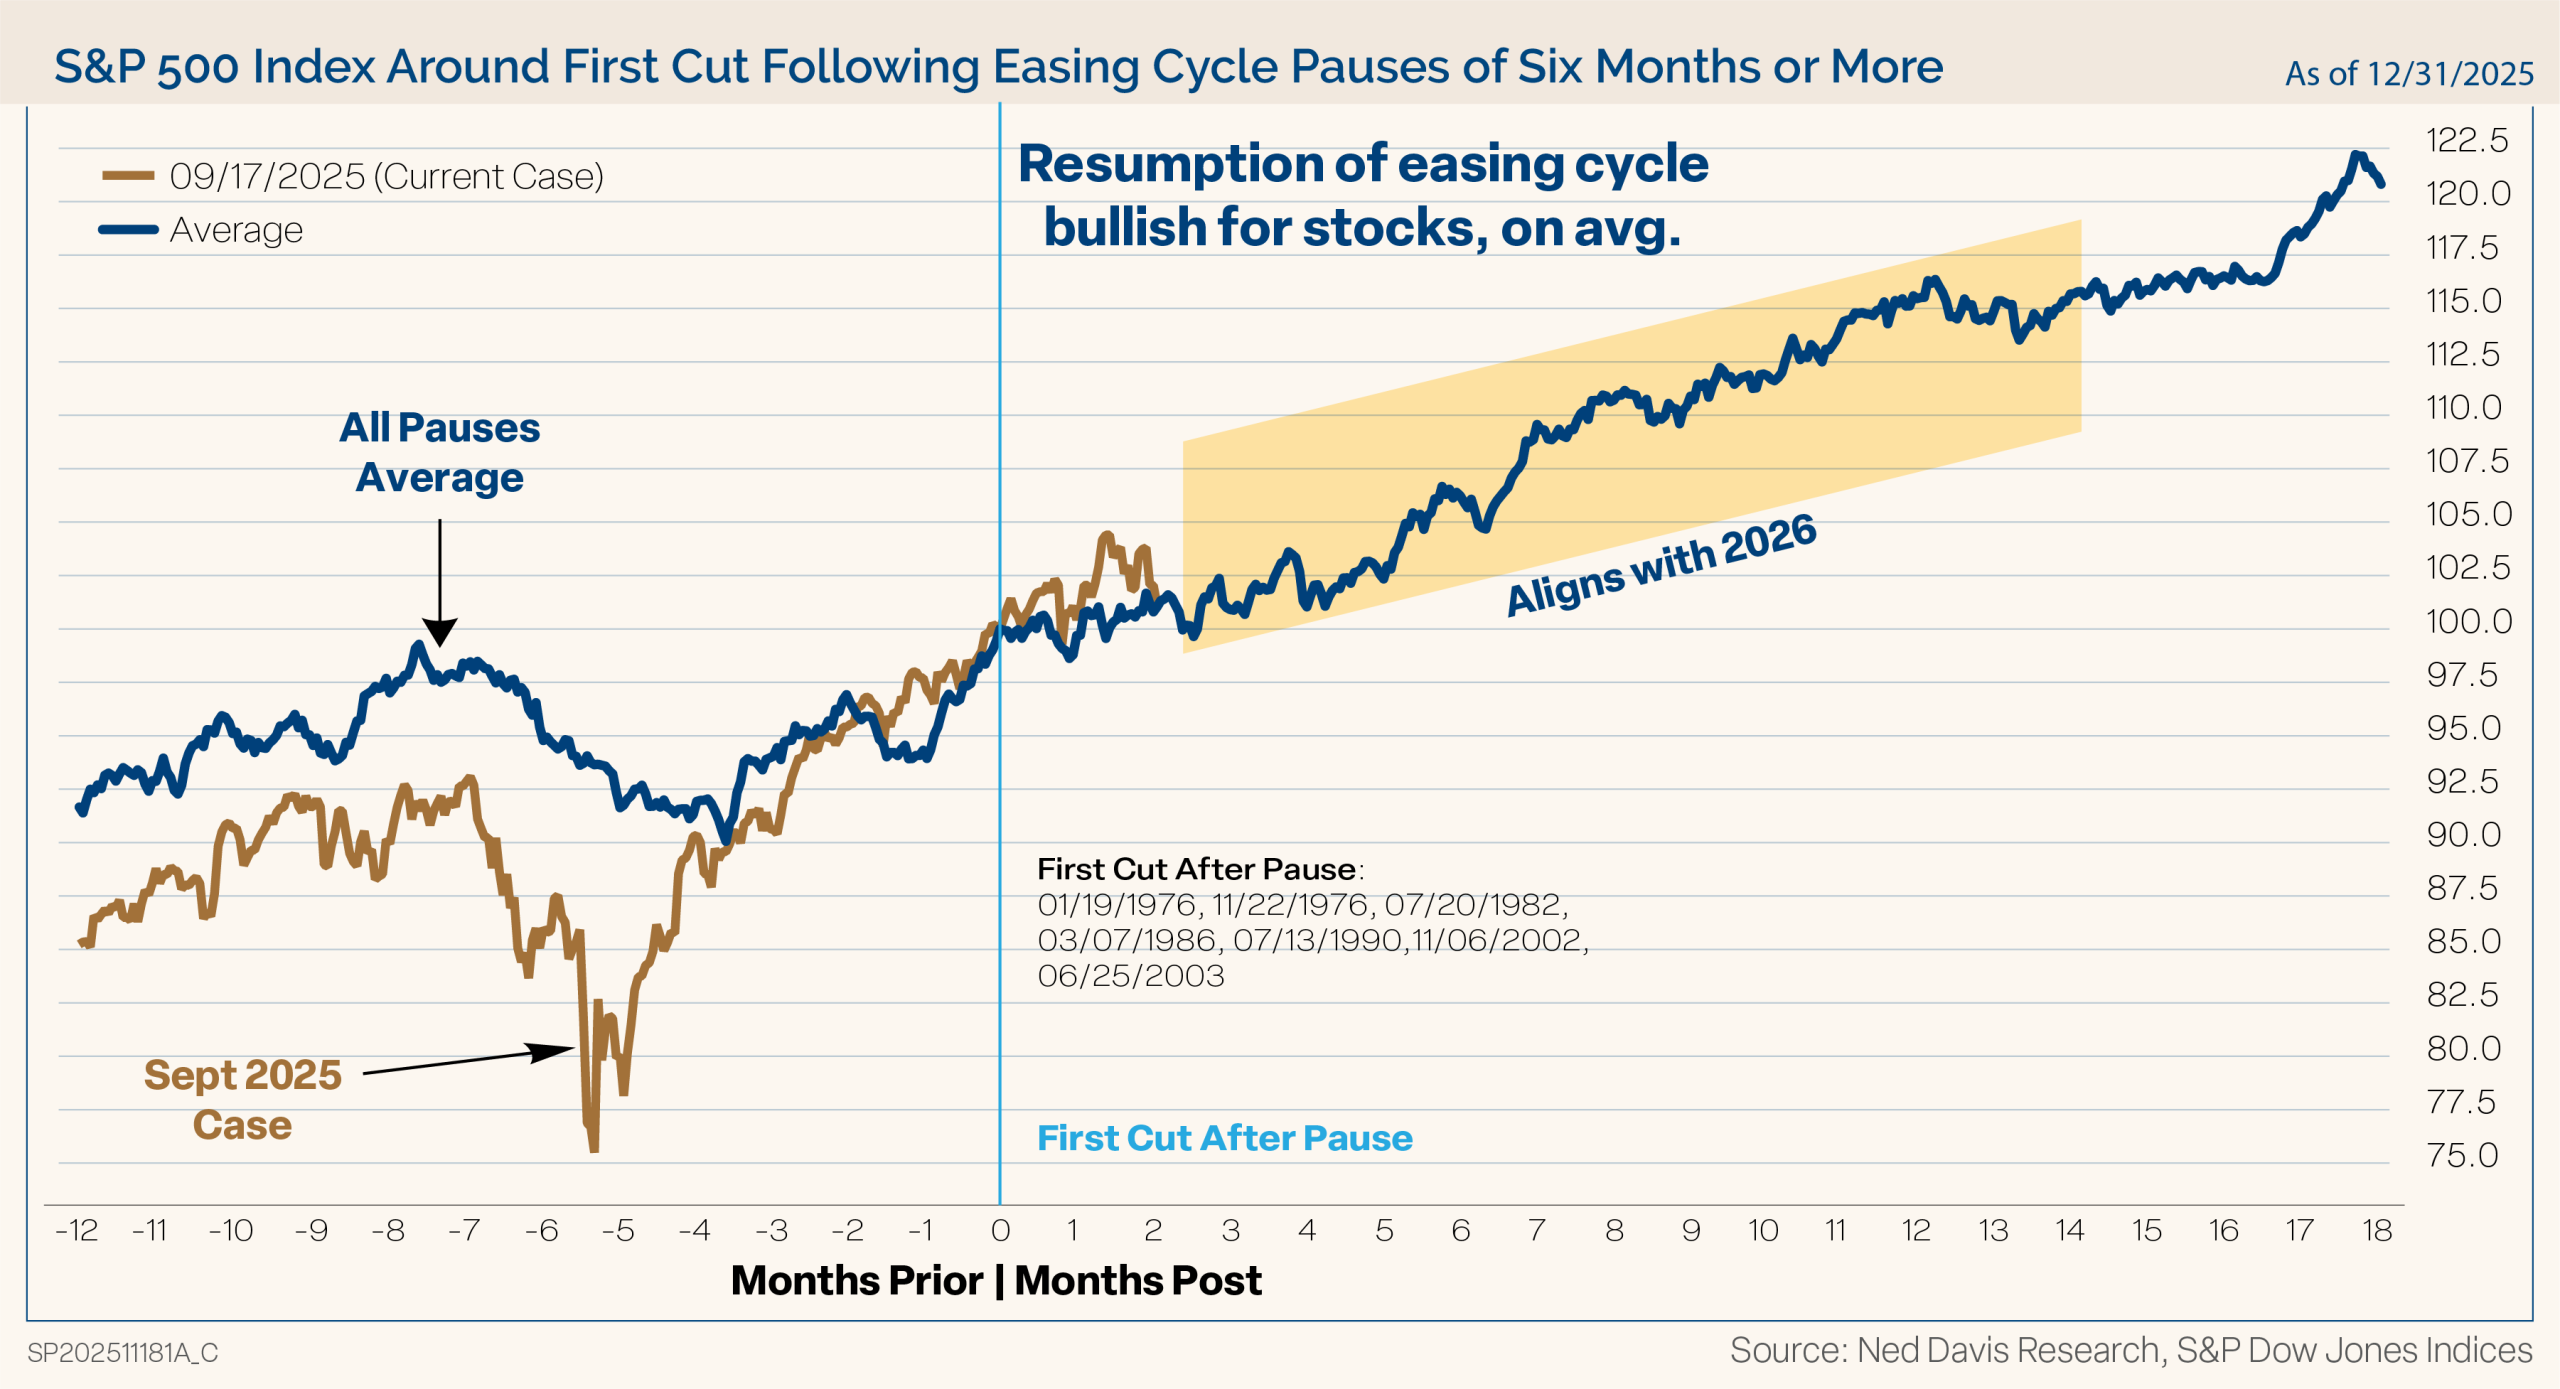
As demonstrated in Figure 11, rate cuts after long pauses have been bullish for stocks. In the past seven cases, the S&P 500 has gained 14.1% in months 3–15 after the end of Fed pauses of at least six months in easing cycles. The two cases when the market fell after the Fed restarted cutting rates were in 1976 and 1977, when policy proved to be too dovish under Arthur Burns. The risk to the bullish monetary backdrop would be if the new Fed chair is perceived to be caving to political pressure. Challenges to Fed independence are a real potential risk. That risk is more now than ever, with the Justice Department serving the Federal Reserve with grand jury subpoenas regarding the renovations of the Fed’s headquarters. Fed Chair Powell said, “This is about whether the Fed will be able to continue to set interest rates based on evidence and economic conditions — or whether instead monetary policy will be directed by political pressure or intimidation.” The unprecedented move by the Trump administration marks an escalation of Trump’s longstanding feud with the Fed chair.
Figure 11
We will have a new chair in May, or sooner, when Powell’s term as chair expires. At present, prediction markets are virtually evenly split between the new chair being either Kevin Hassett or Kevin Warsh. Either way, the market historically challenges new Fed chairs with an average maximum drawdown of 14.8% in the first six months of the new term. The last three drawdowns were milder for Powell (-8.5%), Yellen (-3.8%), and Bernanke (-8.0%). We expect to see a correction in the second and third quarters, and this could be a catalyst. The depth of the drawdown likely depends on the independence of the Fed after the transition.
AI Investment Is Structural, Not Speculative
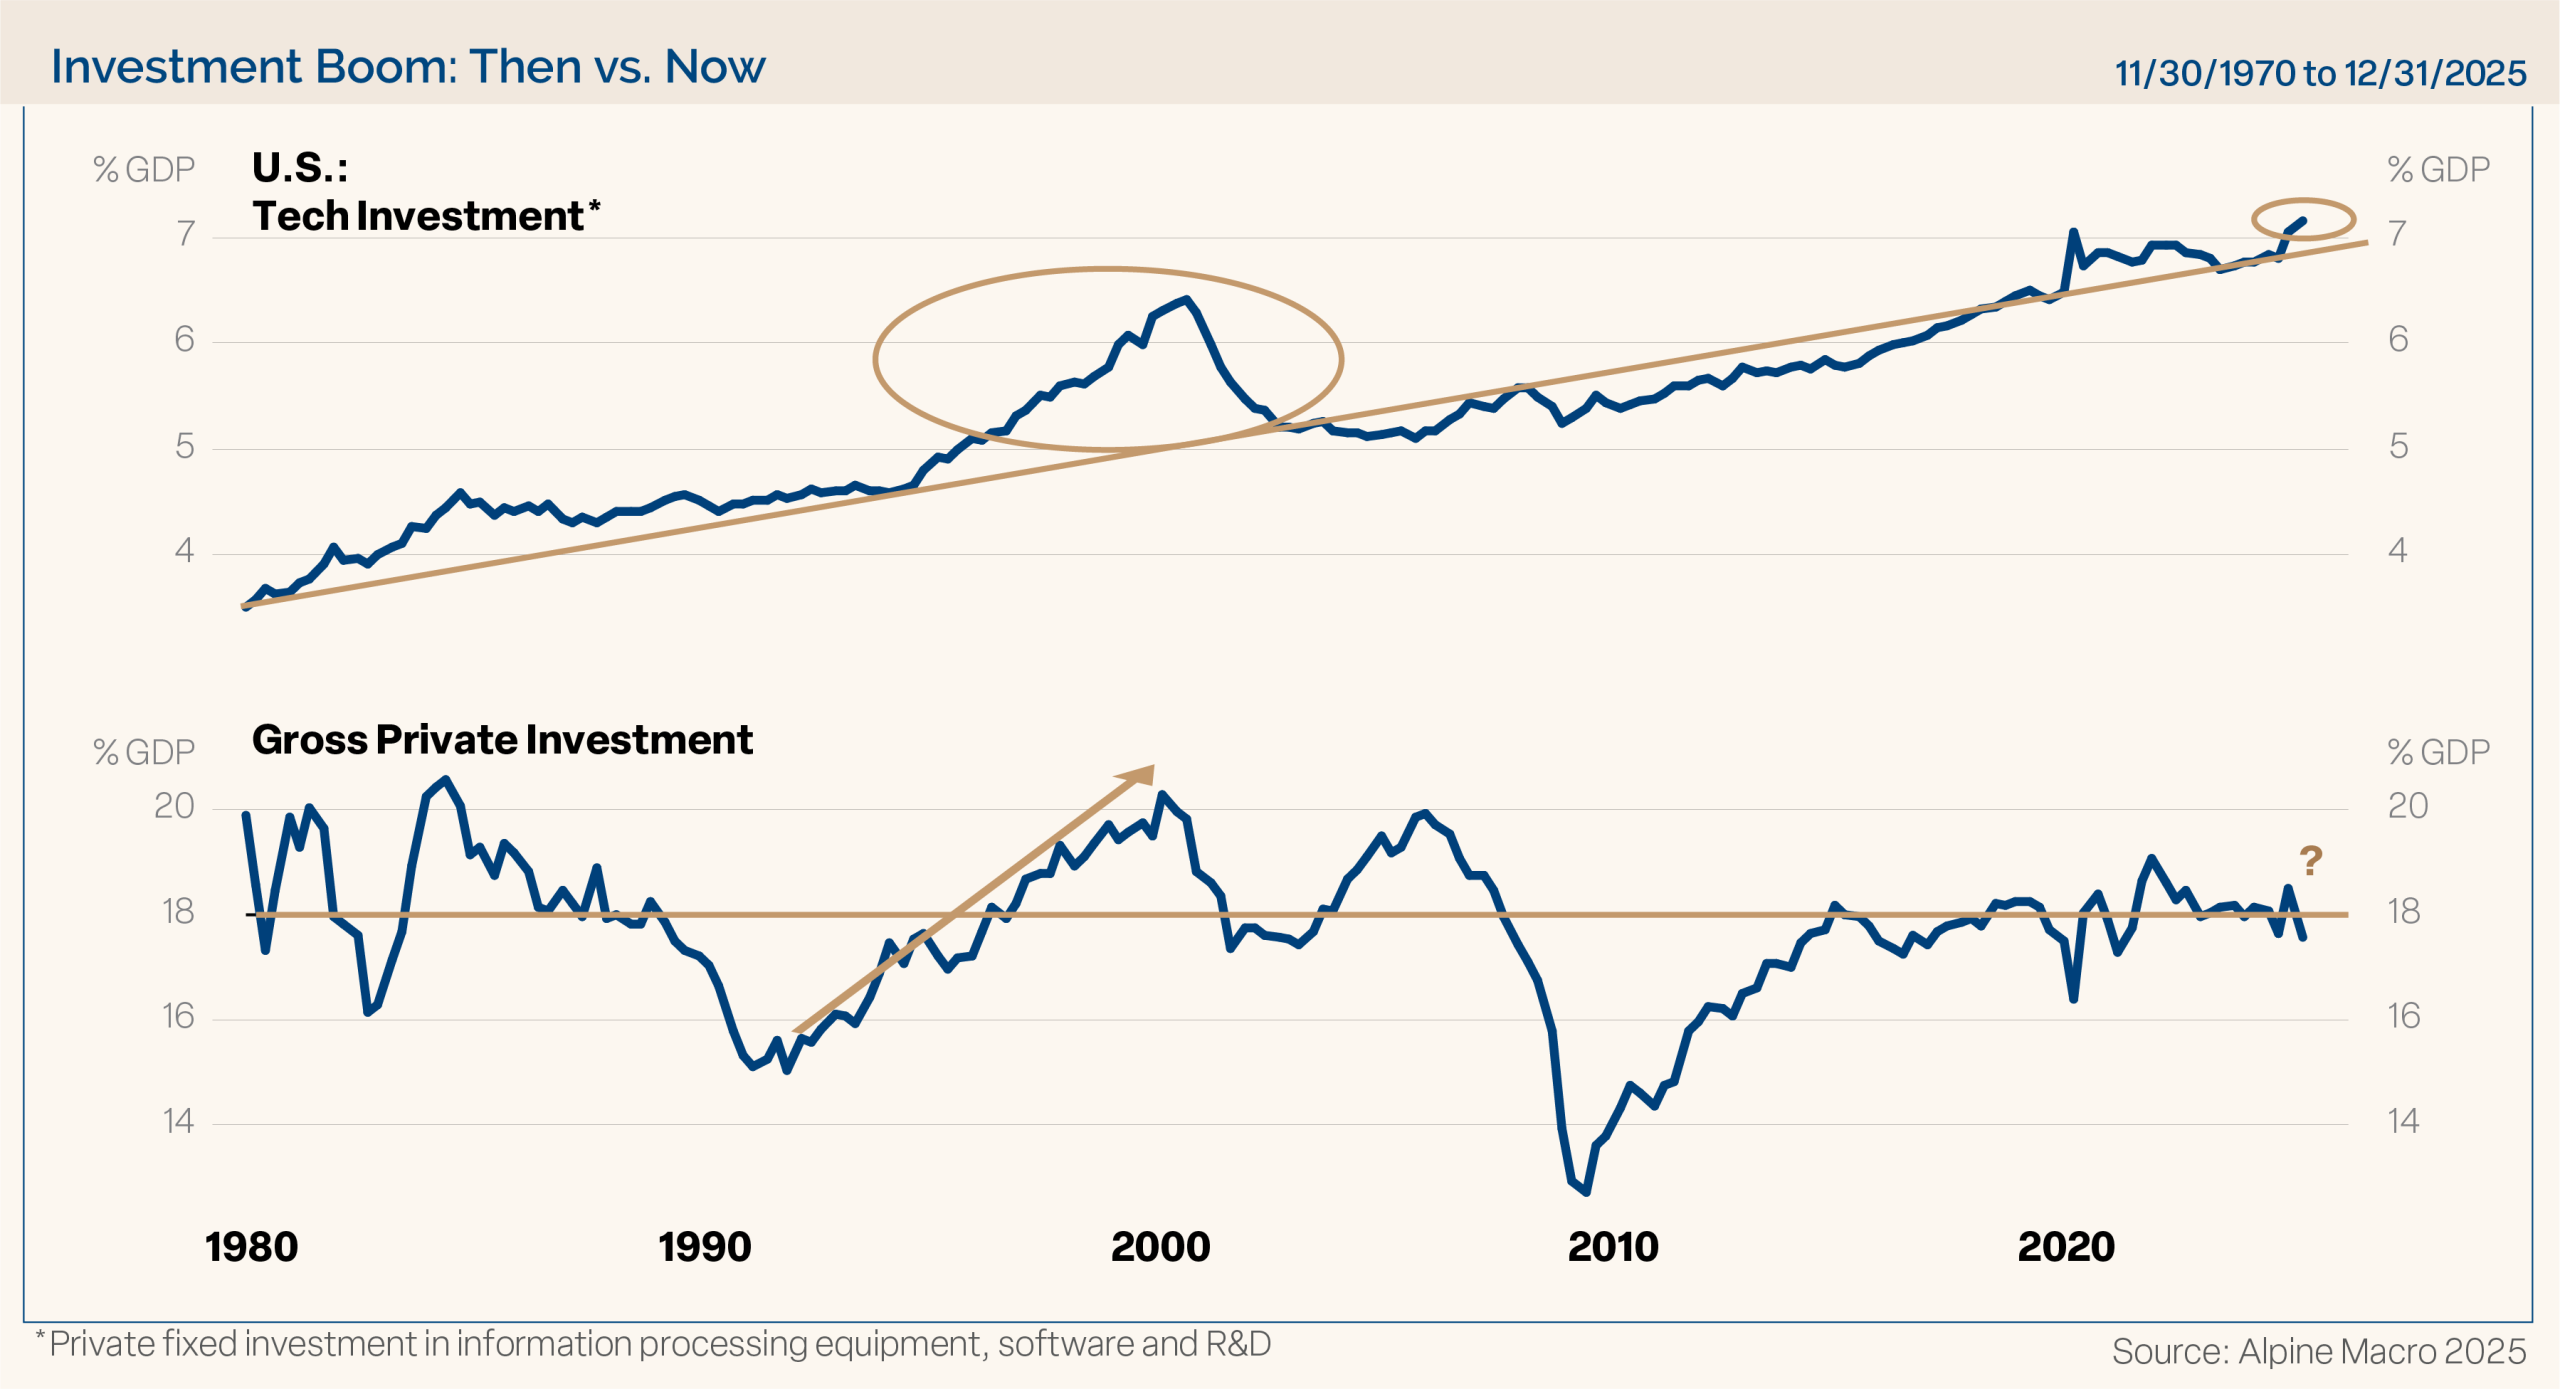
A hot topic of debate is whether we are in an AI bubble, like the tech bubble in the late 90s. Our take is no. Instead, there is a bubble of bubble talk. Shown in Figure 12, today’s technology investment is closer to trend spending growth than it was during the tech bubble, and private investment as a percentage of GDP is nowhere near the bubble territory of the late 90s. In addition, the technology companies leading the charge on AI are massively profitable and show no sign of deteriorating.
Figure 12
Furthermore, technology is driving productivity across the economy, improving margins and driving earnings growth. Fed Chair Powell recently stated, “I think AI makes people who use it more productive.” It’s widely understood that higher productivity raises living standards for the workforce and improves the economy. We believe productivity-led growth should reduce unit labor cost inflation to 2.0% this year, bringing consumer price inflation down toward the Fed’s to 2.0% target over the long run.
Disinflation Continues While Inflation Expectations Remain Anchored
Inflation remains top of mind for consumers and investors, especially as affordability dominates political talking points. Tariffs will continue to be an issue that many fear could keep inflation above the Fed’s 2% long-term target, but there has been less evidence of pricing passthroughs than initially expected.
Inflation has dramatically declined. As shown in Figure 13, CPI has nearly completed a round trip from its pandemic low of 0.2% year-over-year in May 2020, to a peak of 9.0% in June 2022, and back down to 2.7% in December. About 70% of the inflation over the past three years has been housing, auto costs, and auto insurance, all of which are now deflating. The item with the most impact and longest lag is shelter costs. Those are set to continue moderating as vacancies are up and rental rates are declining. Energy costs have also come down massively with oil now at $57 per barrel, down from $80 last January and a peak of $122 in 2022. In addition, the national average of gasoline prices fell to a five-year low of $2.81 per gallon from a peak of $5 in 2022.
Figure 13
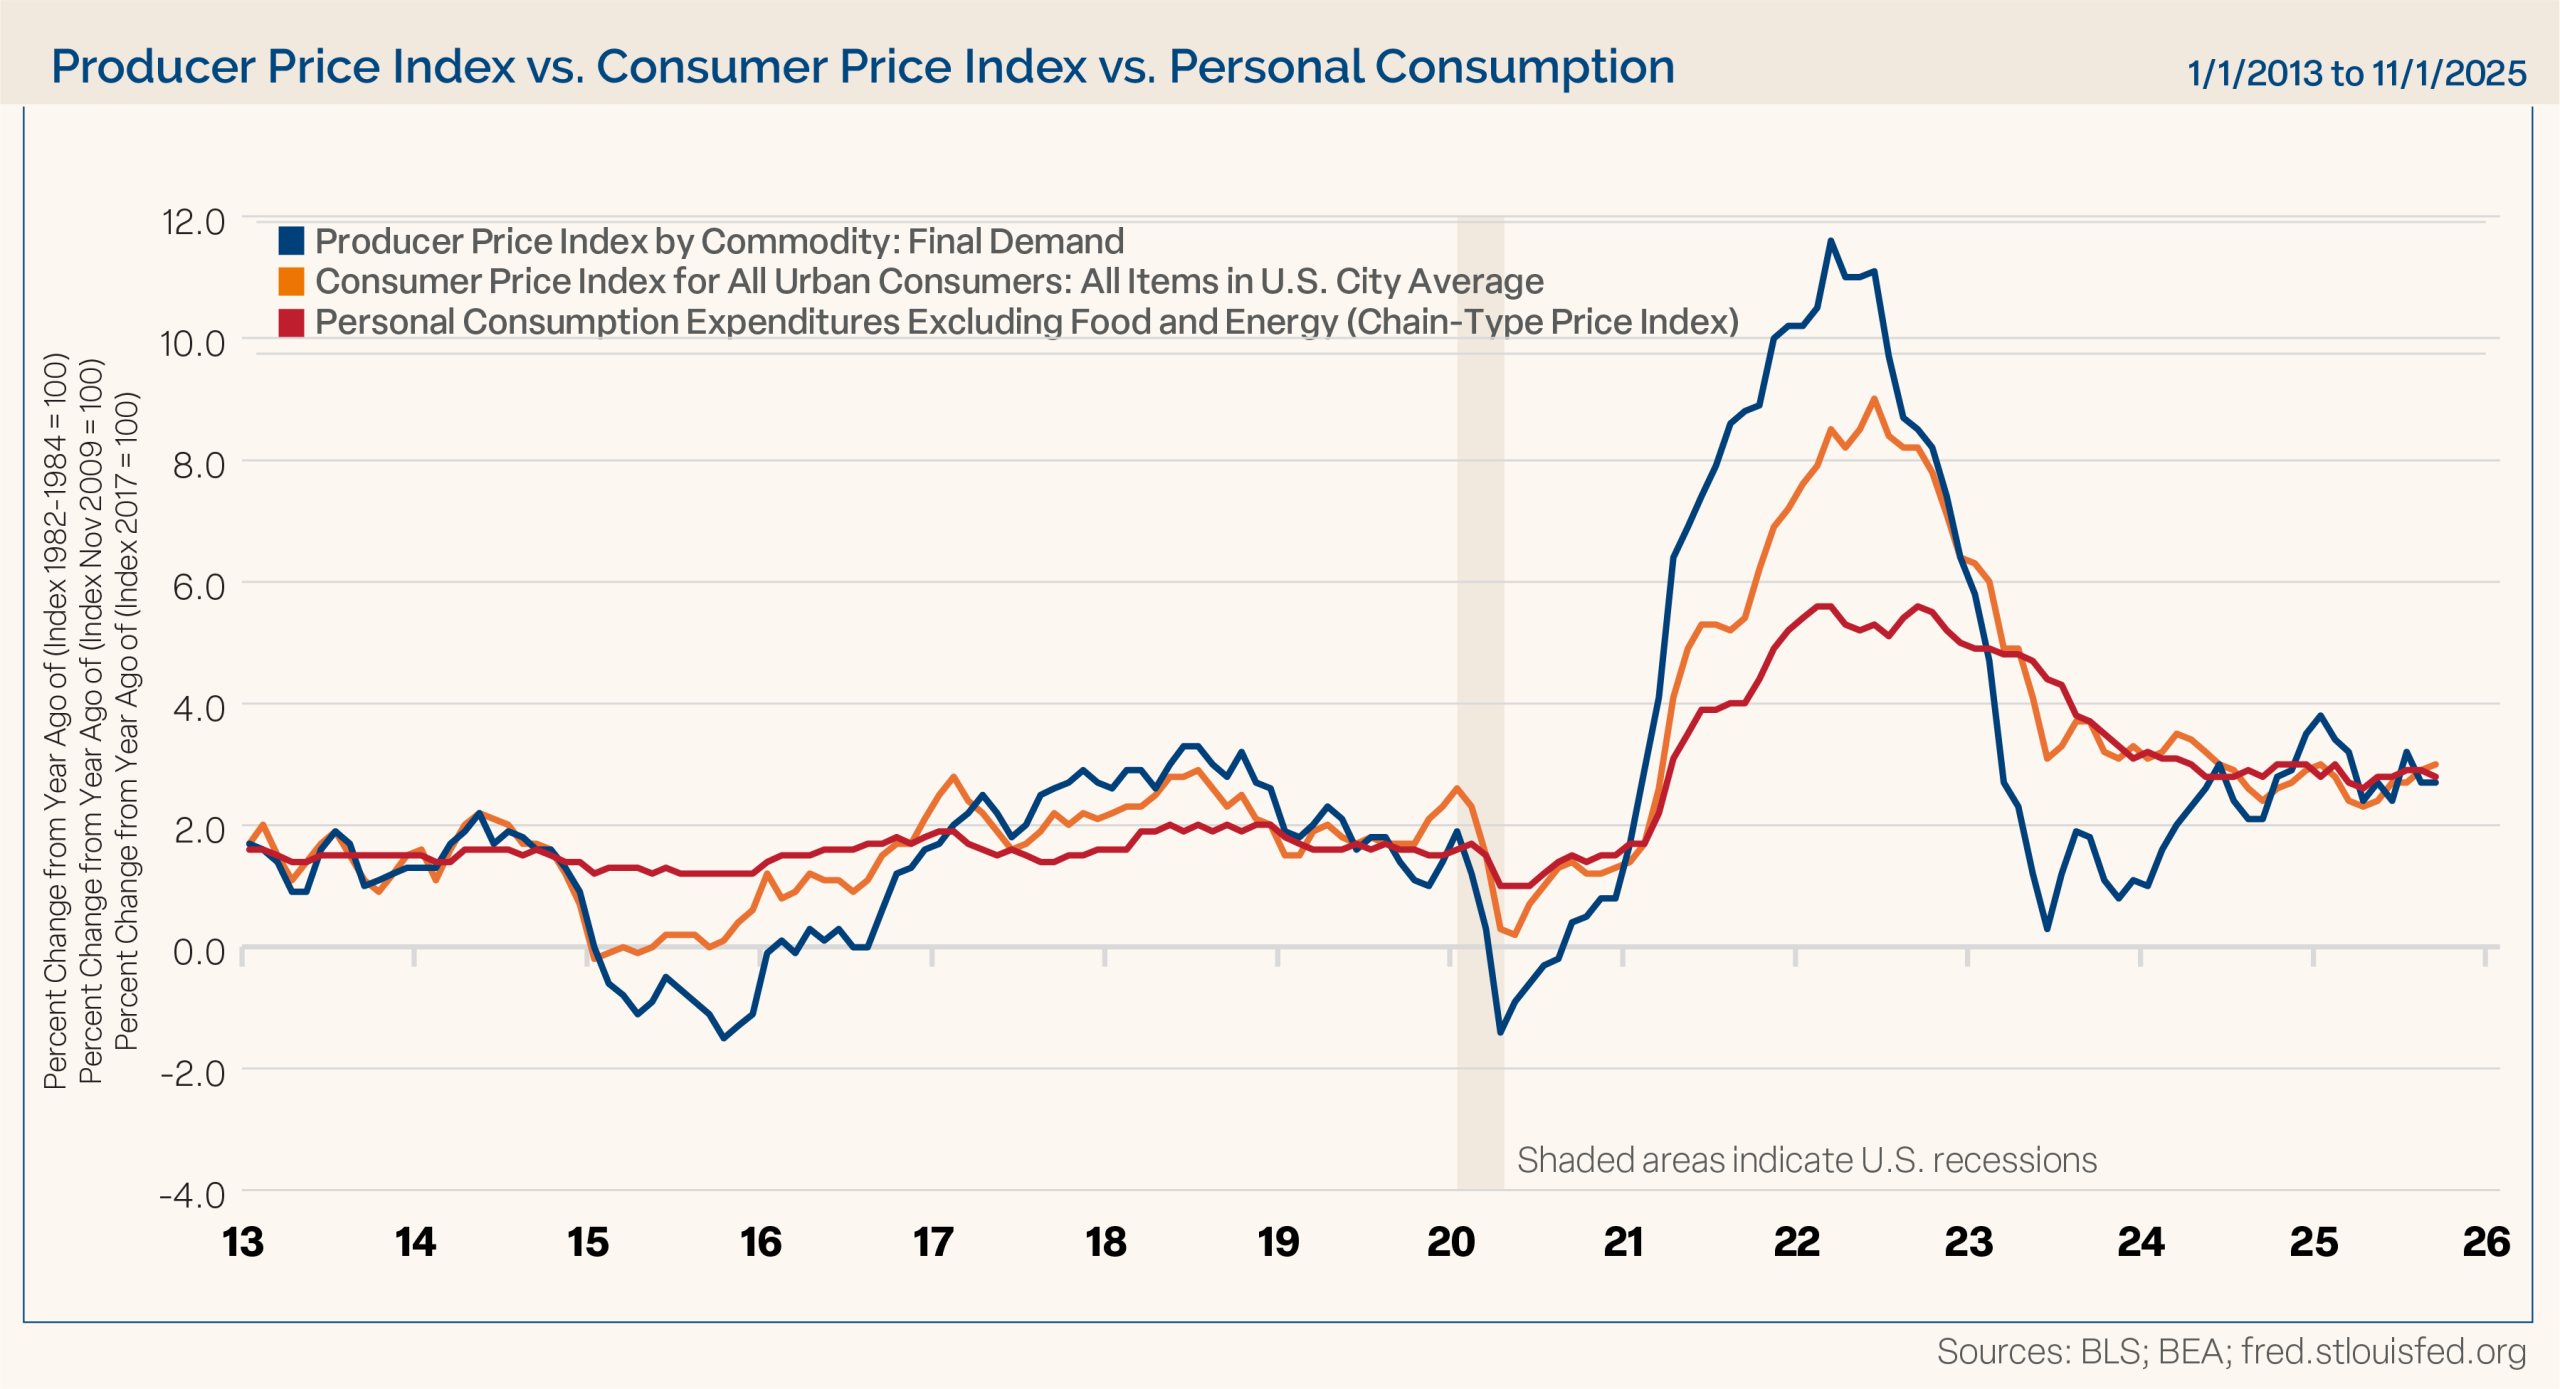
We expect all these factors to continue putting downward pressure on inflation as we move through 2026. In our past several outlooks, we discussed that we thought inflation was on a glide path lower toward 2.0%. It wouldn’t be straight line lower, and we didn’t expect a bout of echo inflation, as there was more disinflation in the pipeline. So far, those trends have played out.
Meanwhile, inflation expectations have been stable to lower in recent months across the board. Inflation expectations over five, seven, 10, 20 and 30 years are anchored near 2.25%. Stable or falling inflation expectations should give the Fed comfort to maintain a dovish bias.
Easy Financial Conditions Support Credit
Turning to credit, there is no stress, financial conditions are easy, and abundant liquidity provides a supportive backdrop. The economy continues to surprise to the upside, and corporate America balance sheets are in solid position with record high profits. As such, our models continue to favor credit as the new year begins.
Across the credit spectrum, agency, mortgage backed, investment grade, and high yield spreads are near record lows, demonstrated in Figure 14. With spreads this low, we don’t expect to see much more compression. Returns moving forward will likely be more from coupon, with maybe a slight boost from price appreciation if yields fall.
Figure 14
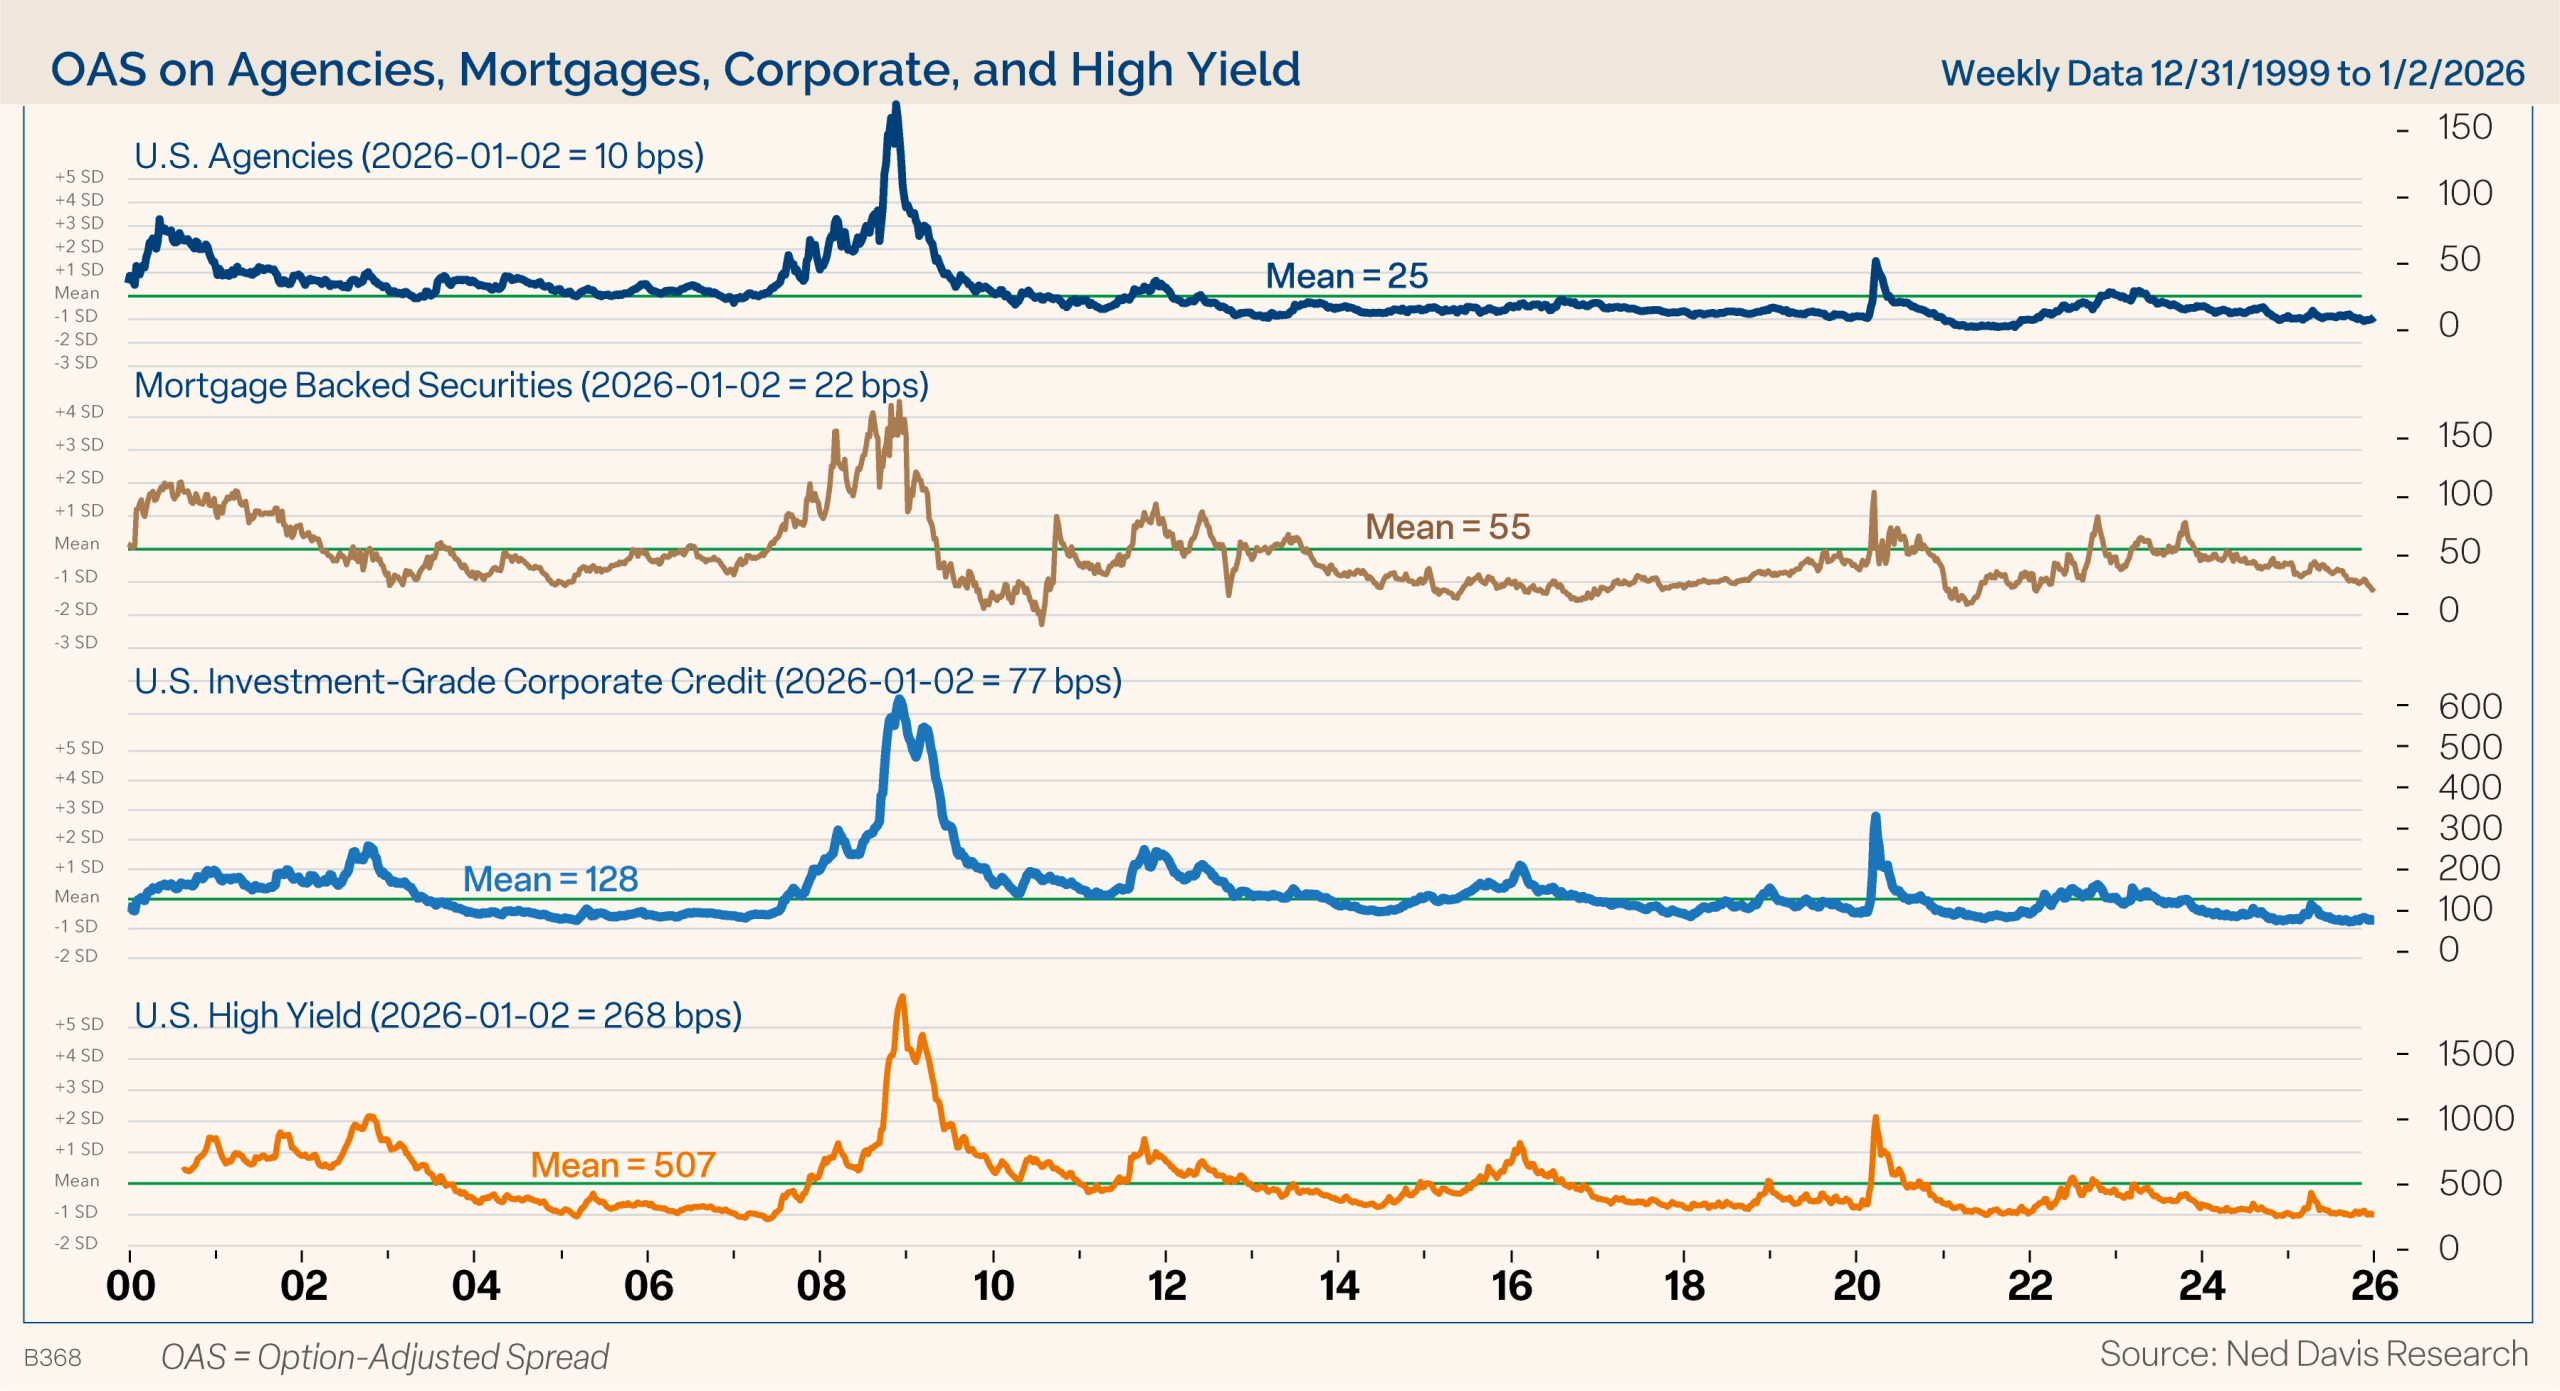
The story for credit in 2026, as it was last year, is likely to be new supply. High yield gross new issuance is expected to be up 15% this year, after an 18% bump in supply in 2025. Investment grade gross supply is going to be around $2 trillion, with about $1.2 trillion being refinancing. So, $800 billion of net new supply expected, up 23% YoY (highest since 2020). So far, investors have had an insatiable appetite, evidenced by the very tight spreads. We believe we will see more of the same in 2026, given monetary and fiscal policy support.
Assessing the Outlook for 2026
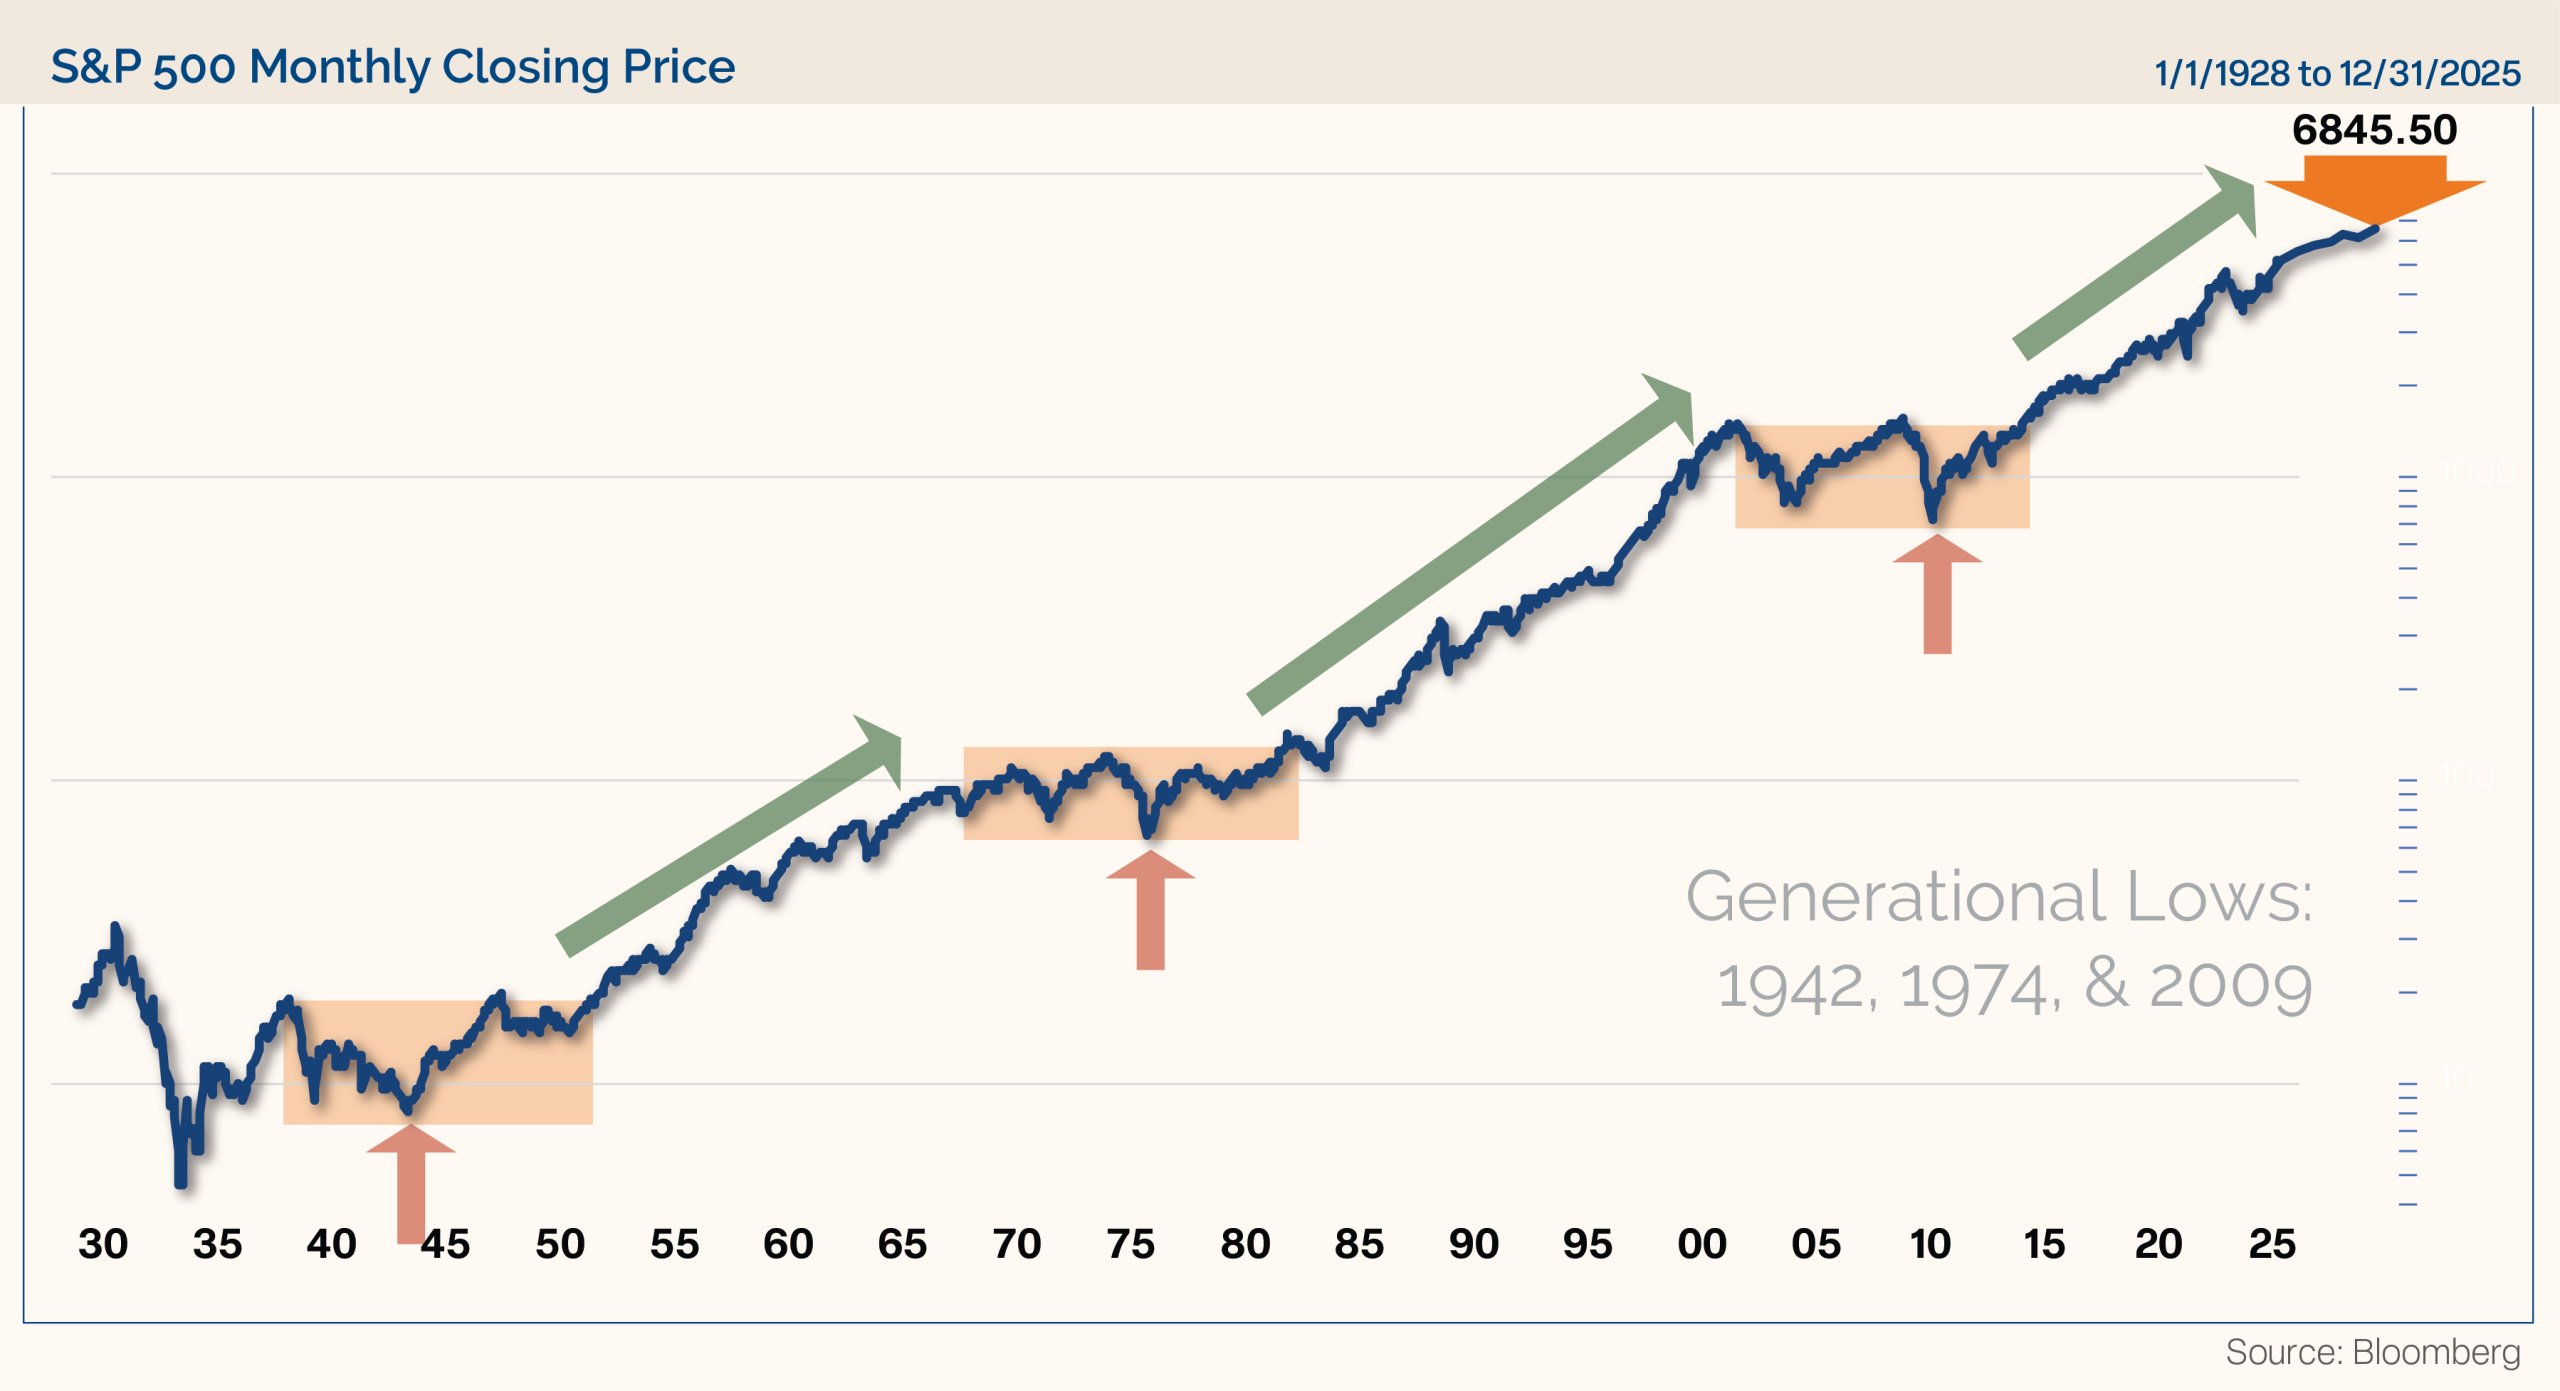
This final chart, Figure 15, shows the long-term trend of the S&P 500. With the market hitting new record highs and the economy accelerating to the upside, the secular bull market that started after the Global Financial Crisis, and the cyclical bull market that began in 2022, are both still intact with further gains expected.
Figure 15
In conclusion, as we look toward 2026, the U.S. economy has a tailwind at its back with loose financial conditions, a dovish Fed, fiscal support from the One Big Beautiful Bill (OBBBA), and continued disinflation. We expect the U.S. economy to post solid growth of 3.0% this year.
Credit conditions remain supportive of risk assets, spreads are low, and liquidity is abundant. Market trends are positive, and we have recently seen a broadening of participation beyond just the Mag-7 mega tech companies. Looking ahead, we expect earnings to again be the primary driver for stock prices in 2026. Our year-end target for the S&P 500 is 7700.
After 175 bps of rate cuts over the past two years, we still see the Fed cutting rates as inflation remains on a glidepath towards the Fed target and concerns about labor market weakness.
Risks to the outlook are many, as usual. Those risks include a new Federal Reserve Chair and midterm elections, both of which historically contribute to volatility and sizable corrections. In addition, labor market weakness remains a concern as well as challenges to Fed independence, the AI capital spending spree, and geopolitics.
As always, we believe it is imperative for investors to stay focused on their long-term goals and not let short-term swings in the market derail them from their longer-term objectives.
Looking for More Insights? Visit Our Resource Center.
The opinions expressed are those of Clark Capital Management Group. The opinions referenced are as of the date of publication and are subject to change due to changes in the market or economic conditions and may not necessarily come to pass. There is no guarantee of the future performance of any Clark Capital investment portfolio. Material presented has been derived from sources considered to be reliable, but the accuracy and completeness cannot be guaranteed. Nothing herein should be construed as a solicitation, recommendation or an offer to buy, sell or hold any securities, other investments or to adopt any investment strategy or strategies. For educational use only. This information is not intended to serve as investment advice. This material is not intended to be relied upon as a forecast or research. Investors must make their own decisions based on their specific investment objectives and financial circumstances. Past performance does not guarantee future results.
This document may contain certain information that constitutes forward-looking statements which can be identified by the use of forward-looking terminology such as “may,” “expect,” “will,” “hope,” “forecast,” “intend,” “target,” “believe,” and/or comparable terminology (or the negative thereof). No assurance, representation, or warranty is made by any person that any of Clark Capital’s assumptions, expectations, objectives, and/or goals will be achieved. Nothing contained in this document may be relied upon as a guarantee, promise, assurance, or representation as to the future.
Clark Capital Management Group, Inc. is an investment adviser registered with the U.S. Securities and Exchange. Commission Registration does not imply a certain level of skill or training. More information about Clark Capital’s advisory services can be found in its Form ADV and/or CRS, which are which is available upon request.
The Barclays U.S. Corporate High-Yield Index covers the USD-denominated, non-investment grade, fixed-rate, taxable corporate bond market. Securities are classified as high-yield if the middle rating of Moody’s, Fitch, and S&P is Ba1/BB+/BB+ or below.
Fixed income securities are subject to certain risks including, but not limited to: interest rate (changes in interest rates may cause a decline in market value or an investment), credit, prepayment, call (some bonds allow the issuer to call a bond for redemption before it matures), and extension (principal repayments may not occur as quickly as anticipated, causing the expected maturity of a security to increase).
Non-investment-grade debt securities (high-yield/junk bonds) may be subject to greater market fluctuations, risk of default or loss of income and principal than higher-rated securities.
The S&P 500 measures the performance of the 500 leading companies in leading industries of the U.S. economy, capturing 75% of U.S. equities.
The Russell 1000 Value Index measures the performance of the large-cap value segment of the U.S. equity universe. It includes those Russell 1000 companies with lower price-to-book ratios and lower expected growth values.
The Russell 1000 Growth Index measures the performance of the large-cap growth segment of the U.S. equity universe. It includes those Russell 1000 Index companies with higher price-to-book ratios and higher forecasted growth values.
The Russell 1000 Index measures the performance of the large-cap segment of the U.S. equity universe. It is a subset of the Russell 3000® Index and includes approximately 1000 of the largest securities based on a combination of their market cap and current index membership. The Russell 1000 represents approximately 92% of the U.S. market.
The Russell 2000 Index measures the performance of the 2000 smallest U.S. companies based on total market capitalization in the Russell 3000, which represents approximately 10% of Russell 3000 total market capitalization.
The Russell 3000 Index measures the performance of the 3000 largest U.S. companies based on total market capitalization, which represents approximately 98% of the investable U.S. equity market.
The MSCI USA Index is designed to measure the performance of the large and mid cap segments of the US market.
The MSCI Emerging Markets Index is a free float-adjusted market capitalization index that is designed to measure equity market performance of emerging markets. The MSCI Emerging Markets Index consists of the following 21 emerging market country indices: Brazil, Chile, China, Colombia, Czech Republic, Egypt, Hungary, India, Indonesia, Korea, Malaysia, Mexico, Morocco, Peru, Philippines, Poland, Russia, South Africa, Taiwan, Thailand, and Turkey.
The MSCI World ex US Index is a market capitalization-weighted index designed to measure equity performance in 22 global developed markets, excluding the United States. The benchmark for this composite is used because the MSCI World Ex US Net Index is generally representative of international equities.
BBgBarc U.S. Aggregate Bond Index covers the U.S. investment-grade fixed-rate bond market, including government and credit securities, agency mortgage pass-through securities, asset-backed securities and commercial mortgage-based securities. To qualify for inclusion, a bond or security must have at least one year to final maturity, and be rated investment grade Baa3 or better, dollar denominated, non-convertible, fixed rate and publicly issued.
The BBgBarc US Treasury Index measures US dollar-denominated, fixed-rate, nominal debt issued by the US Treasury. Treasury bills are excluded by the maturity constraint but are part of a separate Short Treasury Index. STRIPS are excluded from the index because their inclusion would result in double-counting. The US Treasury Index is a component of the US Aggregate, US Universal, Global Aggregate and Global Treasury Indices.
The BBgBarc US Corporate Bond Index measures the investment grade, fixed-rate, taxable corporate bond market. It includes USD-denominated securities publicly issued by US and non-US industrial, utility and financial issuers. The US Corporate Index is a component of the US Credit and US Aggregate Indices, and provided the necessary inclusion rules are met, US Corporate Index securities also contribute to the multi-currency Global Aggregate Index.
The BBgBarc U.S. Municipal Index covers the USD-denominated long-term tax-exempt bond market. The index has four main sectors: state and local general obligation bonds, revenue bonds, insured bonds and prerefunded bonds.
Created by the Chicago Board Options Exchange (CBOE), the Volatility Index, or VIX, is a real-time market index that represents the market’s expectation of 30-day forward-looking volatility. Derived from the price inputs of the S&P 500 index options, it provides a measure of market risk and investors’ sentiments.
The Institute of Supply Management (ISM) Non-Manufacturing Index is an economic index based on surveys of more than 400 non-manufacturing (or services) firms’ purchasing and supply executives.
Gross domestic product (GDP) is the standard measure of the value added created through the production of goods and services in a country during a certain period.
GDPNow is not an official forecast of the Atlanta Fed. Rather, it is best viewed as a running estimate of real GDP growth based on available economic data for the current measured quarter.
A Treasury Bill (T-Bill) is a short-term U.S. government debt obligation backed by the Treasury Department with a maturity of one year or less. Treasury bills are usually sold in denominations of $1,000.
The 10 year treasury yield indicates the interest rate that the US government pays to borrow money for a 10-year period.
References to market or composite indices or other measures of relative market performance over a specified period of time are provided for your information only. Reference to an index does not imply that your account will achieve returns, volatility or other results similar to that index. The composition of the index may not reflect the manner in which a portfolio is constructed in relation to expected or achieved returns, portfolio guidelines, restrictions, sectors, correlations, concentrations, volatility or tracking error targets, all of which are subject to change. Investors cannot invest directly in indices.
A leading indicator is a measurable set of data that may help to forecast future economic activity. Leading economic indicators can be used to predict changes in the economy before the economy begins to shift in a particular direction.
The volatility (beta) of an account may be greater or less than its respective benchmark.
The Consumer Price Index (CPI) measures the change in prices paid by consumers for goods and services. The CPI reflects spending patterns for each of two population groups: all urban consumers and urban wage earners and clerical workers.
Core inflation removes the CPI components that can exhibit large amounts of volatility from month to month.
The Producer Price Index (PPI) measures the average change over time in the prices domestic producers receive for their output.
The ISM Prices Paid represents business sentiment regarding future inflation. A high reading is seen as positive for the USD, while a low reading is seen as negative.
Nonfarm payroll refers to the number of jobs in the private sector and government agencies. It excludes farm workers, private household employees, proprietors, non-profit employees, and actively serving military.
A CCC-rated bond is a debt instrument considered to be speculative grade or “junk” by credit rating agencies. This means the issuer has a high risk of defaulting on its debt obligations. CCC-rated bonds are issued by companies facing significant financial difficulties, high debt levels, or operating in unstable industries.
Core PCE, or Core Personal Consumption Expenditures, is a measure of inflation that excludes food and energy prices. It represents the prices of goods and services purchased by consumers, but with the most volatile components (food and energy) removed to provide a clearer picture of underlying inflation trends. The Federal Reserve uses Core PCE as a key indicator when making monetary policy decisions.
VIX of VIX (or VVIX) is a measure of the volatility of the Chicago Board Options Exchange (CBOE) Volatility Index (VIX). The CBOE’s VIX measures the short-term volatility of the S&P 500 indexes, and the VVIX measures the volatility of the price of the VIX. In other words, VVIX is a measure of the volatility of the S&P 500 index and alludes to how quickly market sentiment changes.

