
Tariff Uncertainty Spurs Volatility; Stocks Weaken, Bonds Are Mixed
HIGHLIGHTS:
- Stocks: Volatility was the key word in April. The tariff announcement, followed days later by a 90-day pause, sent stocks and bonds on a rollercoaster ride over the course of a few weeks. Markets calmed down to a degree after the tariff pause announcement, with stocks recording mixed results.
- Bonds: After solid results in the first quarter, most bond sectors gained in April as well, but results were mixed. After closing at 4.01% on April 4, the 10-year U.S. Treasury yield moved abruptly higher, closing at 4.48% on April 11, but ended the month at 4.17%. Stress in the bond market developed in early April and that “sand in the gears” likely helped prompt the 90-day tariff pause.
- Economy: The big question mark for the economy is what the ultimate tariff environment will look like. The uncertainty of tariffs has impacted the outlook for the U.S. and global economy. While the odds of a recession have increased, our base case is still economic growth in 2025, albeit more slowly.
- Federal Reserve: The FOMC has not changed policy rates in 2025. Pressure has been mounting on the Fed to cut rates more aggressively, but Fed officials are concerned about the impact of tariffs on inflation. The market is now pricing in four rate cuts in 2025, as those expectations have been rising in recent months. (Per CME FedWatch tool as of 4/30/25.)
EQUITY MARKETS
See Table 1 for April 2025, Q1 2025 and YTD results.
Table 1 | Equity Markets
| Index | April 2025 | Q1 2025 | YTD |
| S&P 500 | -0.68% | -4.27% | -4.92% |
| S&P 500 Equal Weight | -2.29% | -0.61% | -2.88% |
| DJIA | -3.08% | 0.87% | % |
| Russell 3000 | -0.67% | -4.72% | -5.36% |
| NASDAQ Comp. | 0.88% | -10.26% | -9.48% |
| Russell 2000 | -2.31% | -9.48% | -11.57% |
| MSCI ACWI ex U.S. | 3.61% | 5.23% | 9.03% |
| MSCI Emerging Mkts Net | 1.31% | 2.93% | 0.87% |
Source: Morningstar. For illustrative purposes only. Indexes are unmanaged and have been provided for comparison purposes only. No fees or expenses are reflected. You cannot invest directly in an index. Past performance is not indicative of future results.
Volatility was the key word in April. The tariff announcement, followed days later by a 90-day pause, sent stocks and bonds on a rollercoaster ride over the course of a few weeks. Markets calmed down to a degree after the tariff pause announcement, with stocks recording mixed results.Volatility was the key word in April. The tariff announcement, followed days later by a 90-day pause, sent stocks and bonds on a rollercoaster ride over the course of a few weeks. Markets calmed down to a degree after the tariff pause announcement, with stocks recording mixed results.
Fixed Income
Bonds were another volatile asset class during the month, but by the end of April, several bond sectors had advanced. Bonds, once again, helped offset equity market weakness as they had in Q1. See Table 2 for bond index returns for April 2025, Q1 2025, and YTD.
Table 2 | Fixed Income Markets
| April 2025 | Q1 2025 | YTD | |
| Bloomberg U.S. Agg | 0.39% | 2.78% | 3.18% |
| Bloomberg U.S. Credit | 0.06% | 2.36% | 2.43% |
| Bloomberg U.S. High Yld | -0.02% | 1.00% | 0.98% |
| Bloomberg Muni | -0.81% | -0.22% | -1.03% |
| Bloomberg 30-year U.S. TSY | -1.24% | 4.28% | 2.99% |
| Bloomberg U.S. TSY | 0.63% | 2.92% | 3.57% |
Source: Morningstar. For illustrative purposes only. Past performance is not indicative of future results. Indexes are unmanaged and have been provided for comparison purposes only. No fees or expenses are reflected. You cannot invest directly in an index.
The 10-year U.S. Treasury yield ended March at 4.23%. As tariff concerns rocked the market in early April, a classic flight to quality ensued, and Treasury prices rallied with the 10-year yield dropping to 4.01% on April 4. However, a quick reversal in yields started to happen and on April 11, the 10-year closed at 4.48%. Rates then declined through month end with the 10-year closing at 4.17% It’s being speculated that this abrupt rise in rates and issues developing in the bond market prompted President Trump’s 90-day tariff pause announcement. Munis have been the laggard in the bond market so far this year. This sector saw larger supply in April along with general market and policy uncertainty, which can acutely impact the muni space. While a challenge, this weakness in munis could provide some opportunities for an active manager.
We maintain our long-standing position favoring credit versus pure rate exposure in this interest rate environment. We also believe the role bonds play in a portfolio – to provide stable cash flow and to help offset the volatility of stocks in the long run – has not changed. Bonds indeed helped offset equity market volatility in the first quarter and in April. Furthermore, we believe that bond yields remain attractive. In our opinion, having an active bond management approach makes sense in these volatile times.
Economic Data Highlights and Outlook
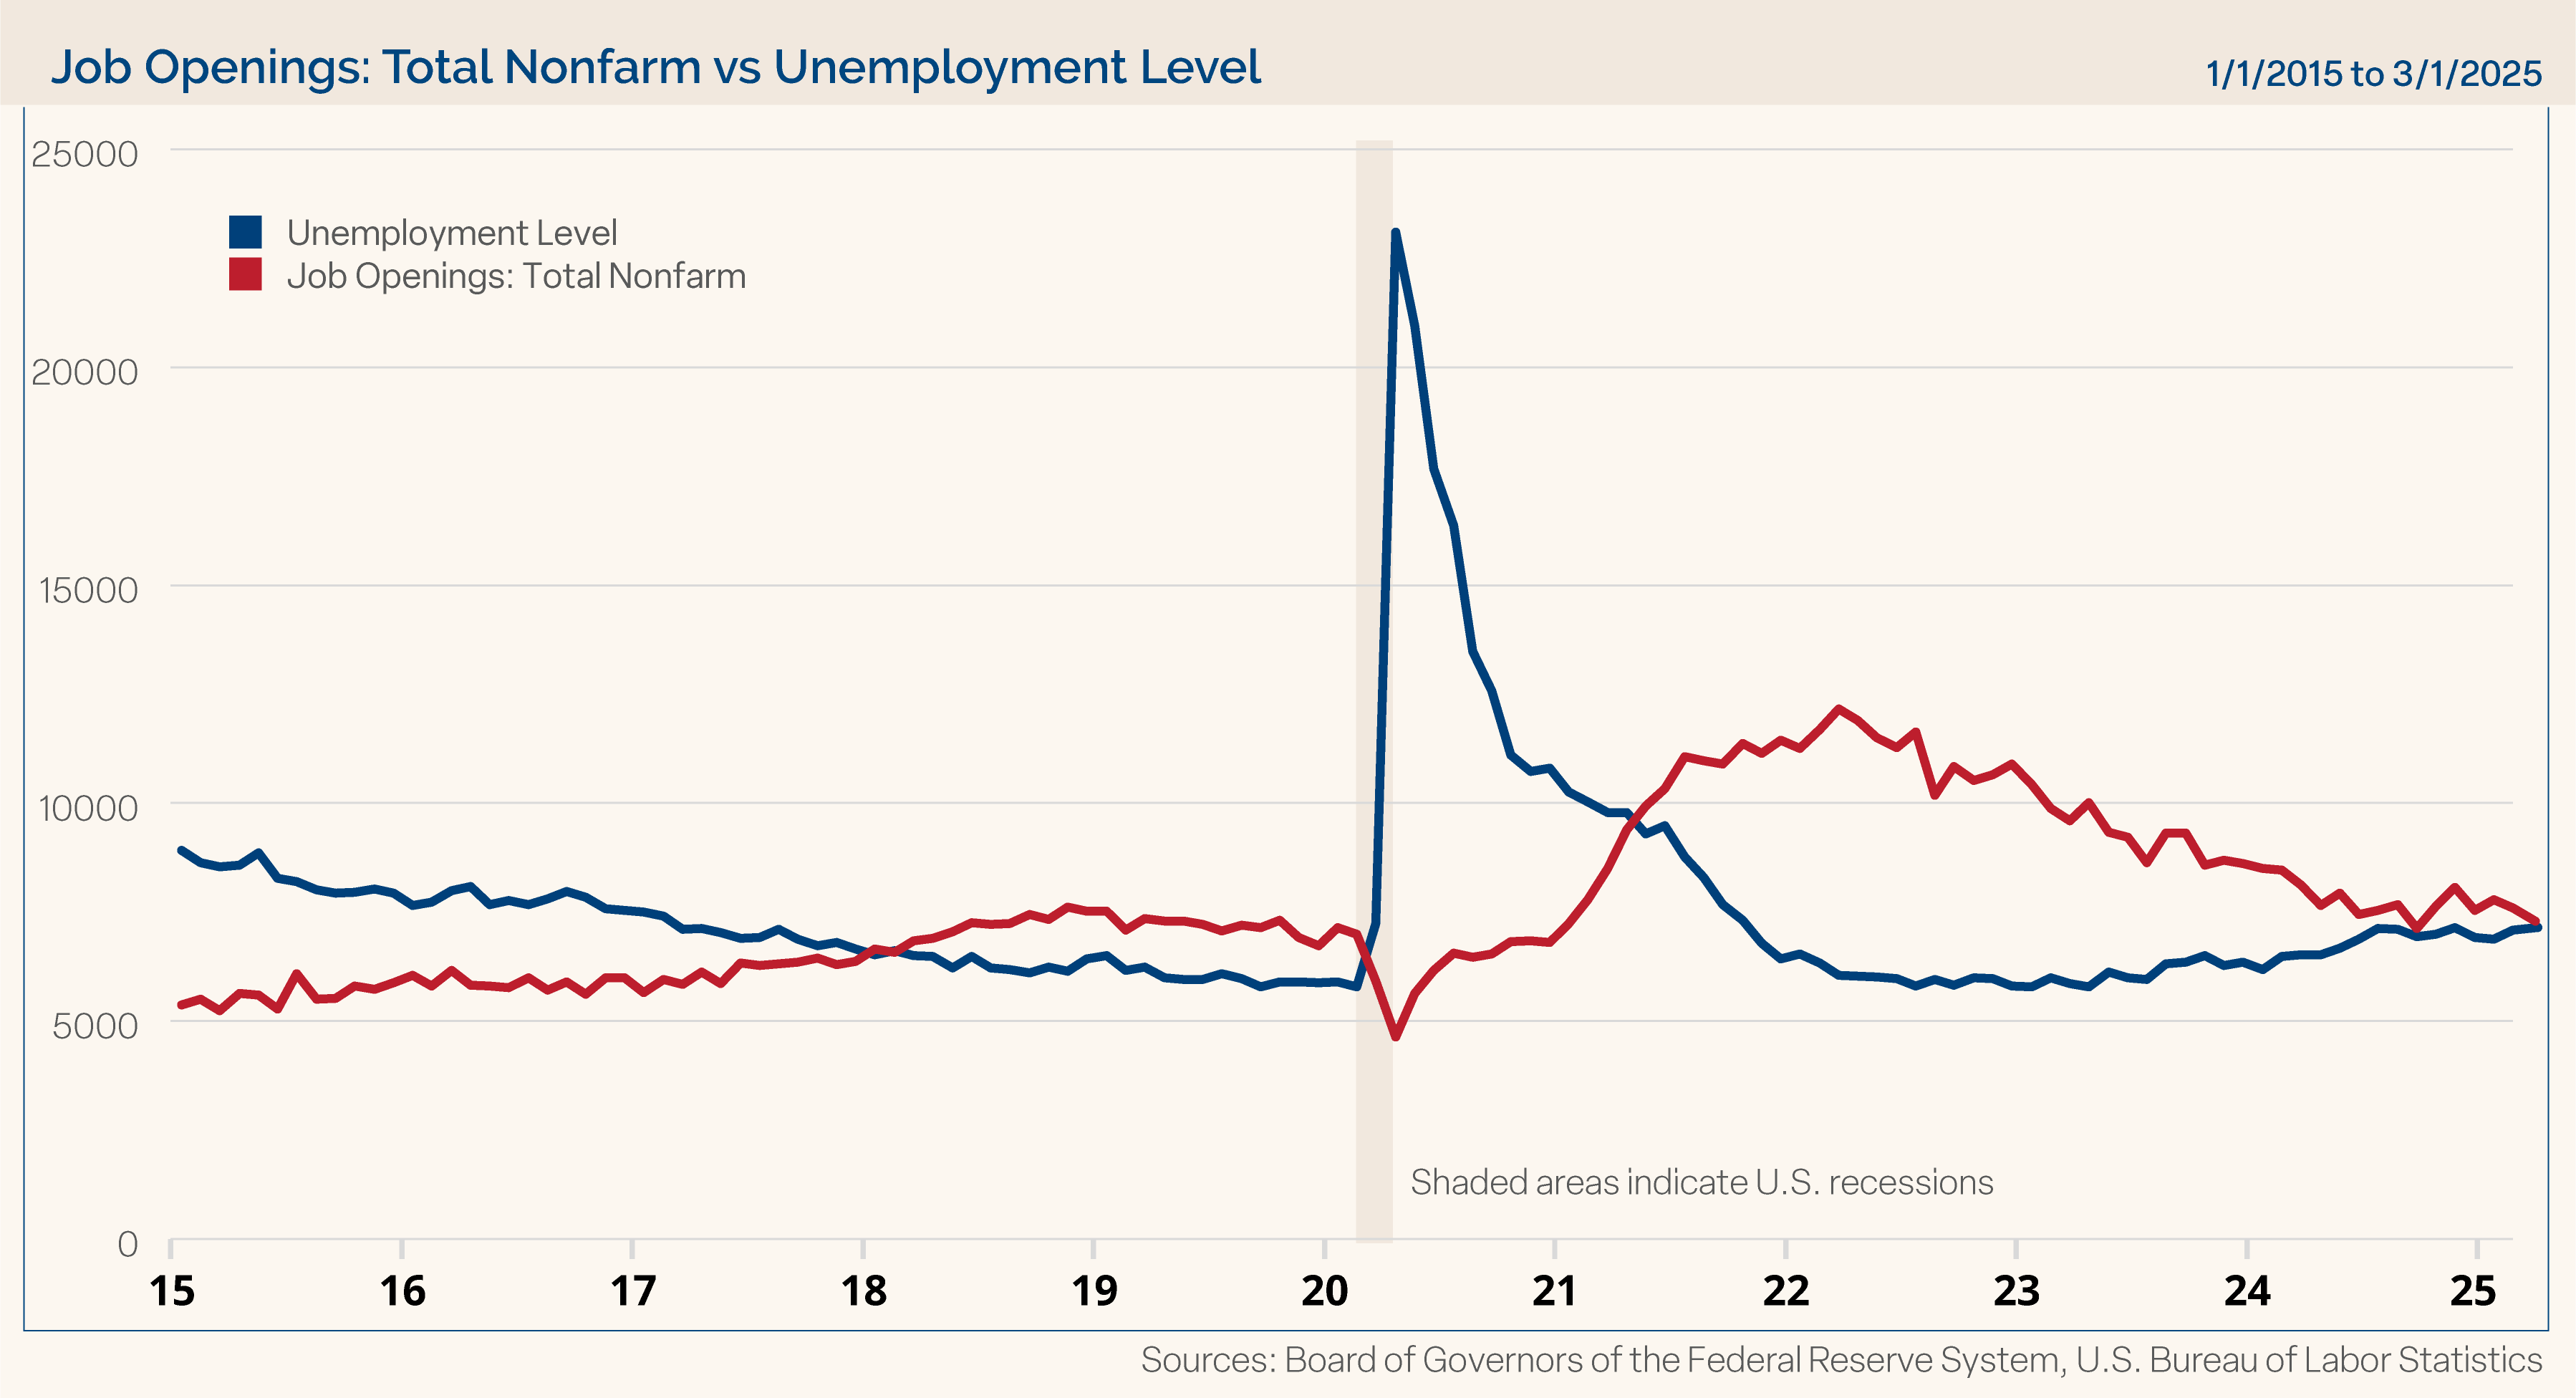
Jobs: Although rearview looking, the job market has remained resilient. In March, payrolls increased by 228,000, well ahead of expectations of 140,000. However, the prior month was revised to show fewer additions, and the unemployment rate ticked unexpectedly higher to 4.2% in March from the expected level and the prior level of 4.1%. Job openings dropped rather sharply in March to under 7.2 million from just below 7.5 million in February. This might be an initial reflection of businesses pausing some of their job hiring activity in light of the uncertainty around tariffs. Interestingly, layoffs declined by 222,000 in March. At this point it looks like companies have frozen hiring but have not enacted massive layoffs. We will monitor to see if slowing hiring activity shows up in other job market numbers in the months ahead. Chart 1 shows the unemployment level and the number of job openings. Clearly the spread between these two measures has closed in recent years and the numbers are close to sitting on top of each other in March, but job openings remain at a modestly higher level.
Chart 1
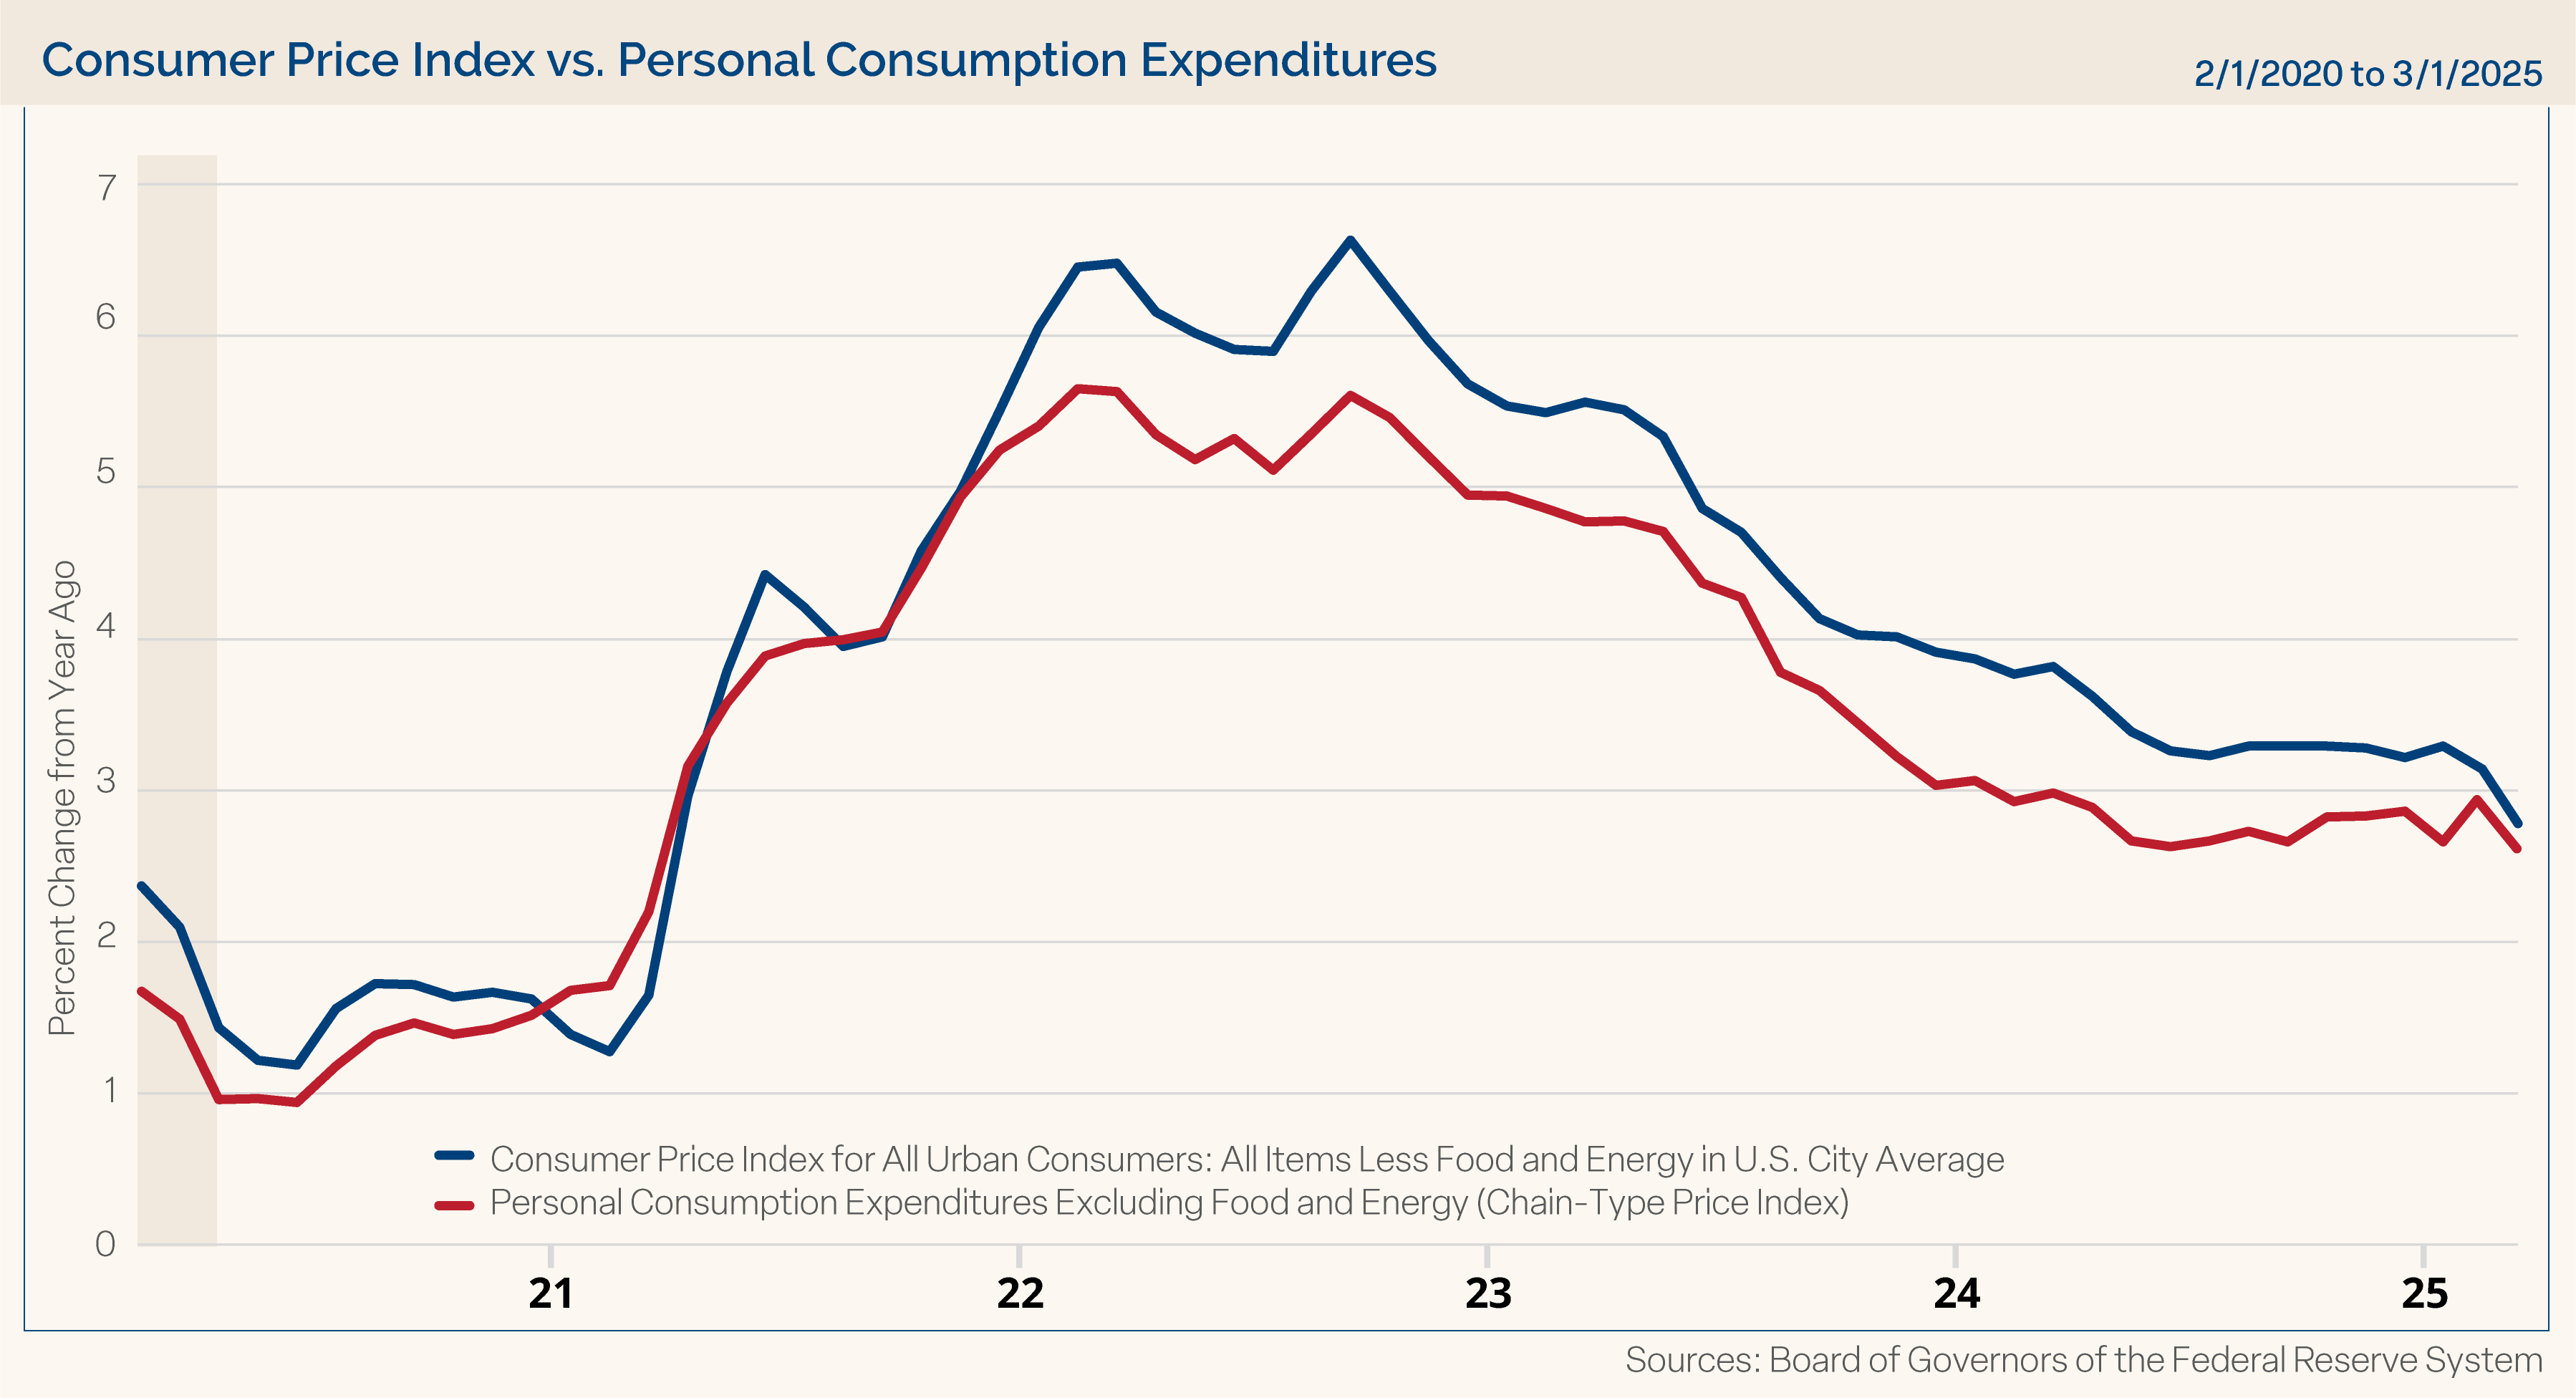
Inflation: Inflation data was largely better when reported in April. The Consumer Price Index (CPI) declined in March, which lowered the year-over-year reading to 2.4% from the expected reading of 2.5% and the prior month’s annual increase of 2.8%. The core CPI rose less than expected and was lower than the prior month’s annual number as well. The monthly reading of the Producer Price Index (PPI) declined by 0.4% as well when a 0.2% increase was expected. The core PPI also fell unexpectedly for the month. Those declines led to lower headline and core PPI readings than expectations and prior month levels. The Personal Consumption Expenditures (PCE) Price Index was flat for the month of March on a headline basis, as expected. It was also flat on a core basis when a 0.1% increase was expected. Both indices were lower than the prior month’s year-over-year increases, with the headline standing at 2.3% and the core reading at 2.6% on a year-over-year basis for March. (For more specific data, please refer to the end of this report.)
Overall, we believe inflation continues to make progress toward the Fed’s stated goal of around 2% for the core PCE price index reading. Progress has slowed and “hotter” inflation numbers are to be expected along this path lower, but last month showed improvements in the main price indices. We expect this path to be bumpy, and tariff concerns have increased inflation fears and expectations, but we will wait to see if a real change develops regarding inflation data. Chart 2 shows the core CPI and PCE price indices and how March data improved (was lower) for these two key inflation measures.
Chart 2
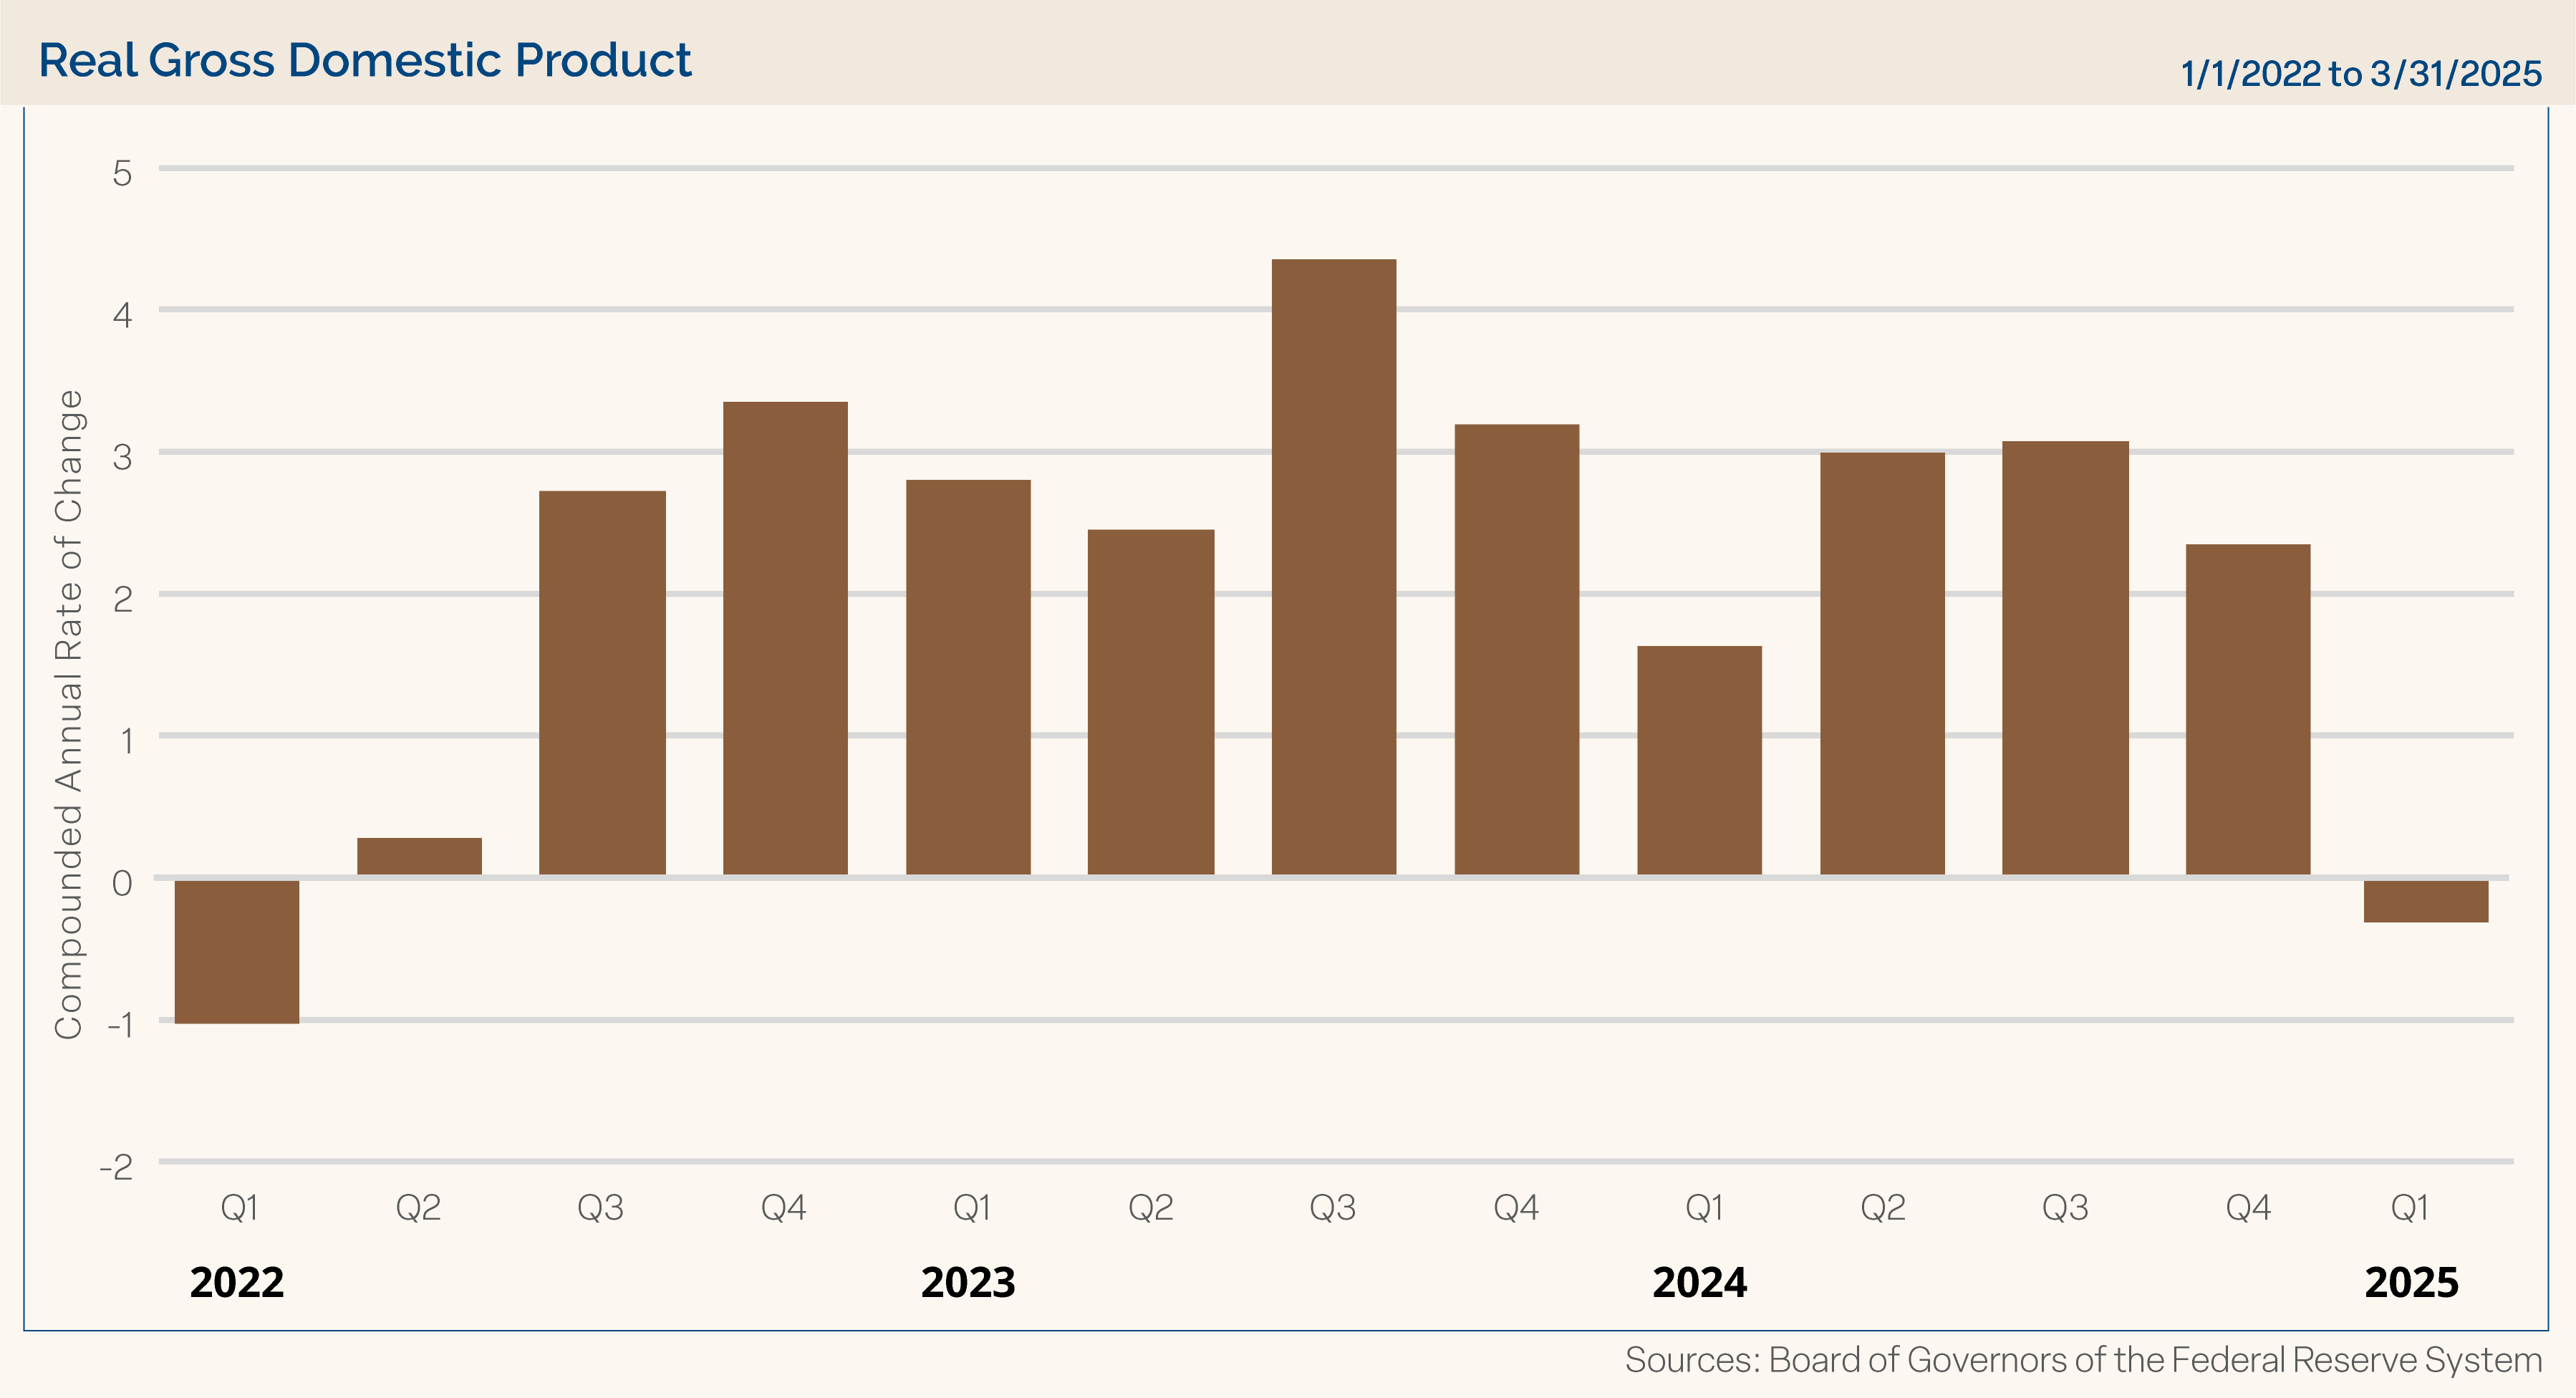
GDP: The advance reading of Q1 2025 was reported at the end of April, and it reflected a decline in economic activity with an annualized drop of 0.3%. Estimates were at -0.2%, but this was the first quarterly decline in the economy since the first quarter of 2022. We had been expecting some weakness due to a spike in imports as businesses stockpiled inventories in the first quarter ahead of anticipated changes in tariff policy. However, it was unwelcome news that economic activity declined after a solid year of expansion in 2024. Although above expectations, the personal consumption component of Q1 GDP was rather modest at a 1.8% annualized rate (expectations were 1.2%), when by comparison, the Q4 2024 personal consumption rate was 4.0%. We have consistently said it takes a lot to knock down U.S. consumers, but spending activity did slow in the first quarter as some of the tariff concern headwinds were building. We hope this turns out to be an anomalous GDP reading, and the current Atlanta Fed GDP Now estimate shows expected Q2 2025 to come in at a 2.4% annualized pace (as of 4/30/25). Chart 3 shows GDP readings since Q1 2022.
Chart 3
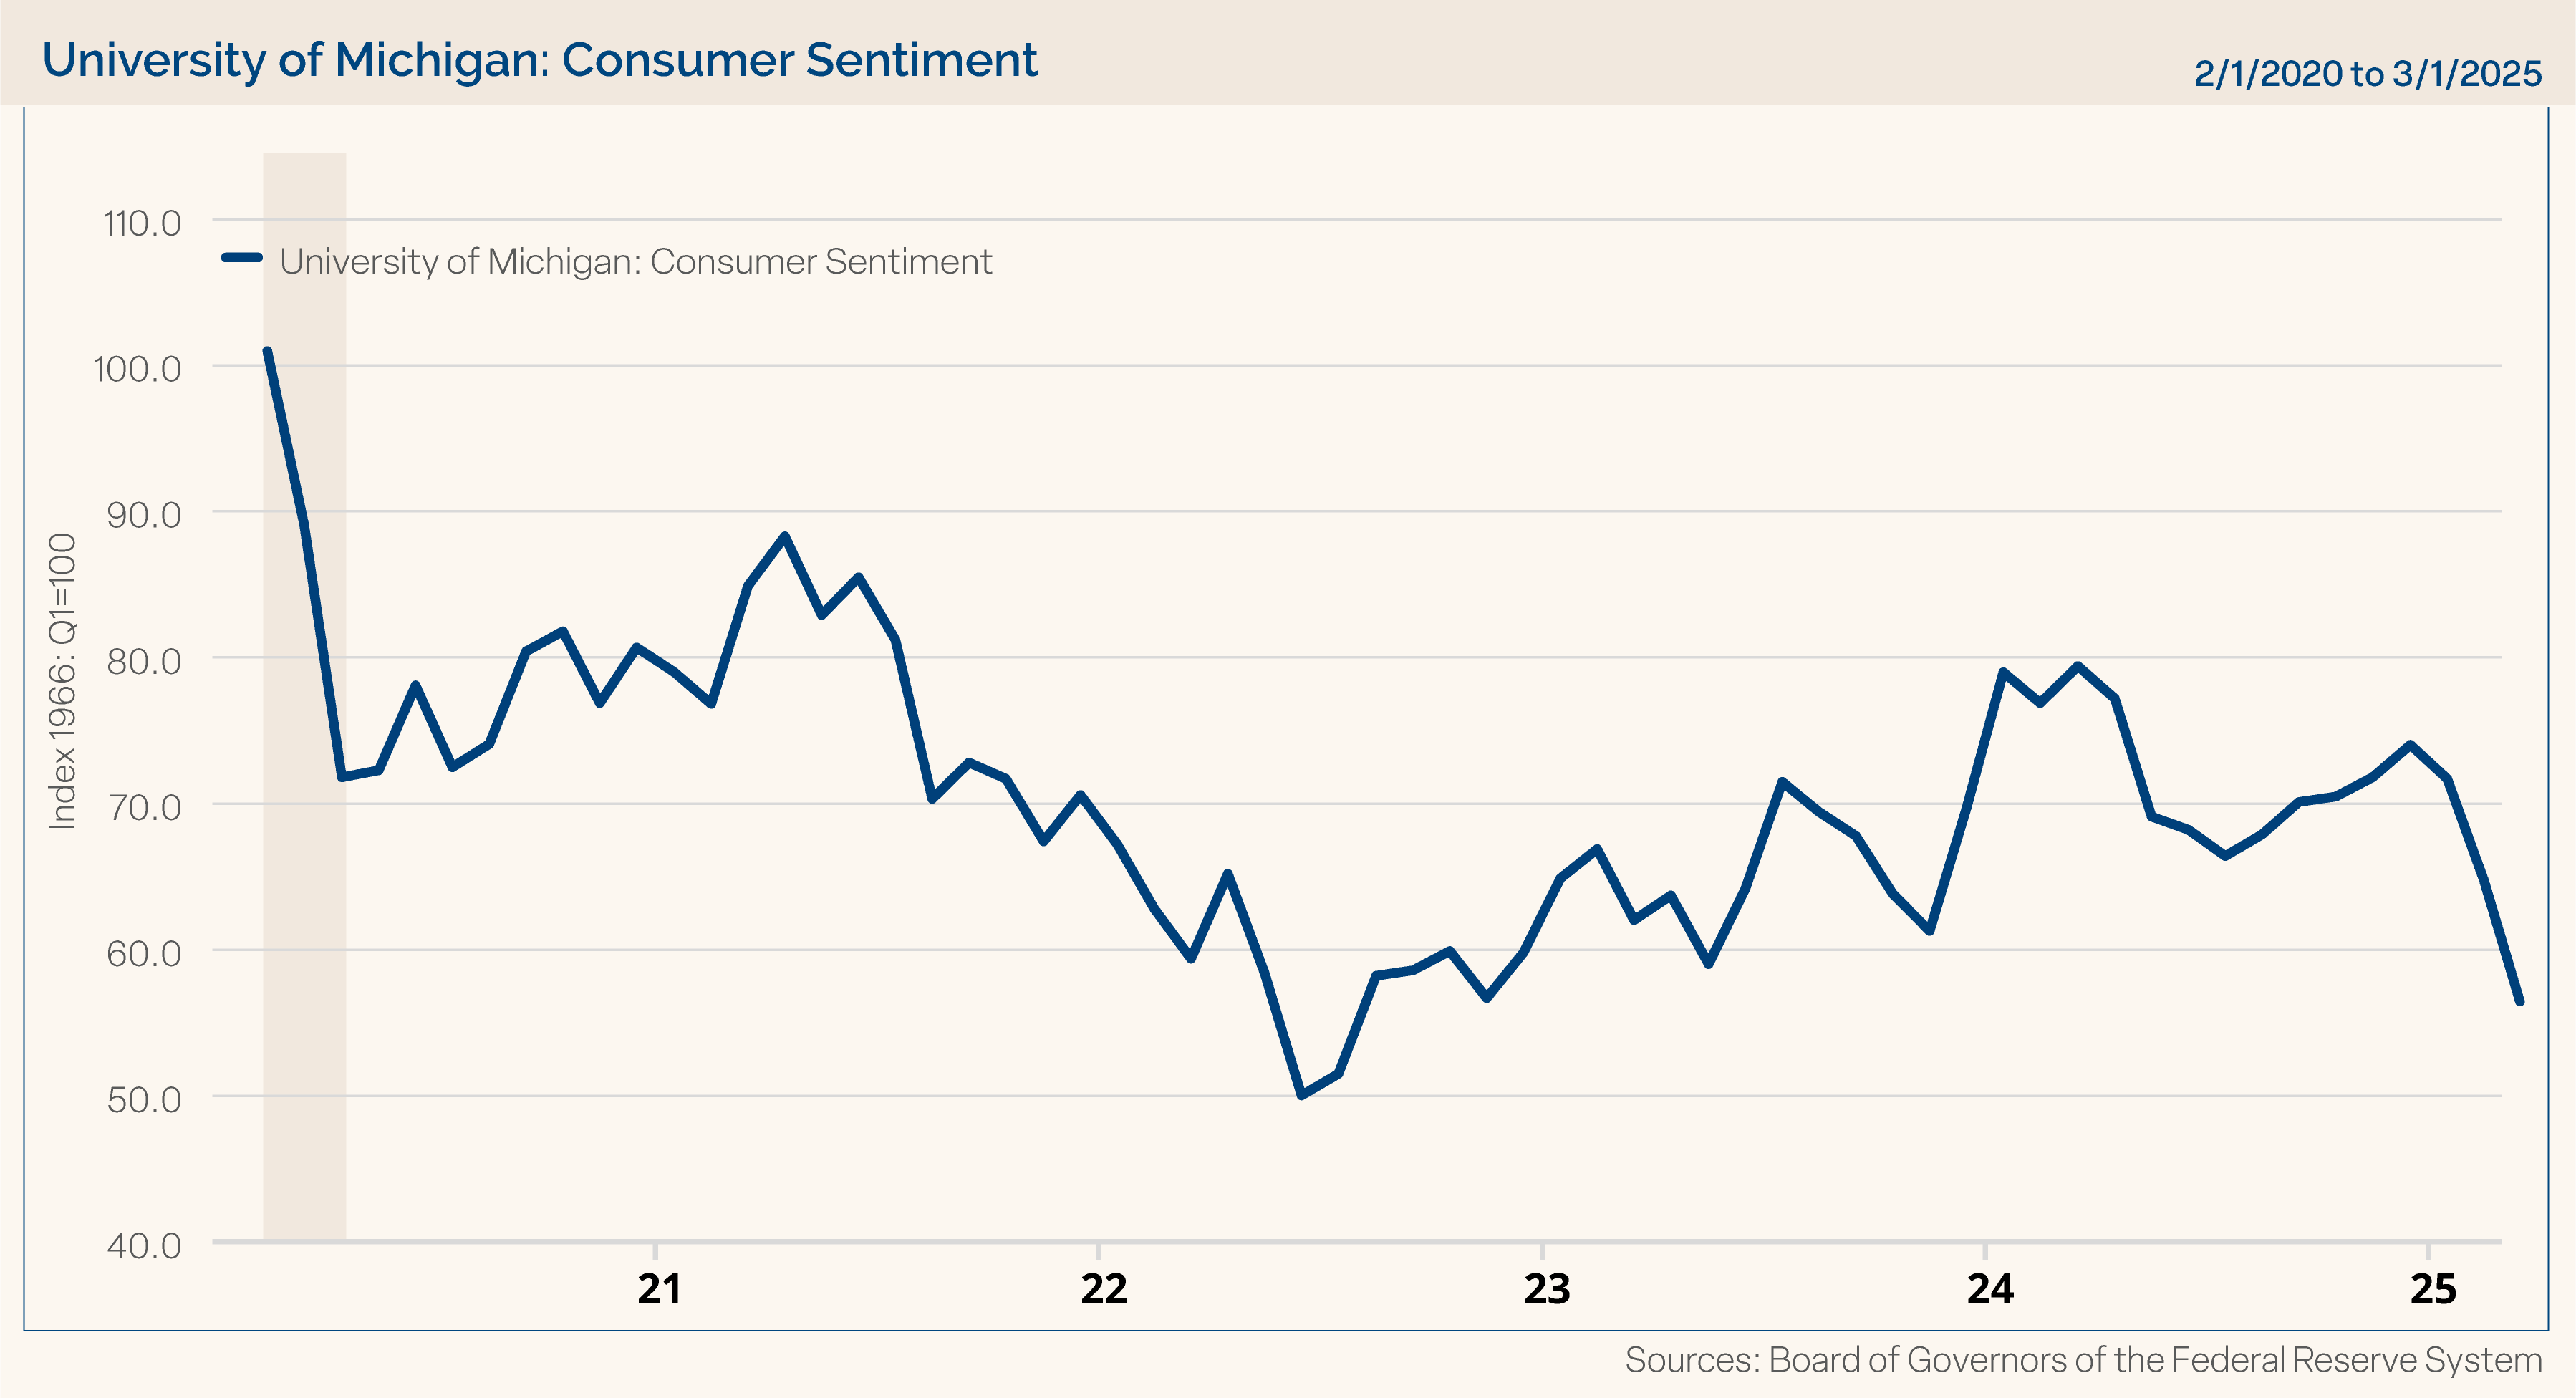
Consumer Confidence: One economic data point that has been heavily affected by the tariff discussions and resulting economic uncertainty has been consumer confidence. Consumers are clearly saying they are not as confident in 2025. The University of Michigan consumer sentiment reading has fallen dramatically in recent months. It is important to watch what consumers “say” in confidence surveys; however, we think it is more important to monitor what consumers “do,” meaning spending data. We will monitor whether this drop in consumer confidence translates into less spending by consumers in the months ahead. Chart 4 shows the consumer sentiment reading from the University of Michigan. This data is delayed by one month on the chart, and we know the preliminary sentiment reading has fallen further to 50.8 for April. The fall in consumer confidence in April approaches the weakest confidence readings we have seen in years, only surpassed by levels from 2022. For comparison, this reading stood at 101 for February 2020, and it stayed above 70 during the remainder of 2020 as we dealt with COVID.
Chart 4
Other Economic Data Points: The After back-to-back readings above 50 to start the year, the ISM Manufacturing reading fell to 49.0 in March, which was below expectations of 49.5. For April, the reading declined further to 48.7, although this was better than the expected drop to 47.9. The ISM Non-Manufacturing Index, which covers the much larger service industries in the U.S. economy, stayed modestly above 50 at 50.8 in March, but that was shy of expectations of 52.9. Slowing manufacturing and non-manufacturing activity has developed recently, which is another likely side effect of tariff uncertainty. Recall, ISM readings above 50 reflect expansion and those below 50 indicate contraction.
A choppy interest rate environment led to mixed housing market data in March. Housing starts and existing home sales were lower than expected and lower than the prior month. However, building permits and new home sales were higher than expected and improved from the prior month. The leading economic indicators index slumped by 0.7% in March, which was worse than the expected 0.5% drop. The prior month decline was revised modestly higher, but it remained negative. Retail sales (ex auto and gas) jumped by a 0.8% monthly gain in March, ahead of expectations of 0.6%. Consumers might have been pulling forward some spending activity ahead of potential tariff price increases as well in March.
After a couple of years of solid stock market gains with relatively little volatility, equity weakness to start 2025 has been unsettling for investors. This volatility was amplified in April with the tariff announcement and the resulting deeper economic uncertainties. However, it is important to remember that, on average, stocks have a 10% correction about every year and a 20% correction about every three years. (For the record, our last 20% correction was in 2022.) While not pleasant, equity volatility is a normal part of doing business in the stock market. Focusing on market fundamentals, we are seeing an economy that we believe will grow in 2025, a Fed that is cutting interest rates, a fairly reasonably valued stock market (especially after the recent drop in stock prices), and S&P 500 companies that are expected to grow their earnings in 2025 and 2026. We will watch closely (and do expect) to see revisions that lower earnings estimates in the months ahead, but we have not seen much damage to those so far. Concerns about tariffs have ushered in volatility, and our analysts and portfolio managers will monitor industries and sectors that might be impacted by tariffs as they are making portfolio decisions. However, we still want to see what actually gets implemented versus the headlines that are inundating investors all the time. As always, we believe it is imperative for investors to stay focused on their long-term goals and not let short-term swings in the market derail them from their longer-term objectives.
ECONOMIC DATA
| Event | Period | Estimate | Actual | Prior | Revised |
| ISM Manufacturing | Mar | 49.5 | 49.0 | 50.3 | — |
| ISM Services Index | Mar | 52.9 | 50.8 | 53.5 | — |
| Change in Nonfarm Payrolls | Mar | 140k | 228k | 151k | 117k |
| Unemployment Rate | Mar | 4.1% | 4.2% | 4.1% | — |
| Average Hourly Earnings YoY | Mar | 4.0% | 3.8% | 4.0% | — |
| JOLTS Job Openings | Mar | 7500k | 7192k | 7568k | 7480k |
| PPI Final Demand MoM | Mar | 0.2% | -0.4% | 0.0% | 0.1% |
| PPI Final Demand YoY | Mar | 3.3% | 2.7% | 3.2% | — |
| PPI Ex Food and Energy MoM | Mar | 0.3% | -0.1% | -0.1% | 0.1% |
| PPI Ex Food and Energy YoY | Mar | 3.6% | 3.3% | 3.4% | 3.5% |
| CPI MoM | Mar | 0.1% | -0.1% | 0.2% | — |
| CPI YoY | Mar | 2.5% | 2.4% | 2.8% | — |
| CPI Ex Food and Energy MoM | Mar | 0.3% | 0.1% | 0.2% | — |
| CPI Ex Food and Energy YoY | Mar | 3.0% | 2.8% | 3.1% | — |
| Retail Sales Ex Auto and Gas | Mar | 0.6% | 0.8% | 0.5% | 0.5% |
| Industrial Production MoM | Mar | -0.2% | -0.3% | 0.7% | 0.8% |
| Building Permits | Mar P | 1450k | 1482k | 1459k | — |
| Housing Starts | Mar | 1420k | 1324k | 1501k | 1494k |
| New Home Sales | Mar | 685k | 724k | 676k | 674k |
| Existing Home Sales | Mar | 4.13m | 4.02m | 4.26m | 4.27m |
| Leading Index | Mar | -0.5% | -0.7% | -0.3% | -0.2% |
| Durable Goods Orders | Mar P | 2.0% | 9.2% | 1.0% | 0.9% |
| GDP Annualized QoQ | 1Q A | -0.2% | -0.3% | 2.4% | — |
| U. of Mich. Sentiment | Apr P | 53.8 | 50.8 | 57.0 | — |
| Personal Income | Mar | 0.4% | 0.5% | 0.8% | 0.7% |
| Personal Spending | Mar | 0.6% | 0.7% | 0.4% | 0.5% |
| S&P CoreLogic CS 20-City YoY NSA | Feb | 4.70% | 4.50% | 4.67% | 4.72% |
—Source: Bloomberg: A=Advanced P=Preliminary
“Forward looking statements cannot be guaranteed. Past performance is not indicative of future results. The opinions referenced are as of the date of publication and are subject to change due to changes in the market or economic conditions and may not necessarily come to pass. Material presented has been derived from sources considered to be reliable and has not been independently verified by us or our personnel. Nothing herein should be construed as a solicitation, recommendation or an offer to buy, sell or hold any securities, other investments or to adopt any investment strategy or strategies. Investors must make their own decisions based on their specific investment objectives and financial circumstances. Investing involves risk, including loss of principal.
Clark Capital Management Group is an investment adviser registered with the U.S. Securities and Exchange Commission. Registration does not imply a certain level of skill or training. More information about Clark Capital Management Group’s advisory services can be found in its Form ADV which is available upon request.
The manager utilizes a proprietary investment model to assist with the construction of the strategy and to assist the manager with making investment decisions. Investments selected using this process may perform differently than expected as a result of the factors used in the model, the weight placed on each factor, and changes from the factors’ historical trends. There is no guarantee that Clark Capital’s use of a model will result in effective investment decisions.
Fixed income securities are subject to certain risks including, but not limited to: interest rate (changes in interest rates may cause a decline in market value or an investment), credit, prepayment, call (some bonds allow the issuer to call a bond for redemption before it matures), and extension (principal repayments may not occur as quickly as anticipated, causing the expected maturity of a security to increase).
Non-investment-grade debt securities (high-yield/junk bonds) may be subject to greater market fluctuations, risk of default or loss of income and principal than higher-rated securities.
The value of investments, and the income from them, can go down as well as up and you may get back less than the amount invested.
Equity securities are subject to price fluctuation and possible loss of principal. Stock markets tend to move in cycles, with periods of rising prices and periods of falling prices. Certain investment strategies tend to increase the total risk of an investment (relative to the broader market). Strategies that concentrate their investments in limited sectors are more vulnerable to adverse market, economic, regulatory, political, or other developments affecting those sectors.
JOLTS is a monthly report by the Bureau of Labor Statistics (BLS) of the U.S. Department of Labor counting job vacancies and separations, including the number of workers voluntarily quitting employment.
The Core Consumer Price Index (CPI) is a measure of the average change over time in the prices paid by urban consumers for a market basket of consumer goods and services.
The Core Producer Price Index (PPI) program measures the average change over time in the selling prices received by domestic producers for their output. The prices included in the PPI are from the first commercial transaction for many products and some services.
The PCE price index, released each month in the Personal Income and Outlays report, reflects changes in the prices of goods and services purchased by consumers in the United States.
References to market or composite indices, benchmarks or other measures of relative market performance over a specified period of time (each, an “index”) are provided for your information only. Reference to an index does not imply that the portfolio will achieve returns, volatility or other results similar to that index. The composition of the index may not reflect the manner in which a portfolio is constructed in relation to expected or achieved returns, portfolio guidelines, restrictions, sectors, correlations, concentrations, volatility or tracking error targets, all of which are subject to change. Investors cannot invest directly in an index.
The Dow Jones Industrial Average® (The Dow®), is a price-weighted measure of 30 U.S. blue-chip companies. The index covers all industries except transportation and utilities.
The Bloomberg Barclays U.S. Municipal Index covers the USD-denominated long-term tax exempt bond market. The index has four main sectors: state and local general obligation bonds, revenue bonds, insured bonds and prerefunded bonds.
The Bloomberg US Treasury Index measures US dollar-denominated, fixed-rate, nominal debt issued by the US Treasury. Treasury bills are excluded by the maturity constraint, but are part of a separate Short Treasury Index.
The NASDAQ Composite is a stock market index of the common stocks and similar securities listed on the NASDAQ stock market.
The S&P 500 measures the performance of the 500 leading companies in leading industries of the U.S. economy, capturing 80% of U.S. equities.
The S&P 500® Equal Weight Index (EWI) is the equal-weight version of the widely-used S&P 500. The index includes the same constituents as the capitalization weighted S&P 500, but each company in the S&P 500 EWI is allocated a fixed weight or 0.2% of the index total at each quarterly rebalance.
The University of Michigan Consumer Sentiment Index rates the relative level of current and future economic conditions. There are two versions of this data released two weeks apart, preliminary and revised. The preliminary data tends to have a greater impact. The reading is compiled from a survey of around 500 consumers.
The Russell 1000 Index is a stock market index that tracks the highest-ranking 1,000 stocks in the Russell 3000 Index, which represent about 93% of the total market capitalization of that index.
The Russell 2000 Index is a small-cap stock market index that represents the bottom 2,000 stocks in the Russell 3000.
The Russell 3000 Index measures the performance of the 3,000 largest U.S. companies based on total market capitalization, which represents approximately 98% of the investable U.S. equity market.
Nonfarm payrolls (NFPs) are the measure of the number of workers in the United States excluding farm workers and workers in a handful of other job classifications.
A municipal bond, commonly known as a muni, is a bond issued by state or local governments, or entities they create such as authorities and special districts.
The CBOE Volatility Index (VIX) is a real-time index that measures the expected volatility of the S&P 500 over the next 30 days.
The U.S. Treasury index is based on the recent auctions of U.S. Treasury bills. Occasionally it is based on the U.S. Treasury’s daily yield curve.
The 30 Year Treasury Rate is the yield received for investing in a US government issued treasury security that has a maturity of 30 years.
The Bloomberg Barclays U.S. Corporate High-Yield Index covers the U.S. dollar-denominated, non-investment grade, fixed-rate, taxable corporate bond market. Securities are classified as high-yield if the middle rating of Moody’s, Fitch, and S&P is Ba1/BB+/BB+ or below.
The Bloomberg Barclays U.S. Credit Index measures the investment grade, U.S. dollar denominated, fixed-rate taxable corporate and government related bond markets.
The Bloomberg Aggregate Bond Index or “the Agg” is a broad-based fixed-income index used by bond traders and the managers of mutual funds and exchange-traded funds (ETFs) as a benchmark to measure their relative performance.
The Bloomberg US Trsy Bellwethers 30Y is a U.S. Treasury debt obligation that has a maturity of 30 years.
The ISM Non-Manufacturing Index is an index based on surveys of more than 400 non-manufacturing firms’ purchasing and supply executives, within 60 sectors across the nation, by the Institute of Supply Management (ISM). The ISM Non-Manufacturing Index tracks economic data, like the ISM Non-Manufacturing Business Activity Index. A composite diffusion index is created based on the data from these surveys, that monitors economic conditions of the nation.
ISM Manufacturing Index measures manufacturing activity based on a monthly survey, conducted by Institute for Supply Management (ISM), of purchasing managers at more than 300 manufacturing firms.
The MSCI Emerging Markets Index captures large and mid cap representation across 27 Emerging Markets (EM) countries.
The MSCI ACWI ex USA Index captures large and mid cap representation across 22 of 23 Developed Markets (DM) countries (excluding the US) and 27 Emerging Markets (EM) countries*. With 2,359 constituents, the index covers approximately 85% of the global equity opportunity set outside the US.
The S&P CoreLogic Case-Shiller 20-City Composite Home Price NSA Index seeks to measures the value of residential real estate in 20 major U.S. metropolitan areas. The U.S. Treasury index is based on the recent auctions of U.S. Treasury bills. Occasionally it is based on the U.S. Treasury’s daily yield curve.
The Leading Economic Index provides an early indication of significant turning points in the business cycle and where the economy is heading in the near term.
In the United States, the Core Personal Consumption Expenditure Price (CPE) Index provides a measure of the prices paid by people for domestic purchases of goods and services, excluding the prices of food and energy.
The Conference Board’s Leading Indexes are the key elements in an analytic system designed to signal peaks and troughs in the business cycle. The leading, coincident, and lagging economic indexes are essentially composite averages of several individual leading, coincident, or lagging indicators. They are constructed to summarize and reveal common turning point patterns in economic data in a clearer and more convincing manner than any individual component – primarily because they smooth out some of the volatility of individual components.
Gross domestic product (GDP) is the standard measure of the value added created through the production of goods and services in a country during a certain period.