



Choppy Month but Both Stocks and Bonds Made Progress in August
HIGHLIGHTS
- Stocks: The S&P 500 moved notably higher to start the month, hitting a new all-time high before mid-August. However, stocks lost momentum from that point, and the second half of August was choppy and trended lower.
- Bonds: The 10-year U.S. Treasury closed July and August at the same 4.75% mark. However, August saw a lot of volatility in yields with a rather sharp rise late in the month as rate hike expectations increased.
- U.S. Economy: The economy continued to reflect growth, but economic data was rather mixed for July. A late-month resumption in hostilities with Iran sent oil prices higher, exacerbating inflationary pressures and affordability concerns. Job market and spending data were both weak in July.
- Federal Reserve: The FOMC did not meet in August, but Fed Chairman Warsh spoke at the annual economic symposium in Jackson Hole. His hawkish speech spurred rates higher and raised market expectations of a rate hike at the September FOMC meeting.
Equity Markets
Large-cap growth stocks improved in August after lagging most of the year. The on-again, off-again nature of the Iran conflict has created volatility, and elevated interest rates are also keeping pressure on stocks. Still, stocks have been resilient, and the S&P 500 Index posted three new all-time highs in August — and 27 year to date — boosted by continued earnings strength. The rally continued to broaden as small caps and value stocks have taken a leading role so far this year. See Table 1 for August and YTD returns.
Table 1 | Equity Markets
| Index | August 2026 | YTD |
|---|---|---|
| S&P 500 | 2.72% | 13.14% |
| S&P 500 Equal Weight | 2.06% | 15.59% |
| DJIA | 1.47% | 11.79% |
| Russell 3000 | 2.74% | 13.37% |
| Russell 1000 Growth | 3.73% | 4.06% |
| Russell 1000 Value | 2.03% | 23.12% |
| NASDAQ Comp. | 3.99% | 13.90% |
| Russell 2000 | 0.98% | 20.01% |
| MSCI ACWI ex U.S. | 2.57% | 17.01% |
| MSCI Emerging Mkts Net | 3.37% | 24.08% |
The Nasdaq Composite led in August as stocks moved broadly higher regardless of style or market cap. Value stocks have shown clear leadership in 2026, with the Russell 1000 Value Index up 23.12% compared to the Russell 1000 Growth Index, which has gained only 4.06% year to date. Small caps are another leader in the market with gains now surpassing 20% year to date. International stocks have quietly re-established leadership after last year’s strong results and showed some of the strongest gains for the year.
Very strong earnings growth has been one consistent narrative supporting the stock market this year. Earnings are expected to grow north of 25% in 2026 and in the mid-teens in 2027, which makes the stock market cheaper from a valuation perspective than where we began the year. While subject to revision, we are at a point in the market cycle where earnings have been accelerating and supporting gains in the stock market. We are mindful of potential volatility developing as we move toward midterm elections and with new leadership at the Fed — two scenarios that historically have tended to heighten volatility. However, the fundamental backdrop of strong earnings growth continues to keep us constructive on the stock market moving through the balance of 2026.
Emerging markets rebounded in August after a weak July and continued to be the strongest index on Table 1 year to date. Some countries with heavy tech weights, like Taiwan and South Korea, were hit as the broader AI trade came under scrutiny in July but subsequently rebounded in August. Broad international equities are generally outpacing U.S. stocks in 2026. Overall, both U.S. and international stocks, have turned in impressive results so far this year.
Fixed Income
The 10-year U.S. Treasury closed July at 4.75%, and, after some volatility in August, closed at that same mark by August’s end. The 30-year closed at 5.25% as higher rates have become a clear theme in the market in recent weeks. However, rates were rather range bound in August, and bond indices made some progress. See Table 2 for August and YTD bond returns.
Table 2 | Fixed Income Markets
| Index | August 2026 | YTD |
|---|---|---|
| Bloomberg U.S. Agg | 0.39% | -0.31% |
| Bloomberg U.S. Credit | 0.43% | -0.34% |
| Bloomberg U.S. High Yld | 0.97% | 2.69% |
| Bloomberg Muni | -0.23% | 0.20% |
| Bloomberg 30-year U.S. TSY | 0.64% | -3.07% |
| Bloomberg U.S. TSY | 0.31% | -0.53% |
After a tough July for bonds, which saw yields rise to multi-year highs, rates calmed down in August, and most bond sectors were able to advance. Credit spreads remain tight, and the move higher in rates is reflecting elevated inflation concerns and elevated government bond issuance needs, but not much stress from a credit perspective. High yield showed leadership once again in August and has the strongest year-to-date results. Munis continued to give back some of their year-to-date gains but remain positive for the year. Other bond sectors remained negative year to date.
We maintain our longstanding position favoring credit versus pure rate exposure in this interest rate environment. We believe the role bonds play in a portfolio, to provide stable cash flow and to help offset the stock volatility in the long run, has not changed. With uncertainty ahead, we believe having an active bond management approach makes sense. Furthermore, the recent rise in rates provides attractive opportunities for bond investors with rates at levels not seen in some time.
Economic Data Highlights and Outlook
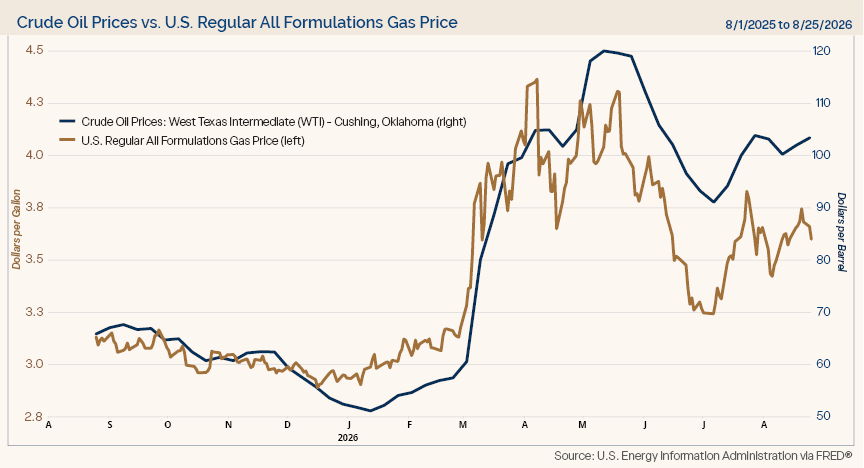
Ebbs and flows in the conflict with Iran continue to impact oil prices, inflation expectations, and capital market activity. After tumbling in the early part of the month, oil prices trended higher through August and culminated with a sharp move higher to end the month as hostilities resumed with Iran. Gasoline also saw an initial break in prices early in August, but that proved to be short lived, and those prices moved higher later in the month following rising oil prices. Chart 1 shows the strong relationship between oil prices and gas prices.
Chart 1
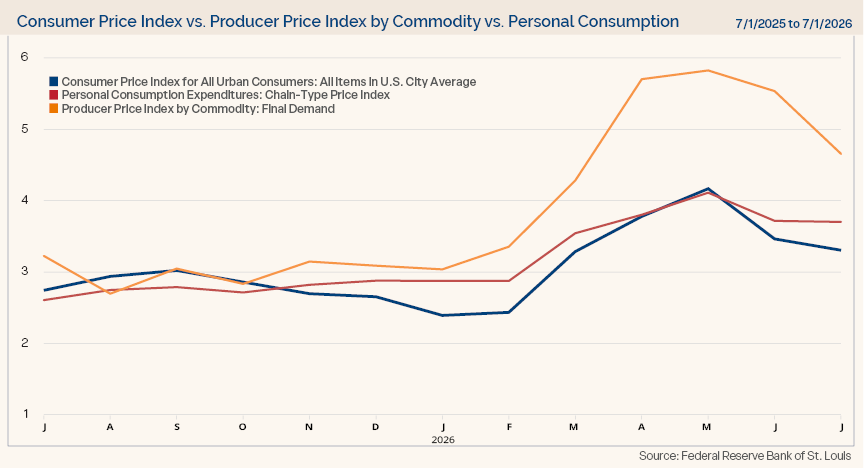
Clearly, oil prices have a direct impact on headline inflation, and price indices showed mixed results in July. The Producer Price Index (PPI) was flat for July, when a 0.2% increase was expected. Subsequently, the annual increase came in at 4.7%, better than expectations of 4.9%. The core PPI reading rose 0.2% compared to expectations of 0.3%, but prior month data was doubled to a 0.4% increase from the 0.2% initial reading. The annual increase of core PPI of 4.2% was above expectations of 4.1% but improved from the 4.7% annual gain last month.
The Consumer Price Index (CPI) matched expectations across the board. The headline CPI was up 0.1% for the month and 3.4% for the year, while core CPI rose 0.2% for the month and 2.5% for the year. The Personal Consumption Expenditures (PCE) price index rose by 0.2%, above expectations of 0.1%, resulting in the annual increase being 0.1% higher than expectations at 3.7%. The core PCE reading matched estimates with a 0.2% monthly and a 3.3% annual gain. Inflation data seemed to trend in a positive direction in July without any real surprises, but inflation itself remains elevated. Chart 2 shows inflation trended lower in July, but that rate of improvement slowed for the two consumer-based price indices (CPI and PCE). With oil prices rising in August, inflation pressures might return when August price index readings are released.
Chart 2
Broader economic data was mixed in July but continued to reflect ongoing economic progress. The Institute for Supply Management (ISM) Manufacturing Index remained positive in July for the seventh consecutive month and improved to 55.6, the best reading since May 2022, as new orders were strong and employment showed expansion for the first time in almost three years. For August, the ISM Manufacturing Index modestly cooled to 54.6, which was lower than estimates of 55.2, but still comfortably in expansionary territory. The ISM Non-Manufacturing Index, which covers the much larger service industries in the U.S. economy, continued to reflect expansion as well. This reading slightly disappointed at 54.1 compared to expectations of 54.5, but it was a modest increase from June’s level. Recall that for the ISM indices, readings above 50 represent expansion and below 50 reflect contraction.
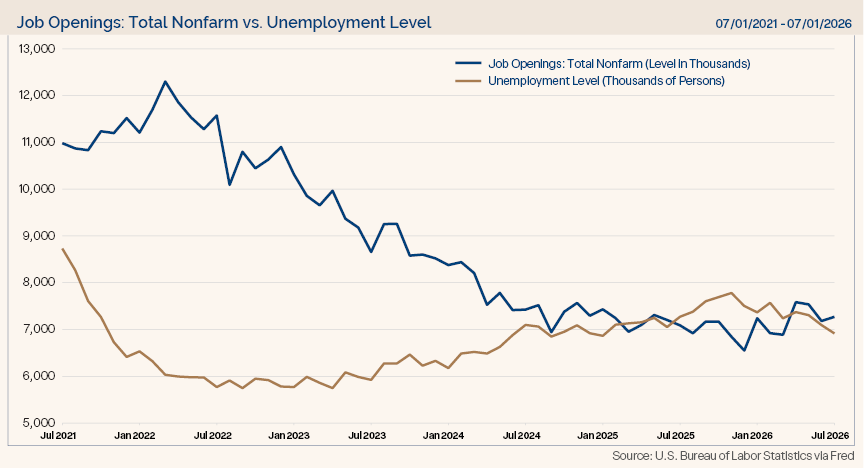
However, July job market data was disappointing. Nonfarm payrolls fell by 23,000 when an increase of 80,000 jobs was expected. Prior two-month net revisions showed more than 100,000 fewer jobs created than previously reported. The World Cup might have caused some distortion to the data as the event’s start and end affected hiring and firing decisions. At the same time, the unemployment rate declined unexpectedly to 4.1% when it was expected to remain at 4.2%. Sources for payroll data and the unemployment rate are different and can show mixed messages at times. This is why we look at broader trends and a multitude of data points. Job openings have slowed as the number of unemployed has risen in recent years, but openings remain above the number of unemployed. See Chart 3.
Chart 3
Consumer spending disappointed, as well. Retail sales (ex auto and gas) declined by 0.2% when a monthly increase of 0.3% was expected. This drop likely reflected two unique items: Amazon Prime Day moving to June this year (not July) and fading tax-refund spending. As we have often said, we do not read too much into one data point, and we do not believe the drop in retail sales in July reflects a broader decline in the overall consumer spending appetite. For example, another reading on personal spending increased by 0.2% in July when the expected gain was only 0.1%, but it will be worth monitoring spending data moving forward to see how consumers are behaving. We will also keep a close watch on the job market after a couple of months of rather poor reports. Consumer sentiment weakened in August — not a surprise as we know a driving factor of consumer confidence is gasoline prices, which rose in August as we previously discussed. The ongoing conflict in Iran continues to weigh on consumer attitudes, but spending has generally remained solid and has continued to support economic growth.
The second reading of Q2 GDP reflected the same 1.5% annualized growth rate, matching expectations. The personal consumption component (another sign of household spending) improved modestly from the initial estimate. The Atlanta Fed’s GDPNow forecast for Q3 shows an expected 4.6% annualized GDP growth rate (as of August 31, 2026).
The FOMC did not meet in August, but Chair Warsh spoke at the annual Jackson Hole economic symposium late in the month. His speech was widely viewed as hawkish as he continued to talk about the Fed’s determination to bring down inflation. At the same time, he continued not to give insight into what the Fed is planning on doing in the months ahead, as he seems determined to significantly reduce (if not eliminate all together) forward guidance by the Fed. Market probabilities for a rate hike before year end rose following his comments. On August 24, the probability of a rate hike at the September meeting was at a mere 41%. Following his speech on August 28, those odds rose to 57%, and by month’s end, odds increased even more to an almost 66% probability of a September rate hike. By the end of August, the odds slightly favored a second potential hike by the December FOMC meeting with a 40.2% probability of two rate hikes compared to a 39.1% probability of just one hike (per the CME FedWatch tool as of August 31, 2026). Interestingly, the market is not pricing in any other Fed action through October 2027 after this expected action to close out 2026. The market is closely watching the Fed’s expectations and actions with new leadership in place and at a time when rates have risen in recent months. It is important to note that stocks have historically done well when the Fed is raising rates slowly, which is what we expect.
Equities rose in August, but most of that gain occurred in the first part of the month. Volatility took over from that point with some weakening to close out the month as hostilities with Iran (and higher oil prices) returned. Interest rates moved lower to start the month but trended higher through most of August in a volatile environment as well. Earnings season was strong once again and continues to be the driving force moving equity markets higher although AI concerns, particularly the buildout of data centers, have become a point of major focus in a very politicized environment. Consumers continue to be resilient, but we need to watch data like spending activity and job market readings. Overall, the U.S. economy shows ongoing growth. Inflation is elevated, but if the conflict with Iran improves and oil prices retreat, inflation pressures could subside, although we seem to have taken a recent step backward on this front. With midterm elections looming, elevated market volatility would not be surprising, but stellar earnings from corporate America continue to create a strong fundamental backdrop for the stock market. As always, we believe it is imperative for investors to stay focused and not let short-term swings in the market, which could materialize at any time, derail them from their longer-term objectives.
Economic Data
| Event | Period | Estimate | Actual | Prior | Revised |
|---|---|---|---|---|---|
| ISM Manufacturing | July | 53.9 | 55.6 | 53.3 | — |
| ISM Services Index | July | 54.5 | 54.1 | 54.0 | — |
| Change in Nonfarm Payrolls | July | 80k | -23k | 57k | 20k |
| Unemployment Rate | July | 4.2% | 4.1% | 4.2% | — |
| Average Hourly Earnings YoY | July | 3.5% | 3.2% | 3.5% | 3.4% |
| JOLTS Job Openings | June | 7454k | 7359k | 7594k | 7537k |
| PPI Final Demand MoM | July | 0.2% | 0.0% | -0.3% | -0.1% |
| PPI Final Demand YoY | July | 4.9% | 4.7% | 5.5% | — |
| PPI Ex Food and Energy MoM | July | 0.3% | 0.2% | 0.2% | 0.4% |
| PPI Ex Food and Energy YoY | July | 4.1% | 4.2% | 4.7% | — |
| CPI MoM | July | 0.1% | 0.1% | -0.4% | — |
| CPI YoY | July | 3.4% | 3.4% | 3.5% | — |
| CPI Ex Food and Energy MoM | July | 0.2% | 0.2% | 0.0% | — |
| CPI Ex Food and Energy YoY | July | 2.5% | 2.5% | 2.6% | — |
| Retail Sales Ex Auto and Gas | July | 0.3% | -0.2% | 0.4% | — |
| Industrial Production MoM | July | 0.3% | 0.2% | 0.1% | 0.3% |
| Building Permits | July P | 1375k | 1443k | 1374k | __ |
| Housing Starts | July | 1345k | 1239k | 1427k | 1415k |
| New Home Sales | July | 620k | 607k | 628k | 678k |
| Existing Home Sales | July | 4.05m | 4.06m | 4.09m | 4.13m |
| Leading Index | July | 0.1% | 0.2% | -0.2% | -0.1% |
| Durable Goods Orders | July P | 0.5% | 1.1% | 0.5% | — |
| GDP Annualized QoQ | 2Q S | 51.0 | 54.4 | 49.5 | — |
| U. of Mich. Sentiment | Aug P | 55.0 | 51.0 | 55.2 | — |
| Personal Income | July | 0.2% | 0.4% | 0.2% | — |
| Personal Spending | July | 0.1% | 0.2% | 0.3% | — |
| S&P Cotality CS 20-City YoY NSA | June | 1.80% | 2.10% | 1.63% | 1.65% |
Source: Bloomberg; P=Preliminary, T=Third Reading
For illustrative purposes only. Past performance is not indicative of future results. Past actual, projections, or other forward looking statements regarding future financial performance of markets are only projections and actual events or results may differ materially.
Disclosures
Forward looking statements cannot be guaranteed. Past performance is not indicative of future results. The opinions referenced are as of the date of publication and are subject to change due to changes in the market or economic conditions and may not necessarily come to pass. Material presented has been derived from sources considered to be reliable and has not been independently verified by us or our personnel. Nothing herein should be construed as a solicitation, recommendation or an offer to buy, sell or hold any securities, other investments or to adopt any investment strategy or strategies. Investors must make their own decisions based on their specific investment objectives and financial circumstances. Investing involves risk, including loss of principal.Clark Capital Management Group is an investment adviser registered with the U.S. Securities and Exchange Commission. Registration does not imply a certain level of skill or training. More information about Clark Capital Management Group’s advisory services can be found in its Form ADV and/or Form CRS, which are available upon request.
The manager utilizes a proprietary investment model to assist with the construction of the strategy and to assist the manager with making investment decisions. Investments selected using this process may perform differently than expected as a result of the factors used in the model, the weight placed on each factor, and changes from the factors’ historical trends. There is no guarantee that Clark Capital’s use of a model will result in effective investment decisions.
Fixed income securities are subject to certain risks including, but not limited to: interest rate (changes in interest rates may cause a decline in market value or an investment), credit, prepayment, call (some bonds allow the issuer to call a bond for redemption before it matures), and extension (principal repayments may not occur as quickly as anticipated, causing the expected maturity of a security to increase).
Non-investment-grade debt securities (high-yield/junk bonds) may be subject to greater market fluctuations, risk of default or loss of income and principal than higher-rated securities.
The value of investments, and the income from them, can go down as well as up and you may get back less than the amount invested.
Equity securities are subject to price fluctuation and possible loss of principal. Stock markets tend to move in cycles, with periods of rising prices and periods of falling prices. Certain investment strategies tend to increase the total risk of an investment (relative to the broader market). Strategies that concentrate their investments in limited sectors are more vulnerable to adverse market, economic, regulatory, political, or other developments affecting those sectors.
JOLTS is a monthly report by the Bureau of Labor Statistics (BLS) of the U.S. Department of Labor counting job vacancies and separations, including the number of workers voluntarily quitting employment.
The Core Consumer Price Index (CPI) is a measure of the average change over time in the prices paid by urban consumers for a market basket of consumer goods and services.
The Core Producer Price Index (PPI) program measures the average change over time in the selling prices received by domestic producers for their output. The prices included in the PPI are from the first commercial transaction for many products and some services.
The PCE price index, released each month in the Personal Income and Outlays report, reflects changes in the prices of goods and services purchased by consumers in the United States.
References to market or composite indices, benchmarks or other measures of relative market performance over a specified period of time (each, an “index”) are provided for your information only. Reference to an index does not imply that the portfolio will achieve returns, volatility or other results similar to that index. The composition of the index may not reflect the manner in which a portfolio is constructed in relation to expected or achieved returns, portfolio guidelines, restrictions, sectors, correlations, concentrations, volatility or tracking error targets, all of which are subject to change. Investors cannot invest directly in an index.
The Dow Jones Industrial Average® (The Dow®), is a price-weighted measure of 30 U.S. blue-chip companies.
The index covers all industries except transportation and utilities.
The Bloomberg Barclays U.S. Municipal Index covers the USD-denominated long-term tax exempt bond market. The index has four main sectors: state and local general obligation bonds, revenue bonds, insured bonds and prerefunded bonds.
The Bloomberg US Treasury Index measures US dollar-denominated, fixed-rate, nominal debt issued by the US Treasury. Treasury bills are excluded by the maturity constraint, but are part of a separate Short Treasury Index.
The NASDAQ Composite is a stock market index of the common stocks and similar securities listed on the NASDAQ
stock market.
The S&P 500 measures the performance of the 500 leading companies in leading industries of the U.S. economy, capturing 80% of U.S. equities.
The S&P 500® Equal Weight Index (EWI) is the equal-weight version of the widely-used S&P 500. The index includes the same constituents as the capitalization weighted S&P 500, but each company in the S&P 500 EWI is allocated a fixed weight or 0.2% of the index total at each quarterly rebalance.
The University of Michigan Consumer Sentiment Index rates the relative level of current and future economic conditions. There are two versions of this data released two weeks apart, preliminary and revised. The preliminary data tends to have
a greater impact. The reading is compiled from a survey of around 500 consumers.
The Russell 1000 Index is a stock market index that tracks the highest-ranking 1,000 stocks in the Russell 3000 Index, which represent about 93% of the total market capitalization of that index.
The Russell 2000 Index is a small-cap stock market index that represents the bottom 2,000 stocks in the Russell 3000.
The Russell 3000 Index measures the performance of the 3,000 largest U.S. companies based on total market capitalization, which represents approximately 98% of the investable U.S. equity market.
Russell 1000 Growth Index tracks companies with higher price-to-book ratios, higher sales per share growth, and higher I/B/E/S forecast growth.
Russell 1000 Value Index tracks companies with lower price-to-book ratios and lower expected and historical growth rates. Russell’s value indexes focus more on dividend yield.
Nonfarm payrolls (NFPs) are the measure of the number of workers in the United States excluding farm workers and workers in a handful of other job classifications.
A municipal bond, commonly known as a muni, is a bond issued by state or local governments, or entities they create such as authorities and special districts.
The CBOE Volatility Index (VIX) is a real-time index that measures the expected volatility of the S&P 500 over the next
30 days.
The U.S. Treasury index is based on the recent auctions of U.S. Treasury bills. Occasionally it is based on the U.S. Treasury’s daily yield curve.
The 30 Year Treasury Rate is the yield received for investing in a US government issued treasury security that has a maturity of 30 years.
The Bloomberg Barclays U.S. Corporate High-Yield Index covers the U.S. dollar-denominated, non-investment grade, fixed-rate, taxable corporate bond market. Securities are classified as high-yield if the middle rating of Moody’s, Fitch,
and S&P is Ba1/BB+/BB+ or below.
The Bloomberg Barclays U.S. Credit Index measures the investment grade, U.S. dollar denominated, fixed-rate taxable corporate and government related bond markets.
The Bloomberg Aggregate Bond Index or “the Agg” is a broad-based fixed-income index used by bond traders and the managers of mutual funds and exchange-traded funds (ETFs) as a benchmark to measure their relative performance.
The Bloomberg US Trsy Bellwether 30Y is a U.S. Treasury debt obligation that has a maturity of 30 years.
The ISM Non-Manufacturing Index is an index based on surveys of more than 400 non-manufacturing firms’ purchasing and supply executives, within 60 sectors across the nation, by the Institute of Supply Management (ISM). The ISM Non-Manufacturing Index tracks economic data, like the ISM Non-Manufacturing Business Activity Index. A composite diffusion index is created based on the data from these surveys, that monitors economic conditions of the nation.
ISM Manufacturing Index measures manufacturing activity based on a monthly survey, conducted by Institute for Supply Management (ISM), of purchasing managers at more than 300 manufacturing firms.
The MSCI Emerging Markets Index captures large and mid cap representation across 27 Emerging Markets (EM) countries.
The MSCI ACWI ex USA Index captures large and mid cap representation across 22 of 23 Developed Markets (DM) countries (excluding the US) and 27 Emerging Markets (EM) countries*. With 2,359 constituents, the index covers approximately 85% of the global equity opportunity set outside the US.
The S&P CoreLogic Case-Shiller 20-City Composite Home Price NSA Index seeks to measures the value of residential real estate in 20 major U.S. metropolitan areas. The U.S. Treasury index is based on the recent auctions of U.S. Treasury bills. Occasionally it is based on the U.S. Treasury’s daily yield curve.
The Leading Economic Index provides an early indication of significant turning points in the business cycle and where the economy is heading in the near term.
In the United States, the Core Personal Consumption Expenditure Price (CPE) Index provides a measure of the prices paid by people for domestic purchases of goods and services, excluding the prices of food and energy.
The Conference Board’s Leading Indexes are the key elements in an analytic system designed to signal peaks and troughs in the business cycle. The leading, coincident, and lagging economic indexes are essentially composite averages of several individual leading, coincident, or lagging indicators. They are constructed to summarize and reveal common turning point patterns in economic data in a clearer and more convincing manner than any individual component – primarily because they smooth out some of the volatility of individual components.
Gross domestic product (GDP) is the standard measure of the value added created through the production of goods and services in a country during a certain period.