

Good news! The results are in and the political texts and commercials can stop. As expected, the Democratic party swept both the House and Senate, setting the stage for a divided government for the next two years. As of Wednesday morning, Democrats are expected to hold 54 seats in the Senate and 228 in the House. The vote was a referendum on the party in power, same as 2022, 2018, 2014, 2010, and 2006. Twelve of the past fourteen elections were “change elections,” as neither party has figured it out yet. For longer perspective on the outcome, in midterm elections since 1900, the party in the White House has lost House seats 90% of the time and Senate seats 75% of the time.
What might this mean for policy over the next two years? The larger-than-expected majorities could give Democrats greater leverage in negotiations with the White House but will also dilute the influence of small factions within the Democratic caucus. Democrats could use fiscal deadlines to seek to limit the war with Iran, roll back selected tariffs, and reverse spending cuts enacted last year. Judicial and cabinet nominations will likely be blocked, and new investigations could bog down the legislative process. As far as other Trump administration initiatives, if the last two years of the Clinton and Obama administrations are any guide (both of which had the opposing party control Congress), Trump will likely use executive orders to push his agenda and the veto pen to shut down legislation from Congress.
This effectively creates gridlock in Washington, which historically has been good news for the stock market. An old Wall Street adage is “The market loves gridlock.” Chart 1 below shows the government makeup that we will have with the new Congress. This makeup has historically produced mediocre price gains (4.9%), total returns with dividends included averaged 8.58%, with gains 72.7% of the time. Those results are skewed lower by the global financial crisis in 2008, which also happens to be the last time we had a Republican president and a Democratic-controlled Congress.
Chart 1
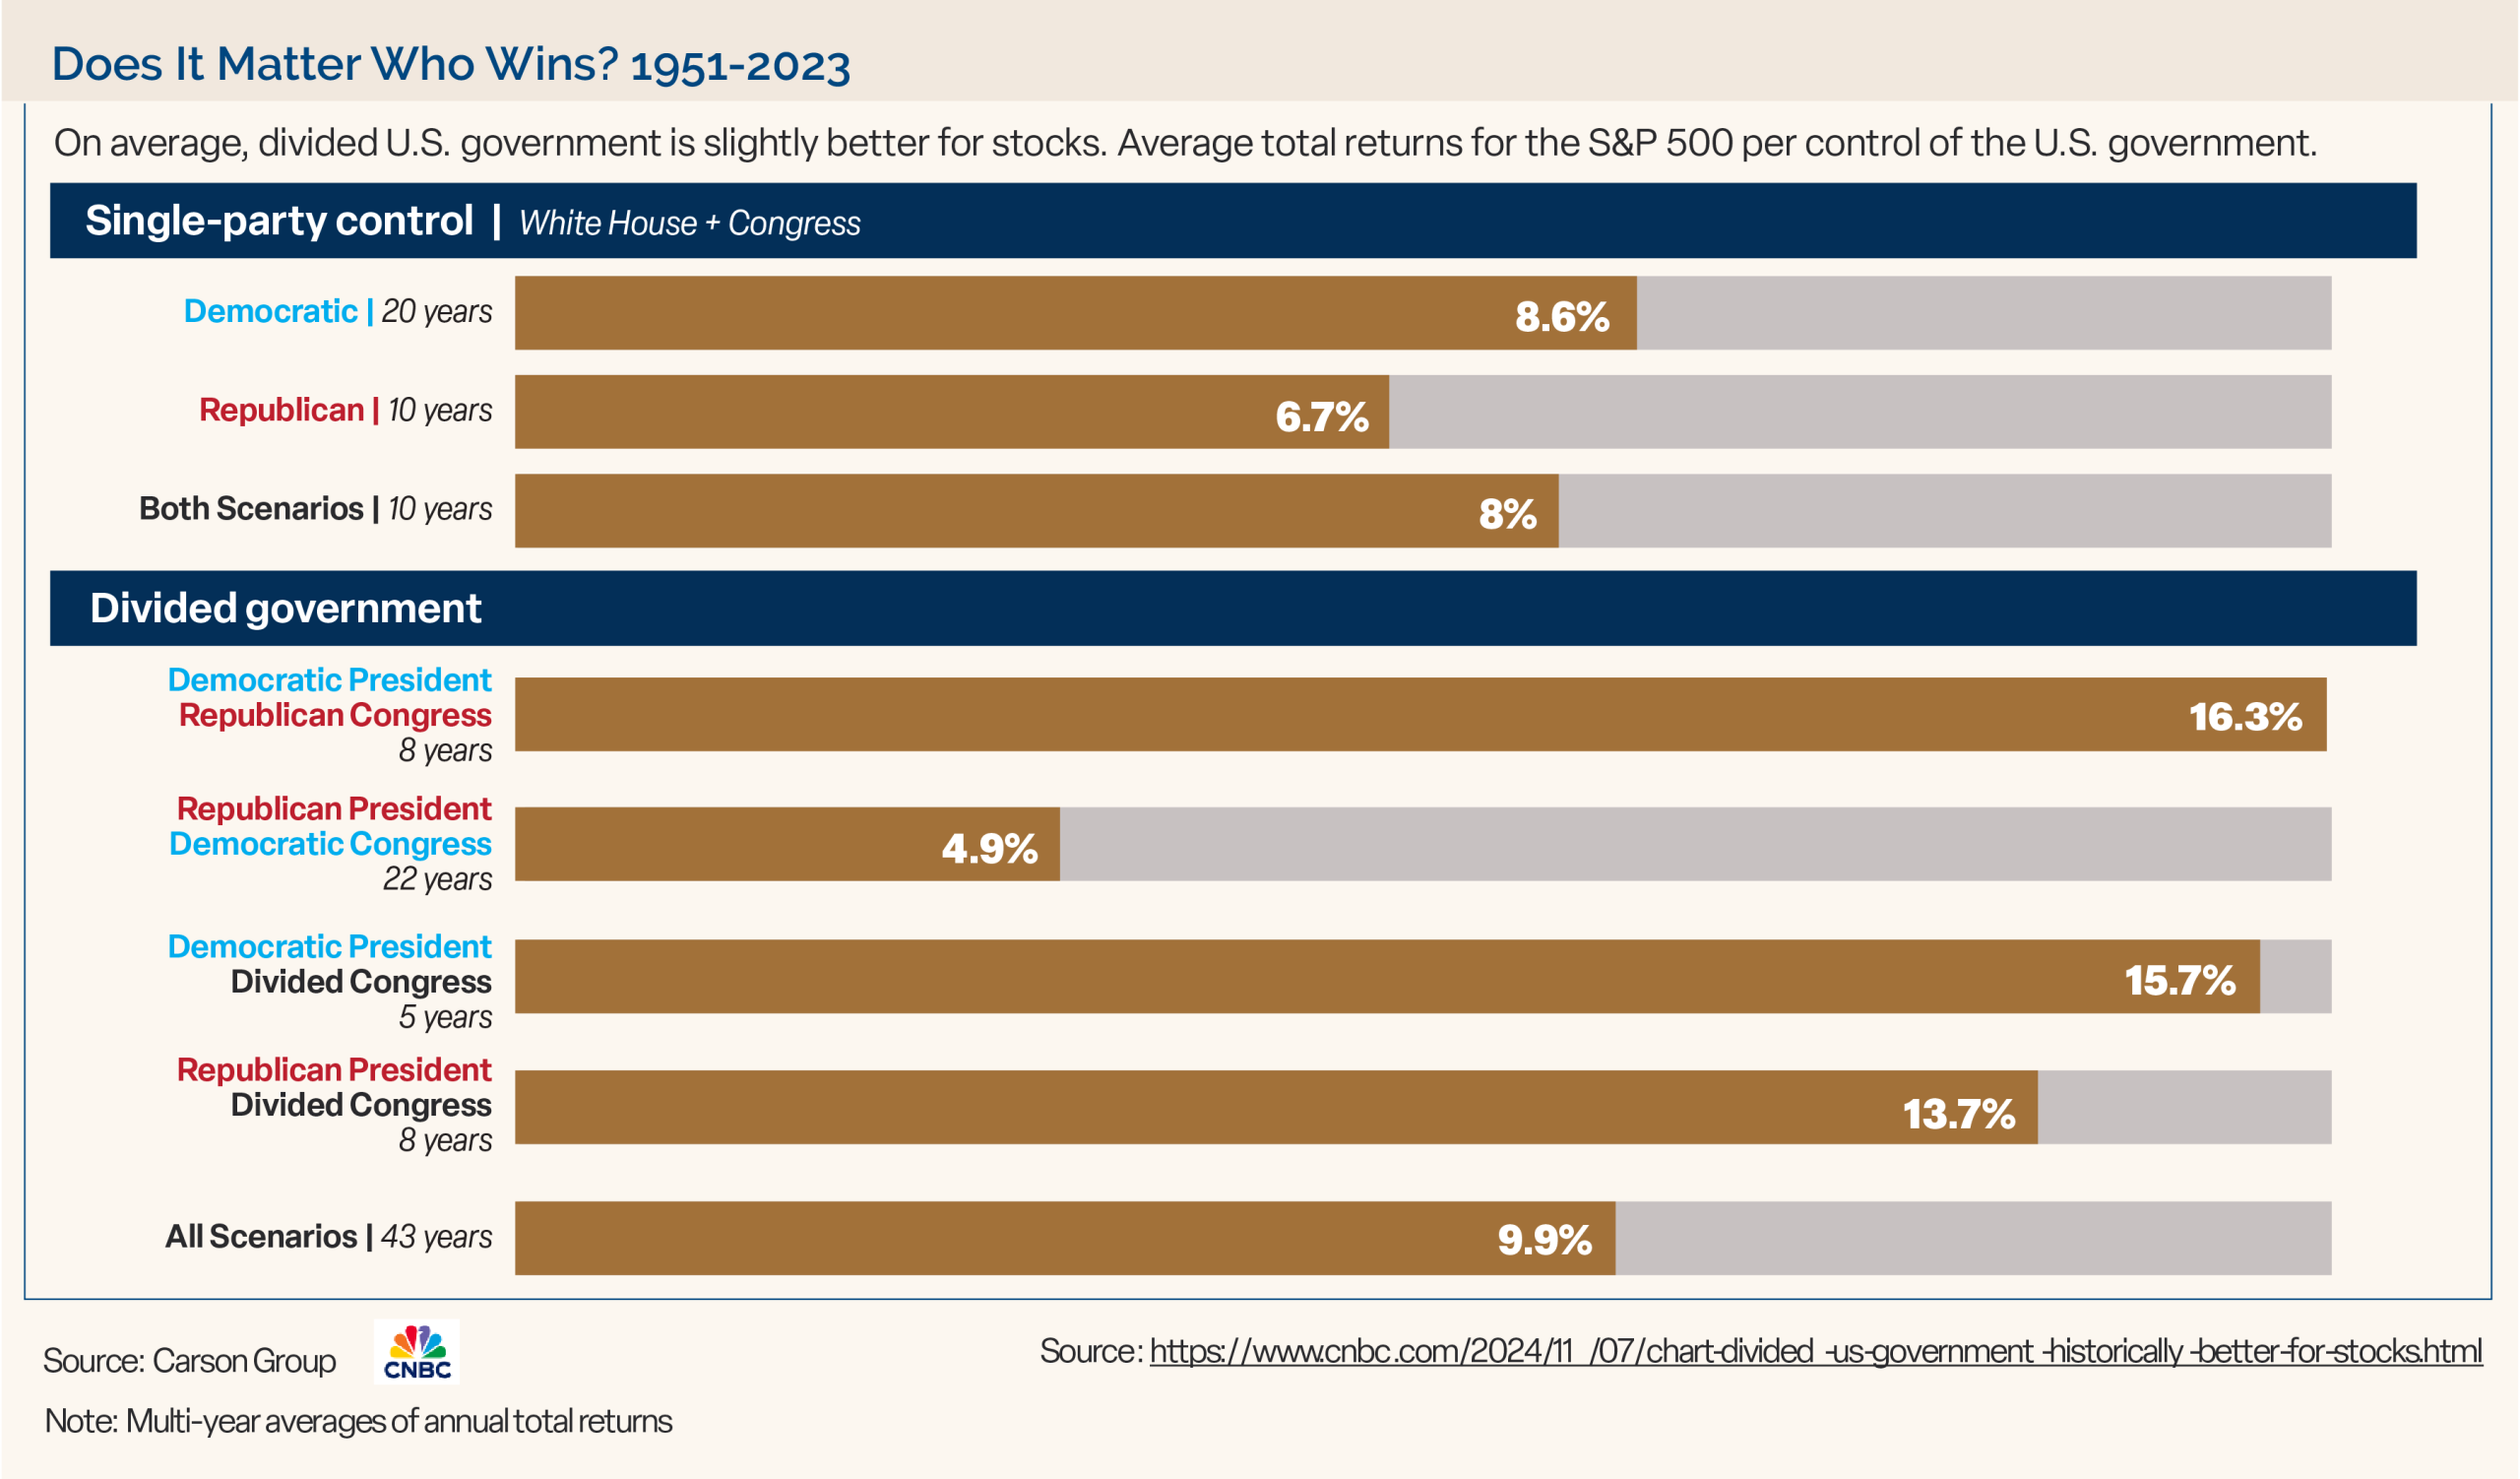
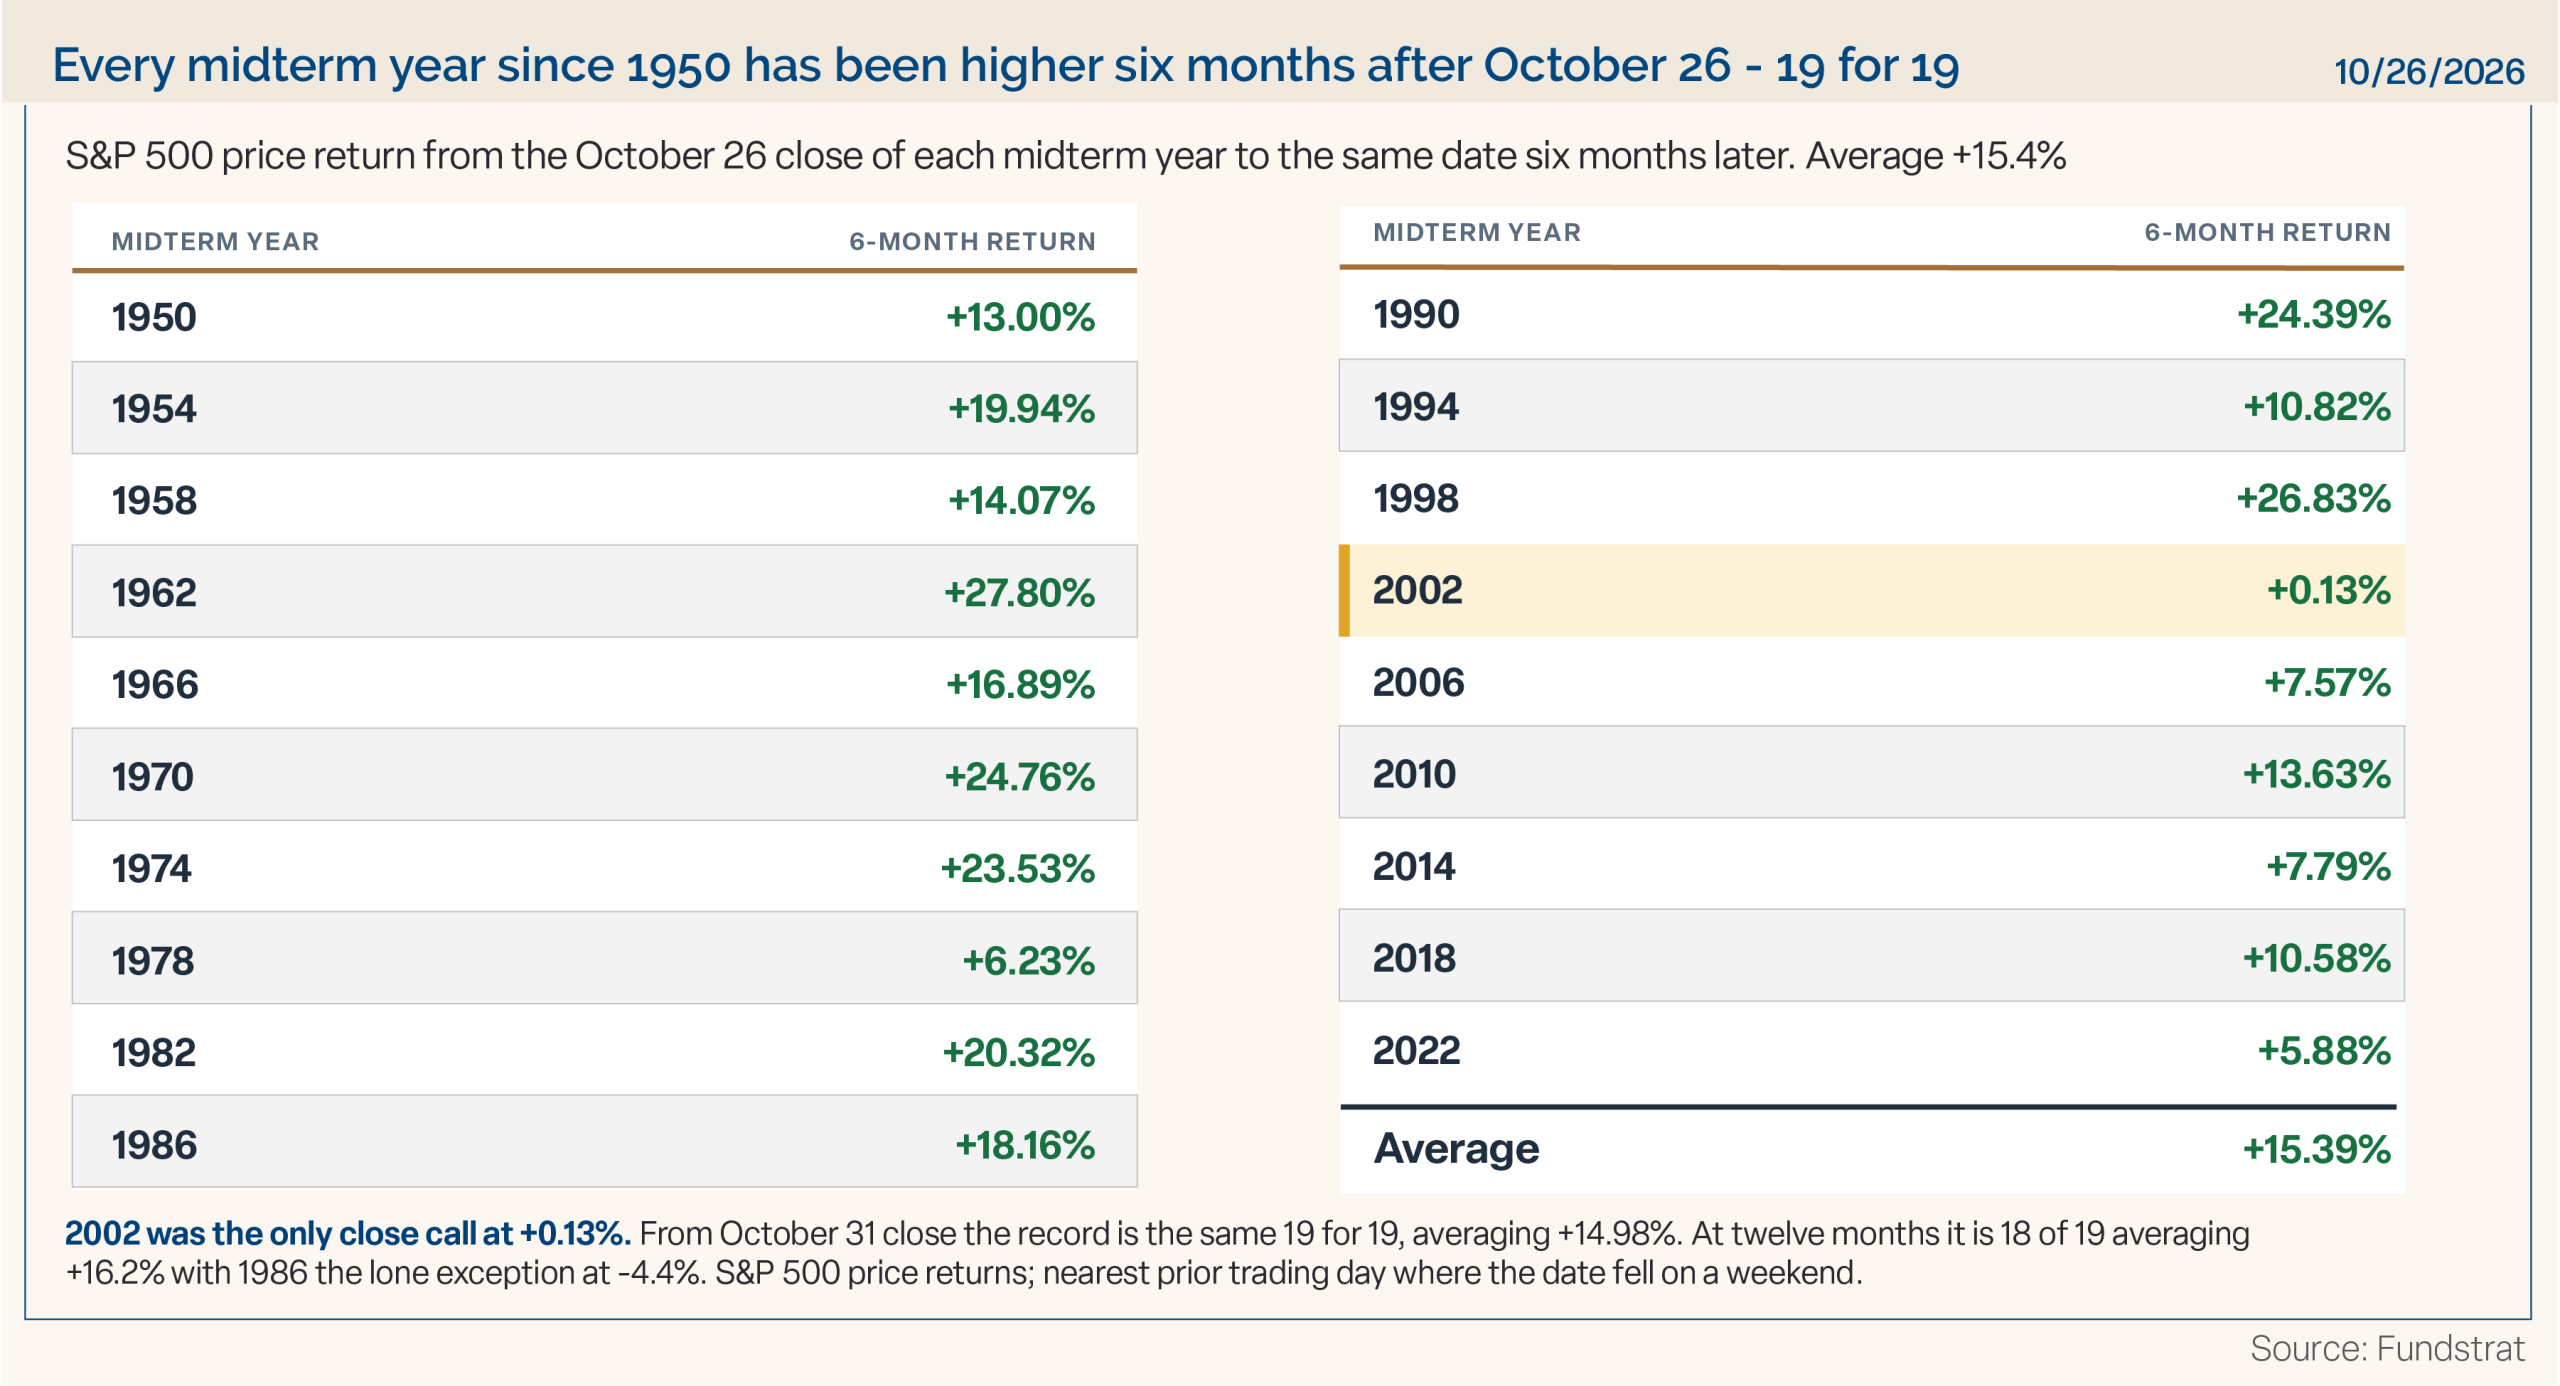
Chart 2 below is telling. Stocks don’t see red or blue, they see green. In every midterm election year since 1950, the S&P 500 has been up in the six months starting from late October. That is 19 up markets out of 19 midterm elections with an average return of 15.4%.
Chart 2
Ultimately, it is not Washington that drives stock prices. It is earnings, and the earnings outlook is good. On the heels of a strong second quarter, third-quarter earnings season has been robust. With 70% of the S&P 500 companies having reported, 86% exceeded analyst estimates. Blended year-over-year earnings for companies that have reported and estimates for those that have not yet reported are running at a 31.9% growth rate. It is rare to have such strong growth without the economy having emerged from a recession (easy year-over-year comparisons). That is clearly not the case currently. Since emerging from the COVID recession, the U.S. economy has expanded in 20 of 21 quarters. Third-quarter GDP reported last week exceeded estimates and grew at a 3.4% annual rate.
As always, we think it is important for investors to stay focused and not let short-term swings in the market derail them from their longer-term objectives.
The opinions referenced are as of the date of publication and are subject to change due to changes in the market or economic conditions and may not necessarily come to pass. There is no guarantee of the future performance of any Clark Capital investments portfolio. Material presented has been derived from sources considered to be reliable and has not been independently verified by us or our personnel. Nothing herein should be construed as a solicitation, recommendation or an offer to buy, sell or hold any securities, other investments or to adopt any investment strategy or strategies. For educational use only. Investors must make their own decisions based on their specific investment objectives and financial circumstances. Past performance does not guarantee future results.
References to market or composite indices, benchmarks or other measures of relative market performance over a specified period of time (each, an “index”) are provided for your information only. Reference to an index does not imply that the portfolio will achieve returns, volatility or other results similar to that index. The composition of the index may not reflect the manner in which a portfolio is constructed in relation to expected or achieved returns, portfolio guidelines, restrictions, sectors, correlations, concentrations, volatility or tracking error targets, all of which are subject to change. Investors cannot invest directly in an index.
Clark Capital Management Group, Inc., is an independent investment adviser registered under the Investment Advisers Act of 1940, as amended. Registration does not imply a certain level of skill or training. More information about Clark Capital, including investment strategies, fees and objectives, can be found in its Form ADV and/or Form CRS, which are available upon request.