
Clark Capital’s Bottom-Up, Fundamental Strategies
April was challenging for U.S. markets, as major indices declined for the third consecutive month due to U.S. tariff uncertainty and recession concerns. However, scaling back those same tariffs seems to have restored investor confidence as the month ended. The volatile and unpredictable nature of tariff policy likely gives all investors and manufacturers pause, increasing the risk premium assigned to U.S. assets in general.
On the economic front, GDP declined 0.3% in Q1, its first negative print since Q1 2022, as front-loaded imports surged to avoid forthcoming tariffs. However, the underlying economic fundamentals remained resilient with strong consumer spending and investment that was overshadowed by a surge in imports ahead of the tariffs.
Our equity portfolios continue to balance holdings between dominant large-cap growth companies and anti-fragile large-, small- and mid-cap companies, which continue to see strong business momentum. On the fixed income side, the Taxable Bond portfolio focus remained on keeping duration slightly longer than the index. Maturities and coupon payments continued to be reinvested in the five-year and longer portion of the credit curve. In addition to investing in maturities, as the credit curve steepened with credit spreads in the 10-year part of the curve moving higher than the five-year portion, shorter bonds were sold and longer bonds in the same name were bought.
Below are strategy updates from April:
Navigator® All Cap Core U.S. Equity
- The portfolio is fully invested with over 71% in large cap stocks and the remainder in mid- and small-cap companies and cash.
- The portfolio continues to balance portfolio holdings between dominant large-cap growth companies and those anti-fragile large-, small- and mid-cap companies, which continue to see strong business momentum.
- Our current weighting in the big six free cash flow margin monopolies is 25.0% vs approximately 24.8% in the Russell 3000. Albeit underweight to the benchmark, Information Technology remains the largest sector weight in the strategy at 25.9%.
- The three largest portfolio sectors at the end of the period were Information Technology, Financials, and Industrials.
- Our positioning in Industrials and Energy helped relative performance, while our positioning in Communication Services and Financials acted as a drag.
- The top three contributors to absolute portfolio return in the month were a U.S.-based construction and engineering company, a technology company that designs and sells products used in computers and smartphones, and a company that provides technology and professional services.
- The top three detractors to absolute portfolio return in the month were a financial technology company, an American health care company, and a media company that operates television and news outlets in the U.S.
- During the month, to benefit from improving business fundamentals, the three most recent additions to the portfolio were a regional banking company, a multinational healthcare company, and a U.S.-based construction and engineering company.
- The most recent exit was a technology company that provides data solutions.
Navigator® High Dividend Equity
- The portfolio is positioned with approximately 97.8% in developed countries with the remainder in cash. The United States represents the largest country weight at 91.2%, followed by the United Kingdom at 3.1%, and Switzerland at 2.0%.
- The portfolio consists of over 94% large-cap, 3% mid-cap, and the remainder is cash.
- Financials are the largest sector exposure at 23.3%, in line with the benchmark weight. The next three largest portfolio weights are Health Care, Industrials, and Information Technology at 15.1%, 14.7% and 9.0%, respectively.
- The top three contributors to absolute portfolio return in the month were a technology company that designs and sells products used in computers and smartphones, a global tobacco company, and one of the world’s largest retail chains.
- The top detractors were an American health care company and two major energy companies.
- Our positioning in Energy, Information Technology, and Health Care helped relative performance versus the exposure in Real Estate, Basic Materials and Financials, which acted as a drag.
- During the month, to benefit from improving business fundamentals, recent additions to the portfolio were an aerospace and defense company that engages in the provision of aerospace and defense systems for commercial, military, and government customers; a company that engages in the discovery, development, manufacture, and sale of healthcare products; and an insurance holding company.
- The three most recent exits were a large defense and aerospace company, a global medical technology company, and a major sporting goods company.
Navigator® Large Cap Growth
- The portfolio is fully invested with over 94% in large cap stocks.
- 99% of total holdings are in developed countries with ~91% based in the United States.
- Over 70% of the portfolio’s holdings are derived from the 100 largest cash flow producing companies with high and growing cash flows, high cash flow margins, and increasing sales.
- The three largest portfolio sectors at the end of the period were Information Technology, Communication Services, and Industrials.
- Our positioning in Industrials and Consumer Staples helped relative performance, while our positioning in Health Care and Information Technology acted as a drag.
- The top three contributors to absolute portfolio return in the month were a technology company that designs and sells products used in computers and smartphones, a global technology company known for developing and selling software, hardware, and cloud services, and a global energy technology company.
- The top three detractors to absolute portfolio return in the month were a global technology company known for its consumer electronics, software, and digital services, an American health care company, and a social media and technology company.
- During the month, to benefit from improving business fundamentals, the three most recent additions to the portfolio were a global science and technology company, a multinational health care company, and a global medical device company.
- The three most recent exits were a health insurance company that provides managed health care services, a global investment firm that specializes in private equity, credit, and hedge fund investments, and a global digital payment company.
Navigator® International Equity ADR
- The portfolio is positioned with ~16% in emerging markets with the balance in developed economies and cash. Great Britain, Canada, China, Japan, and Switzerland are the strategy’s largest country weights, all ranging between 7% and 17%.
- The portfolio continues to find undervalued, high-quality companies in both developed and emerging markets. Its exposure to China is now ~7.9%, which is slightly above its weighting in the All-Country World ex US benchmark.
- The top three contributors to absolute portfolio return in the month were a global energy technology company, a Spanish multinational utility company, and a Brazilian financial technology.
- The top three detractors to absolute portfolio return in the month were a major Chinese e-commerce company, a large Japanese banking and financial services company, and Brazil’s state-controlled oil company.
- Our positioning in Industrials and Utilities helped relative performance while our positioning in Financials and Consumer Discretionary acted as a drag.
- During the month, to benefit from improving business fundamentals, the three most recent additions to the portfolio were an international company that makes security products, one of Italy’s largest banking groups, and a major Japanese telecommunications company. The most recent exit was a global professional services firm.
- The three largest portfolio sectors at the end of the period were Financials, Information Technology, and Industrials.
Navigator® Taxable Fixed Income
- Within the portfolio, the focus remained on keeping the duration slightly longer than the index. Maturities and coupon payments continued to be reinvested in the five-year and longer portion of the credit curve.
- In addition to investing maturities, as the credit curve steepened with credit spreads in the 10-year part of the curve moving higher than the five-year portion, shorter bonds were sold and longer bonds in the same name were bought.
- One example is a global financial services firm where a five-year bond was sold at a yield of 4.99% and a 10-year bond was bought at a yield of 5.44%. This pickup of 45 basis points (bps) in yield is near the widest it’s been over the last two years.
- The same type of trade also was executed in a major American telecommunications and media company where 5.3 34 was bought at a yield of 5.06% and 1.5 31 was sold at a yield of 4.63%.
- This thesis of maximizing yield while also positioning to maximize total return will continue to be the near-term focus.
Navigator® Tax-Free Fixed Income
- Volatility was the month’s major theme, and lots of it! The muni index set its high of 503.51 and its low of 487.93 within four trading sessions of each mark – a move of over 3.00% in short order (Bloomberg data). Liberation day, its attendant fallout, continued uncertainty, and daily DC snippets all drove markets weaker.
- A preponderance of selling plagued the market, which eroded bond evaluations, and in turn sparked more selling.
- New issues became a source of pressure and uncertainty, as a swollen pipeline of new issues fluctuated between pricing and postponement over the month (ytd issuance of $133B as of 4/25 was up 17% yoy, BAML data). Two of the muni market’s largest disruptors —supply and uncertainty — made a difficult month harder. Deals came at distressed levels and required customer sales to raise cash for placement. Distressed selling, bid wanted, and general uncertainty all weighed in on broad market evaluations.
- The good news? Weakness and uncertainty also breed opportunity, and rising yields increase taxable equivalent yields, current yields, the value of the exemption and cross market relative value. Further they allow us to exercise greater pricing pressure on buys, as a price maker rather than taker. A 3.00% generic five-year muni now has a taxable equivalent of over 5%, and although it is off the month’s high, closed at a whopping 82% of treasuries.
- Using Bloomberg’s AAA revenue and A revenue bond curves, we note that five-year spreads remained insulated in the outright rate selloff — somewhat converse to what conventional wisdom would predict in such a rates/vol move. The behavior can be explained by typical muni lag, the demand imbalance and supply impairment in lower investment grade paper, and the market’s predilection to sell high grade bonds into market weakness thinking they will perform better in liquidation.
- We used such behavior to add to high-grades at distressed levels. Conversely, spread widening 10 years and longer was driven by wholesale fund and ETF liquidation, and in our eyes also created opportunity.
- Credit is still in our headlights, but it’s more sector-dependent and rides on whom the Federal administration is targeting with policy. At this time, we are flat most private colleges and indeed all the Ivys, as federal funding could be pulled on an ad-hoc basis. Spreads have widened, and we will monitor developments in higher ed, healthcare and specific issuers to determine points of re-entry.
Clark Capital’s Top-Down, Quantitative Strategies
The primary drivers of several of our tactical strategies, including Fixed Income Total Return, Global Tactical, and Global Risk Managed, are the macro allocations that are driven by our relative strength credit risk management models. Those models dictate the strategies’ allocations to risk-on and risk-off allocations. Those tactical strategies had been invested in a risk on position for nearly a year, since November 6, 2023, before turning defensive on April 7. Our relative strength models are quantitative, employing historical data that is not affected by emotion or personal bias and does not rely on forecasting. They are disciplined, objective, and designed to manage risk and turn defensive when risk is elevated. We have successfully navigated challenging markets environments using those models for over 20 years, avoiding much of the Global Financial Crisis, Powell’s Taper Tantrum, and the COVID meltdowns. The past month has proven difficult for those models as headline risk, rather than credit and economic trends, has roiled the markets. Our tactical strategies experienced a challenging month as trends have shifted on a dime with tariff news, rumors, and a 90-day pause.
The tariff drama and volatility over the past month upended a relatively calm environment for risk assets and depressed both consumer and investor confidence. Headline risk remains ever present, making it extremely difficult to gauge both the short-term and long-term impacts of the tariffs. However, the rhetoric and tone coming out of Washington, D.C., continues to moderate as progress on trade negotiations seems to be trending in a positive direction.
Below are strategy updates from April:
Navigator® Alternative
- Event driven and long-short equity are leading the mutual fund core, while managed futures continue to struggle amid a lack of trends.
- The portfolio favors gold and silver and the associated miners, but we recently reduced these positions after their spike and overbought technicals. We will look to increase these positions as they correct.
- The portfolio also favors energy and commodity producers, semiconductors, cloud computing, and private equity-like business development corporations.
Navigator® Fixed Income Total Return (MultiStrategy Fixed Income)
- We turned defensive after the shocking tariff announcement, but credit conditions have improved.
- In late April, our models began to favor riskier high yield credit but only in moderation. As a result, our portfolio currently owns 50% high yield credit and 50% in cash equivalents.
- Such a stance fairly reflects the highly uncertain market environment, but one in which potential upside risks like sudden tariff deal announcements are now equal to downside risks like stalling economic activity leading to recession.
Navigator® Global Risk Management
- The portfolios shifted to defense following the early April tariff announcement. As credit stabilized, our models improved, and we moved to 50% risk on in equities and 50% cash equivalents.
- The tactical fixed income exposures also shifted from risk on to risk off and back to partial risk on in high yield and investment grade corporate debt. International stocks have been quite strong and have led our equity holdings in 2025.
- Treasuries have gained strength as investors build three or more rate cuts into 2025, and they would be our defensive vehicle of choice if we turn risk-off.
Navigator® Global Tactical
- After the portfolios shifted to defense following the early April tariff announcement, our credit models have improved, and indications have become more balanced. As a result, the portfolio’s tactical sleeve moved to 50% risk-on equities and 50% cash equivalents.
- Our mixed position is a result of very high market uncertainty, but now we can assert bullish upside opportunities are equally likely as downside surprises like job losses and an eventual recession.
Navigator® U.S. Sector Opportunity
- The portfolio moved to increase its indexed position during the market decline, and more cyclical Financials, Industrials, and cybersecurity represent our largest positions.
- Our rankings added smaller defensive Utilities and Staples, but with the market rally, they could soon exit.
- Technology industries, such as internet and software are on the rise, while Energy and Discretionary continue to rank poorly.
Navigator® U.S. Style Opportunity (MultiStrategy Equity)
- The portfolio moved toward a largely indexed stance as the decline deepened in April. We moved to neutralize our market beta and wait for new leadership to emerge after the decline.
- Right now, large-cap growth appears to be emerging as leadership, and we are likely to begin to favor that area soon.
- Value stocks and defensive factors are falling in our ranks, and mid- and small-caps linger near the bottom.
Navigator® U.S. Strategic Beta
- The portfolio undertook several changes in April as the decline set in, including taking some tax losses and moving to neutralize the portfolio’s mid- and small-cap positions.
- The portfolio maintains a modest growth overweight (particularly large-cap growth), and we added active mid- and small-cap ETFs.
The views expressed are those of the author(s) and do not necessarily reflect the views of Clark Capital Management Group. The opinions referenced are as of the date of publication and are subject to change due to changes in the market or economic conditions and may not necessarily come to pass. There is no guarantee of the future performance of any Clark Capital investments portfolio. Material presented has been derived from sources considered to be reliable, but the accuracy and completeness cannot be guaranteed. Nothing herein should be construed as a solicitation, recommendation or an offer to buy, sell or hold any securities, other investments or to adopt any investment strategy or strategies. For educational use only. This information is not intended to serve as investment advice. This material is not intended to be relied upon as a forecast or research. The investment or strategy discussed may not be suitable for all investors. Investors must make their own decisions based on their specific investment objectives and financial circumstances. Past performance does not guarantee future results.
Fixed income securities are subject to certain risks including, but not limited to: interest rate (changes in interest rates may cause a decline in market value of an investment), credit, payment, call (some bonds allow the issuer to call a bond for redemption before it matures), and extension (principal repayments may not occur as quickly as anticipated, causing the expected maturity of a security to increase).
Foreign securities are more volatile, harder to price and less liquid than U.S. securities. They are subject to different accounting and regulatory standards and political and economic risks. These risks are enhanced in emerging market countries.
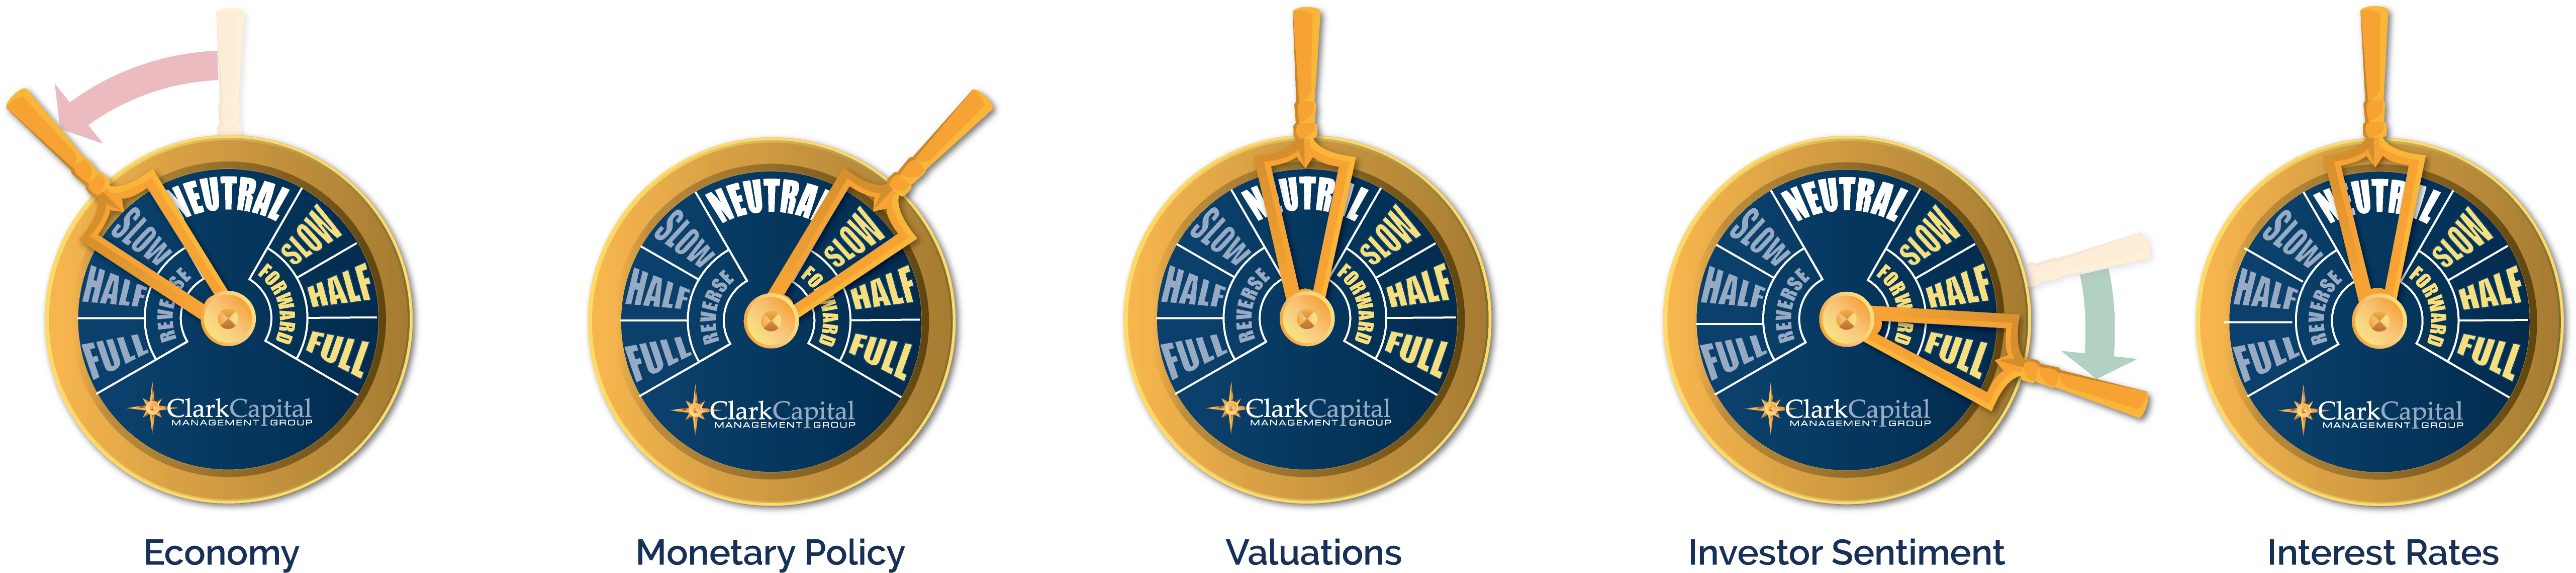
The “Economic Gauges” represent the firm’s expectations for the market, and how changes in the market will affect the strategy, but are only projections which assume certain economic conditions and industry developments and are subject to change without notice. For educational use only.
The S&P 500 measures the performance of the 500 leading companies in leading industries of the U.S. economy, capturing 75% of U.S. equities.
A 10-year Treasury note is a debt obligation issued by the U.S. Treasury Department that has a maturity of 10 years.
The CBOE Volatility Index (VIX) is a real-time index that represents the market’s expectations for the relative strength of near-term price changes of the S&P 500 Index (SPX).
The Russell 2000 Index is a small-cap U.S. stock market index that makes up the smallest 2,000 stocks in the Russell Index.
The Bloomberg 5-Year Municipal Bond Index provides a broad-based performance measure of the U.S. municipal bond market, consisting of securities with 4-6 year maturities.
The Bloomberg U.S. Corporate High-Yield Index covers the U.S. dollar-denominated, non-investment grade, fixed-rate, taxable corporate bond market. Securities are classified as high-yield if the middle rating of Moody’s, Fitch, and S&P is Ba1/BB+/BB+ or below.
Treasury yield is the return on investment, expressed as a percentage, on the U.S. government’s debt obligations. Looked at another way, the Treasury yield is the effective interest rate that the U.S. government pays to borrow money for different lengths of time.
The MSCI All Country World Index (ACWI) ex US is a market capitalization weighted index designed to provide a broad measure of equity-market performance throughout the world. The MSCI ACWI is maintained by Morgan Stanley Capital International (MSCI) and is comprised of stocks from 22 of 23 developed countries and 24 emerging markets.
AAA bonds are bonds that have the highest credit rating possible, indicating that they are considered a safe investment with the lowest risk of default.
The chartered financial analyst (CFA) charter is a globally-recognized professional designation offered by the CFA Institute, an organization that measures and certifies the competence and integrity of financial analysts.
Non-investment-grade debt securities (high-yield/junk bonds) may be subject to greater market fluctuations, risk of default or loss of income and principal than higher-rated securities.
The securities of mid-cap companies may be subject to more abrupt or erratic market movements and may have lower trading volumes.
This document may contain certain information that constitutes forward-looking statements which can be identified by the use of forward-looking terminology such as “may,” “expect,” “will,” “hope,” “forecast,” “intend,” “target,” “believe,” and/or comparable terminology (or the negative thereof). Forward looking statements cannot be guaranteed. No assurance, representation, or warranty is made by any person that any of Clark Capital’s assumptions, expectations, objectives, and/or goals will be achieved. Nothing contained in this document may be relied upon as a guarantee, promise, assurance, or representation as to the future.
Clark Capital Management Group, Inc. is an investment adviser registered with the U.S. Securities and Exchange Commission. Registration does not imply a certain level of skill or training. More information about Clark Capital’s advisory services and fees can be found in its Form ADV, and/or Form C&S which are available upon request.

