
Clark Capital’s Bottom-Up, Fundamental Strategies
Despite ongoing tensions — including President Trump’s continued pressure on Fed Chair Powell, ongoing trade negotiations, and geopolitical issues across the globe — the markets continued to push higher in July. Large-cap U.S. equities surged to new highs. For the month, the Russell 1000 Growth Index climbed 3.78%, the Russell 1000 Value Index gained just 0.57%, the S&P 500 rose 2.17%, and the Russell 2000 Index added 1.73%. On the equity front, international stocks lagged with the MSCI All Country World Index ex-U.S. posting a 0.29% loss. Currently in the middle of second quarter earnings season, to date, 52% of the S&P 500 companies reported 2Q results with sales growth of +6.7% and earnings growth of +8.5%, surprising by +2.3% and +6.7% respectively. Forward 12-month earnings forecasts for the S&P 500 have risen to new highs, helping propel stocks higher despite elevated valuations.
The bond market remained focused on tariffs and the resilient economy in July. As the August 1 tariff deadline approached, more trade deals were struck, and the expected impact on the economy continued to decline. Treasury yields rose during the month with the two-year and 10-year yields ending the month at 3.96% and 4.36%, respectively.
Our equity strategies continue to focus on companies we consider to be high quality with business momentum. Longer-term portfolio themes in focus include investing in dividend growers benefitting from the AI power up, momentum, defense, consumer stocks with pricing power, onshoring, and the FX tailwind. In the Taxable Bond portfolio, the focus remained on keeping the duration slightly longer than the index. We continued reinvesting maturities and coupon payments in the five-year and longer portion of the curve.
Below are strategy updates from July:
Navigator® All Cap Core U.S. Equity
- The portfolio is fully invested with over 76% in large-cap stocks and the remainder in mid-cap stocks, small-cap stocks, and cash
- We believe the portfolio continues to balance portfolio holdings between dominant large-cap growth companies and those anti-fragile large-, mid-, and small-cap companies that continue to see strong business momentum.
- Our current weighting in the big six free cash flow margin monopolies is 28.7% vs. approximately 28.1% in the Russell 3000. Albeit underweight to the benchmark, Information Technology remains the largest sector weight in the strategy at 30.9%.The three largest portfolio sectors at the end of the period were Information Technology, Financials, and Industrials.
- To benefit from improving business fundamentals during the month, the two most recent additions to the portfolio were a preclinical and clinical laboratory services company and a casino entertainment and hospitality company.
- The three most recent exits were a biotechnology company, a U.S. homebuilder, and a healthcare products and medical devices company.
Navigator® High Dividend Equity
- The portfolio is positioned with approximately 98% in developed countries with the remainder in cash. The United States is the largest country weight at 91.3%, followed by the United Kingdom at 3.5%, and Switzerland at 1.5%.
- Over 94% of the portfolio is large cap, mid cap represents 3%, and the remainder is in cash.
- Financials represent the largest sector weight of 23.2%, approximately in line with the benchmark weight. The next three largest portfolio weights are Industrials, Health Care, and Information Technology at 17.3%, 11.9% and 11.0%, respectively.
Navigator® Large Cap Growth
- The portfolio is fully invested with over 93% in large cap stocks.
- Approximately 98% of total holdings are in developed countries with approximately 91% based in the United States.
- Over 70% of portfolio holdings are derived from the 100 largest cash flow producing companies with high and growing cash flows, high cash flow margins, and increasing sales.
- The three largest portfolio sectors at the end of the period were Information Technology, Communication Services, and Industrials.
- The most recent exit from the portfolio was a renewable energy and utility company.
Navigator® International Equity ADR
- The portfolio is positioned with ~17% in emerging markets with the balance in developed economies and cash.
- Britain, Canada, China, Japan, Spain, and Switzerland are the strategy’s largest country weights, all ranging between 6% and 17%.
- The three largest portfolio sectors at the end of the period were Financials, Information Technology, and Industrials.
- To benefit from improving business fundamentals during the month, the two most recent additions to the portfolio were a French electric utility and energy services company and a global consulting and professional services firm.
- The three most recent exits were a Swiss pharmaceutical and diagnostics company, a French multinational advertising and PR firm, and a Danish pharmaceutical company.
Navigator® Taxable Fixed Income
- Within the portfolio, the focus remained on keeping the duration slightly longer than the index.
- We continue to reinvest maturities and coupon payments in the five-year and longer portion of the curve.
- We also executed swaps to increase the overall yield and duration in the portfolio. In one example, we sold a global professional services firm’s 2.8%, 30-year bonds at a 4.50% yield, and bought 5.45%, 34-year bonds at a 5.12% yield.
- This thesis of maximizing yield while also positioning to maximize total return will continue to be the near-term focus.
Navigator® Tax-Free Fixed Income
- We maintain an overweight versus the index in pollution control revenue (PCR) bonds and an underweight in healthcare, as we see greater opportunity in the PCR and power sectors, as AI, crypto, and data centers continue to be announced and their power needs surge.
- We see emerging value in AA versus AAA and BBB, as both prior seem to be overbought as the ETF complex cannibalizes investing in that credit space. We will look for continued investment opportunities there.
- We also are cautiously extending duration as the curve’s steepness is offering value propositions not seen in years, but we are keeping extension risk at a minimum.
Clark Capital’s Top-Down, Quantitative Strategies
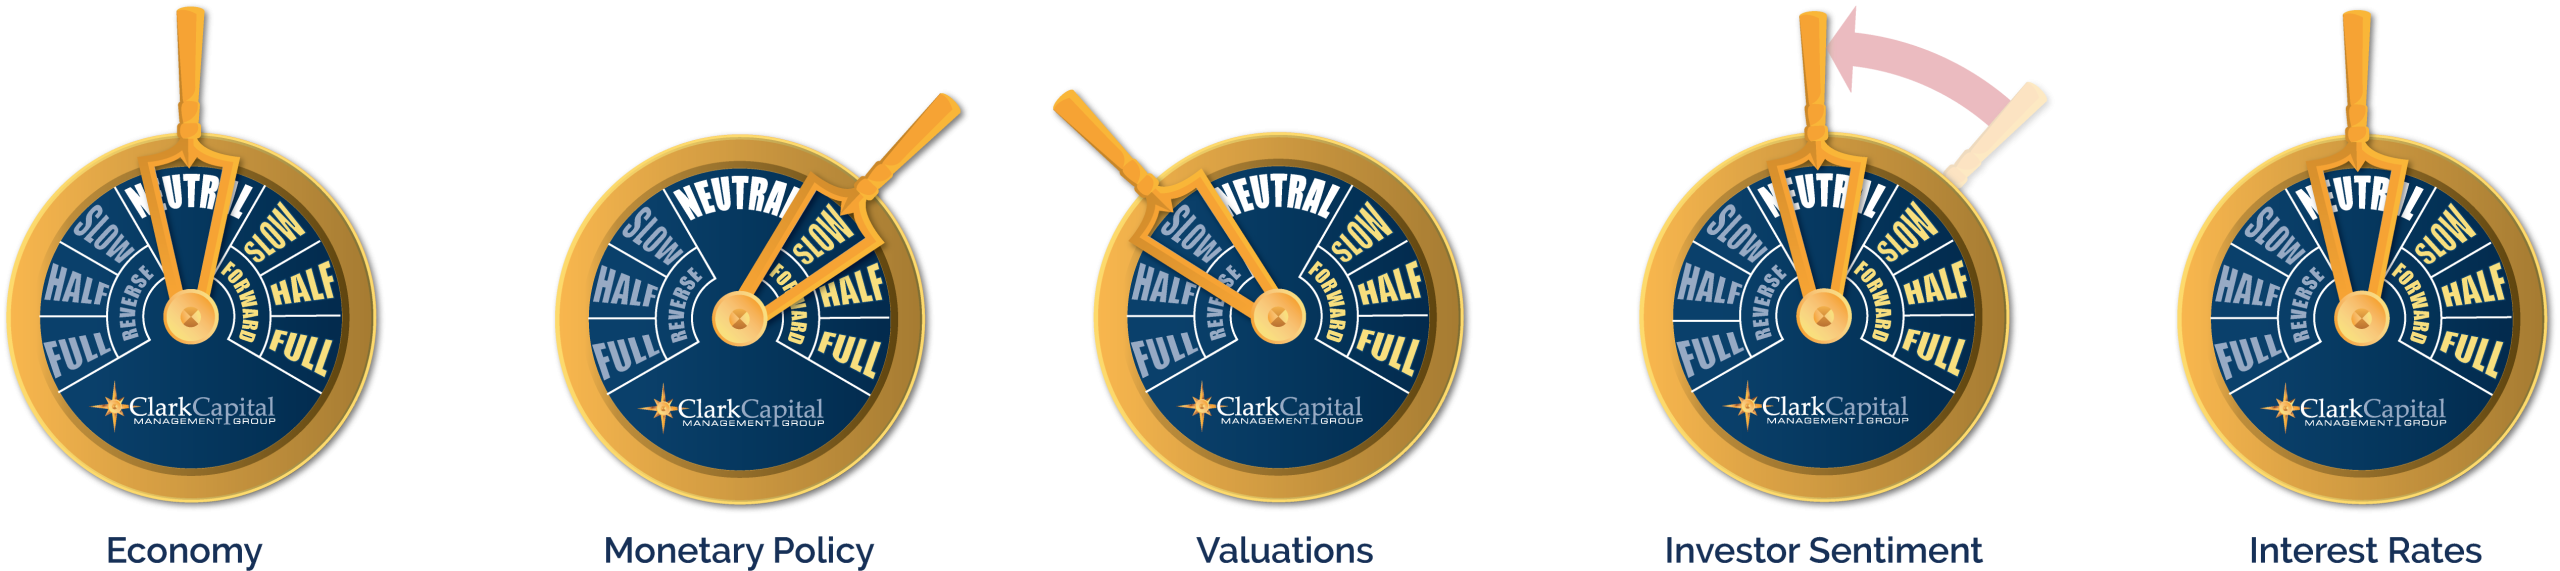
For the third consecutive month, both the S&P 500 and the Bloomberg Corporate High Yield indices posted gains. The S&P 500 advanced by 2.24% and the High Yield Index gained 0.45%, as both hit new all-time highs during the month. The persistent trends higher for risk assets have valuations reaching lofty levels and investor sentiment turning more positive but not at levels that we would consider frothy yet. For example, the American Association of Individual Investors (AAII) shows 40.3% of investors surveyed are bullish while 33% are bearish. Not the extreme levels associated with prior tops.
Large-cap stocks, and in particular large-cap growth and the momentum factor, lead the performance ranks. The Style Opportunity portfolio is squarely invested in those trends, with the majority of the portfolio invested in large-cap growth, momentum, and the S&P 500 Index. Credit continues to perform well, and our tactical models are fully invested in risk-on asset classes. Strategies such as Fixed Income Total Return, Tactical Investment Grade, Global Tactical, Global Risk Managed, and U.S. Tactical Allocation are positioned risk-on.
Below are strategy updates from July:
Navigator® Alternative
- Multi-Strategy performed best among the mutual fund core in July, while long/short commodities were the top detractor.
- As the rally has deepened and expanded, we have reduced equity slightly and increased cash-like vehicles.
- We continue to favor precious metals and miners and remain positive on cryptocurrency and blockchain platforms.
Navigator® Fixed Income Total Return (MultiStrategy Fixed Income)
- Credit markets continue to be calm and rock solid.
- Spreads maintain levels near historic lows. With interest rates choppy but range bound, we see very few signs of weakness.
- We expect to continue to favor credit over the intermediate term.
Navigator® Global Risk Management
- Credit markets remain calm and stable. As a result, our position in U.S. and international equities should continue over the intermediate term.
- We continue to slightly favor the U.S. over international stocks, which proved favorable in July with a resurgent dollar.
Navigator® Global Tactical
- Our credit-based models remain positive, and thus our risk-on position in equities should continue going forward.
- Recent strength in the U.S. dollar and among mega-cap U.S. stocks has helped U.S. stocks to make up a good deal of their deficit to international equities so far in 2025.
Navigator® U.S. Sector Opportunity
- The number of sectors or market segments that are outperforming the S&P 500 continues to narrow.
- Only Aerospace and Defense, broker-dealers, broad Tech, and the NASDAQ 100 have strong relative performance trends.
- Defensive and value sectors cannot maintain any persistent outperformance, and they are to be avoided, despite alluring valuations.
Navigator® U.S. Style Opportunity (MultiStrategy Equity)
- The portfolio continues to favor large-cap growth and an S&P 500 momentum ETF, while also maintaining a large indexed position.
- No style boxes or factors outside of large-cap growth have been able to exceed the S&P 500.
- Value stocks, mid-cap stocks, small-cap stocks, and quality stocks all are at or near new relative lows.
Navigator® U.S. Strategic Beta
- The portfolio continues to modestly favor growth over value.
- We continue to be roughly benchmark weight in mid-cap and small-cap stocks, and we maintain positions in quantitative or active mid-cap or small-cap ETFs.
- Our next portfolio move would likely be to neutralize our growth overweight.
The views expressed are those of the author(s) and do not necessarily reflect the views of Clark Capital Management Group. The opinions referenced are as of the date of publication and are subject to change due to changes in the market or economic conditions and may not necessarily come to pass. There is no guarantee of the future performance of any Clark Capital investments portfolio. Material presented has been derived from sources considered to be reliable, but the accuracy and completeness cannot be guaranteed. Nothing herein should be construed as a solicitation, recommendation or an offer to buy, sell or hold any securities, other investments or to adopt any investment strategy or strategies. For educational use only. This information is not intended to serve as investment advice. This material is not intended to be relied upon as a forecast or research. The investment or strategy discussed may not be suitable for all investors. Investors must make their own decisions based on their specific investment objectives and financial circumstances. Past performance does not guarantee future results.
Clark Capital Management Group (Clark) is an investment adviser registered with the U.S. Securities and Exchange Commission. Registration does not imply a certain level of skill or training. More information about Clark’s investment advisory services can be found in its Form ADV Part 2 and/or Form CRS, which is available upon request.
Fixed income securities are subject to certain risks including, but not limited to: interest rate (changes in interest rates may cause a decline in market value of an investment), credit, payment, call (some bonds allow the issuer to call a bond for redemption before it matures), and extension (principal repayments may not occur as quickly as anticipated, causing the expected maturity of a security
to increase).
Foreign securities are more volatile, harder to price and less liquid than U.S. securities. They are subject to different accounting and regulatory standards and political and economic risks. These risks are enhanced in emerging market countries.
The “Economic Gauges” represent the firm’s expectations for the market, and how changes in the market will affect the strategy, but are only projections which assume certain economic conditions and industry developments and are subject to change without notice. For educational use only.
The S&P 500 measures the performance of the 500 leading companies in leading industries of the U.S. economy, capturing 75% of U.S. equities.
A 10-year Treasury note is a debt obligation issued by the U.S. Treasury Department that has a maturity of 10 years.
Treasury yield is the return on investment, expressed as a percentage, on the U.S. government’s debt obligations. Looked at another way, the Treasury yield is the effective interest rate that the U.S. government pays to borrow money for different lengths of time.
AAA bonds are bonds that have the highest credit rating possible, indicating that they are considered a safe investment with the lowest risk of default.
The chartered financial analyst (CFA) charter is a globally-recognized professional designation offered by the CFA Institute, an organization that measures and certifies the competence and integrity of financial analysts.
Non-investment-grade debt securities (high-yield/junk bonds) may be subject to greater market fluctuations, risk of default or loss of income.
The Russell 1000 Growth Index tracks companies with higher price-to-book ratios, higher sales per share growth, and higher I/B/E/S forecast growth.
The Russell 1000 Value Index tracks companies with lower price-to-book ratios and lower expected and historical growth rates. Russell’s value indexes focus more on dividend yield.
The Russell 3000 Index measures the performance of the 3000 largest U.S. companies based on total market capitalization, which represents approximately 98% of the investable U.S. equity market. The Russell 3000 is generally representative of broad based equities. Index returns reflect the reinvestment of income and other earnings, are provided to represent the investment environment shown, and are not covered by the report of independent verifiers.
The Russell 2000 Index measures the performance of the 2000 smallest U.S. companies based on total market capitalization in the Russell 3000, which represents approximately 10% of Russell 3000 total market capitalization.
The Bloomberg U.S. Corporate High-Yield Index covers the U.S. dollar-denominated, non-investment grade, fixed-rate, taxable corporate bond market. Securities are classified as high-yield if the middle rating of Moody’s, Fitch, and S&P is Ba1/BB+/BB+ or below. The S&P 500 and the Barclays U.S. Aggregate Bond Index are used as supplemental benchmarks.
The Bloomberg US Treasury Index measures US dollar-denominated, fixed-rate, nominal debt issued by the US Treasury. Treasury bills are excluded by the maturity constraint but are part of a separate Short Treasury Index. STRIPS are excluded from the index because their inclusion would result in double-counting. The US Treasury Index is a component of the US Aggregate, US Universal, Global Aggregate and Global Treasury Indices.
The MSCI All Country World ex USA Total Return (MSCI ACWI) is a market capitalization weighted index designed to provide a broad measure of equity-market performance throughout the world. The MSCI ACWI is maintained by Morgan Stanley Capital International and is comprised of stocks from both developed and emerging markets.
ICE BofA US Corporate C Index, a subset of the ICE BofA US High Yield Master II Index, tracks the performance of US dollar denominated below investment grade rated corporate debt publicly issued in the US domestic market. This subset includes all securities with a given investment grade rating CCC or below.

