
Clark Capital’s Bottom-Up, Fundamental Strategies
June capped a powerful two-month market recovery fueled by tariff clarification and better-than-expected first quarter corporate earnings. Despite the market rebound to new highs, valuations are slightly lower than they were at the February highs as we head into the third quarter. While the Federal Reserve left the fed funds rate on pause in June, a few members of the committee began to speak about possibly cutting rates sooner than the market had expected, possibly as early as July (not our expectation). This possibility drove the fed funds futures to reflect a 100% likelihood of a rate cut by September. Currently, the market is pricing in just over two rate cuts by the end of 2025. This, coupled with continued strong employment numbers and muted inflation, moved interest rates lower across the curve during the month. After starting June at 4.40%, the 10-year Treasury moved lower throughout the month and ended the month at 4.23%. The front end of the curve also moved lower, with the two-year Treasury closing at 3.72%, 18 basis points (bps) lower on the month.
Our strategies participated in the market recovery to new highs. Our equity strategies continue to focus on names we consider high quality with business momentum. As the year progresses, we anticipate broadening our participation as the economy remains resilient. On the fixed income side, the focus remained on keeping the duration slightly longer than the index in the taxable bond strategy. Maturities and coupon payments continued to be reinvested in the five-year and longer portion of the curve. The portfolio also saw continued buying in the two-year portion of the curve where lower-rated, higher-yielding names were the focus. This thesis of maximizing yield while also positioning to maximize total return will continue to be the near-term focus.
Below are strategy updates from June:
Navigator® All Cap Core U.S. Equity
- The portfolio is fully invested with over 77% in large-cap stocks and the remainder in mid-cap companies, small-cap companies, and cash.
- We believe the portfolio continues to balance holdings between dominant large-cap growth companies and those anti-fragile large-, small-, and mid-cap companies that continue to see business momentum.
- Our current weighting in the big six free cash flow margin monopolies is 27.3% vs. approximately 26.8% in the Russell 3000. Information Technology remains the largest sector weight in the strategy at 30.0%, albeit underweight to the benchmark.
- The three largest portfolio sectors at the end of the period were Information Technology, Financials, and Industrials.
- To benefit from improving business fundamentals during the month, the most recent addition to the portfolio was a multinational software company known for its creative and multimedia software products.
- The most recent exit was a manufacturer of high-end tools and equipment.
Navigator® High Dividend Equity
- The portfolio holds approximately 99% in developed countries with the remainder in cash. The United States is the largest country weight at 92.0%, followed by the United Kingdom at 3.4%, and Switzerland at 1.9%.
- Over 95% of the portfolio is large cap, over 3% of the portfolio is mid cap, and the remainder is cash.
- Financials represent the largest sector weight of 24.1%, approximately in line with the benchmark weight. The next three largest portfolio weights are Industrials, Health Care, and Information Technology at 16.8%, 12.4% and 10.9%, respectively.
- To benefit from improving business fundamentals during the month, the most recent addition to the portfolio was a U.S.-based energy company, which engages in liquefied natural gas (LNG) related businesses. It owns and operates LNG terminals, develops, constructs, and operates liquefaction projects, and has increased its dividend 76% over three years.
- The most recent exit due to declining business momentum was one of the largest electric U.S. utility holding companies with a focus on renewable energy.
Navigator® Large Cap Growth
- The portfolio is fully invested with over 93% in large-cap stocks.
- Approximately 99% of total holdings are in developed countries with approximately 92% based in the United States.
- Over 70% of portfolio holdings are derived from the 100 largest cash flow producing companies with high and growing cash flows, high cash flow margins, and increasing sales.
- The three largest portfolio sectors at the end of the period were Information Technology, Industrials, and Communication Services.
Navigator® International Equity ADR
- The portfolio is positioned with ~17% in emerging markets with the balance in developed economies and cash. Britain, Canada, China, Japan, Spain, and Switzerland are the strategy’s largest country weights, all ranging between 7% and 17%.
- The three largest portfolio sectors at the end of the period were Financials, Information Technology, and Industrials.
- To benefit from improving business fundamentals during the month, the three most recent additions to the portfolio were a French concessions and construction company, a French tire manufacturer, and a major Canadian bank.
- The three most recent exits were a Canadian multinational pipeline and energy company, a global food and beverage company headquartered in Switzerland, and a German semiconductor manufacturer.
Navigator® Taxable Fixed Income
- Within the portfolio, the focus remained on keeping the duration slightly longer than the index.
- Maturities and coupon payments continued to be reinvested in the five-year and longer portion of the curve.
- As overall yields came down, shorter bonds were swapped into longer 10-year bonds to pick up yield. In one example, we sold shorter pipeline bonds at a yield of 4.94%, and we moved further out the curve to buy 10-year bonds at 5.91%. The pickup of 97 bps in yield more than offset the added interest rate risk that was incurred from the move longer.
- The portfolio also saw continued buying in the two-year portion of the curve where lower rated, higher yielding names were the focus. This thesis of maximizing yield while also positioning to maximize total return will continue to be the near-term focus.
Navigator® Tax-Free Fixed Income
- We advocated exiting the 12- to 15-year wing of a butterfly after the New Year when the slope of the yield curve was approximately 60 bps. Now that it has nearly doubled and sits at a high not seen since 2018, we will judiciously look to add duration at the margins when opportunity presents itself in bond selection.
- We have not deviated in bond selection. We favor state name general obligation bonds versus local names for their better return profile. We eschew small or intermediate health care providers due to still unstable financials.
- We’re adding to power providers as the demands of computing infrastructure grow. We’re adding to prepaid gas bonds as the sector proves remarkably liquid and offers outsized yield.
- We’re staying with corporate credit in muni space as taxable equivalent yields are attractive to taxable corporate counterparts.
Clark Capital’s Top-Down, Quantitative Strategies
The market, and risk assets in general, posted a solid month of gains in June, capping off a first half of the year that was marked by tariff drama, inflation concerns, and geopolitical risks. Nonetheless, the S&P 500 gained 6.20%, the Russell 2000 Index lost 1.79%, large growth gained 6.08%, large value gained 6.00%, and the MSCI ACWI ex-US Index led the way gaining 17.90%. Fixed income markets performed well, too. High yield advanced 4.57%, CCC rated bonds added 3.68%, investment grade corporate bonds added 4.45%, and 7-10 Year Treasuries added 5.35%.
Our tactical models have remained risk-on as the markets recovered from the tariff declines. By the end of June, the S&P 500, the Bloomberg High Yield Index, and ICE CCC High Yield Index all traded at record highs. Among equity style exposure, large-cap growth and the momentum factor are leading, and are well represented in the Style Opportunity portfolio. Elsewhere, our strategies are risk on across the board, such as in Fixed Income Total Return, Tactical Investment Grade, Global Tactical, Global Risk Managed, and U.S. Tactical Allocation.
Below are strategy updates from June:
Navigator® Alternative
- We added a managed futures fund, a style premia fund, and a managed futures ETF to the portfolio’s core, and we traded out of two underperforming managed futures funds.
- As the rally has developed, we have slowly reduced surging equity positions, particularly among technology. Infrastructure and industrial real estate were newer additions.
- We believe gold and silver continue to perform strongly, and we maintain our crypto positions.
Navigator® Fixed Income Total Return (MultiStrategy Fixed Income)
- Credit continues to display strength, as spreads continue to decline along with lower Treasury yields.
- Our models slowly but steadily are making new bullish highs, and our position in high yield should be sustained over the intermediate term.
Navigator® Global Risk Management
- The portfolio moved partially into equities in late April and into a maximum overweight position in early May.
- U.S. large caps continue to lead among our equity positions, but international small cap comes in a close second.
- While Treasury yields have fallen over the past six weeks, cash would still be our preferred defensive vehicle as of now.
Navigator® Global Tactical
- The portfolio has been fully risk-on since early May, and our credit-based models indicate a strong underlying backdrop for risk assets.
- The portfolio now allocates 80% to large cap and 20% to small cap within U.S. equities, and 70% towards the U.S. and 30% to international.
- Our models continue to slowly make new highs, and our risk-facing positions should continue well into the third quarter.
Navigator® U.S. Sector Opportunity
- Technology remains our largest sector holding at 36%, including broad tech, semis, software, and cybersecurity.
- Industrials (aerospace and broad industrials), Financials, and a small position in metals & mining round out our positions.
- We believe defensive and lower beta sectors like Health Care, Staples, Utilities, and Energy are to be avoided, and we hold no positions there.
Navigator® U.S. Style Opportunity (MultiStrategy Equity)
- The portfolio focuses on large-cap growth, with S&P 500 momentum, S&P 500 growth, and momentum factor ETFs as primary holdings, along with some broad indexed positions.
- Market leadership is so focused that only large-cap growth was able to surpass the S&P 500 itself.
- High dividend, minimum volatility, and generally defensive ETFs rank lowest in our relative strength models.
Navigator® U.S. Strategic Beta
- The portfolio continues to modestly favor growth over value, and we maintain a benchmark neutral stance regarding mid- and small-cap stocks.
- Large-cap growth and a cash cow leaders ETF have been leading contributors, while mid-cap value and small-cap value have been laggards.
The views expressed are those of the author(s) and do not necessarily reflect the views of Clark Capital Management Group. The opinions referenced are as of the date of publication and are subject to change due to changes in the market or economic conditions and may not necessarily come to pass. There is no guarantee of the future performance of any Clark Capital investments portfolio. Material presented has been derived from sources considered to be reliable, but the accuracy and completeness cannot be guaranteed. Nothing herein should be construed as a solicitation, recommendation or an offer to buy, sell or hold any securities, other investments or to adopt any investment strategy or strategies. For educational use only. This information is not intended to serve as investment advice. This material is not intended to be relied upon as a forecast or research. The investment or strategy discussed may not be suitable for all investors. Investors must make their own decisions based on their specific investment objectives and financial circumstances. Past performance does not guarantee future results.
Clark Capital Management Group (Clark) is an investment adviser registered with the U.S. Securities and Exchange Commission. Registration does not imply a certain level of skill or training. More information about Clark’s investment advisory services can be found in its Form ADV Part 2 and/or Form CRS, which is available upon request.
Fixed income securities are subject to certain risks including, but not limited to: interest rate (changes in interest rates may cause a decline in market value of an investment), credit, payment, call (some bonds allow the issuer to call a bond for redemption before it matures), and extension (principal repayments may not occur as quickly as anticipated, causing the expected maturity of a security
to increase).
Foreign securities are more volatile, harder to price and less liquid than U.S. securities. They are subject to different accounting and regulatory standards and political and economic risks. These risks are enhanced in emerging market countries.
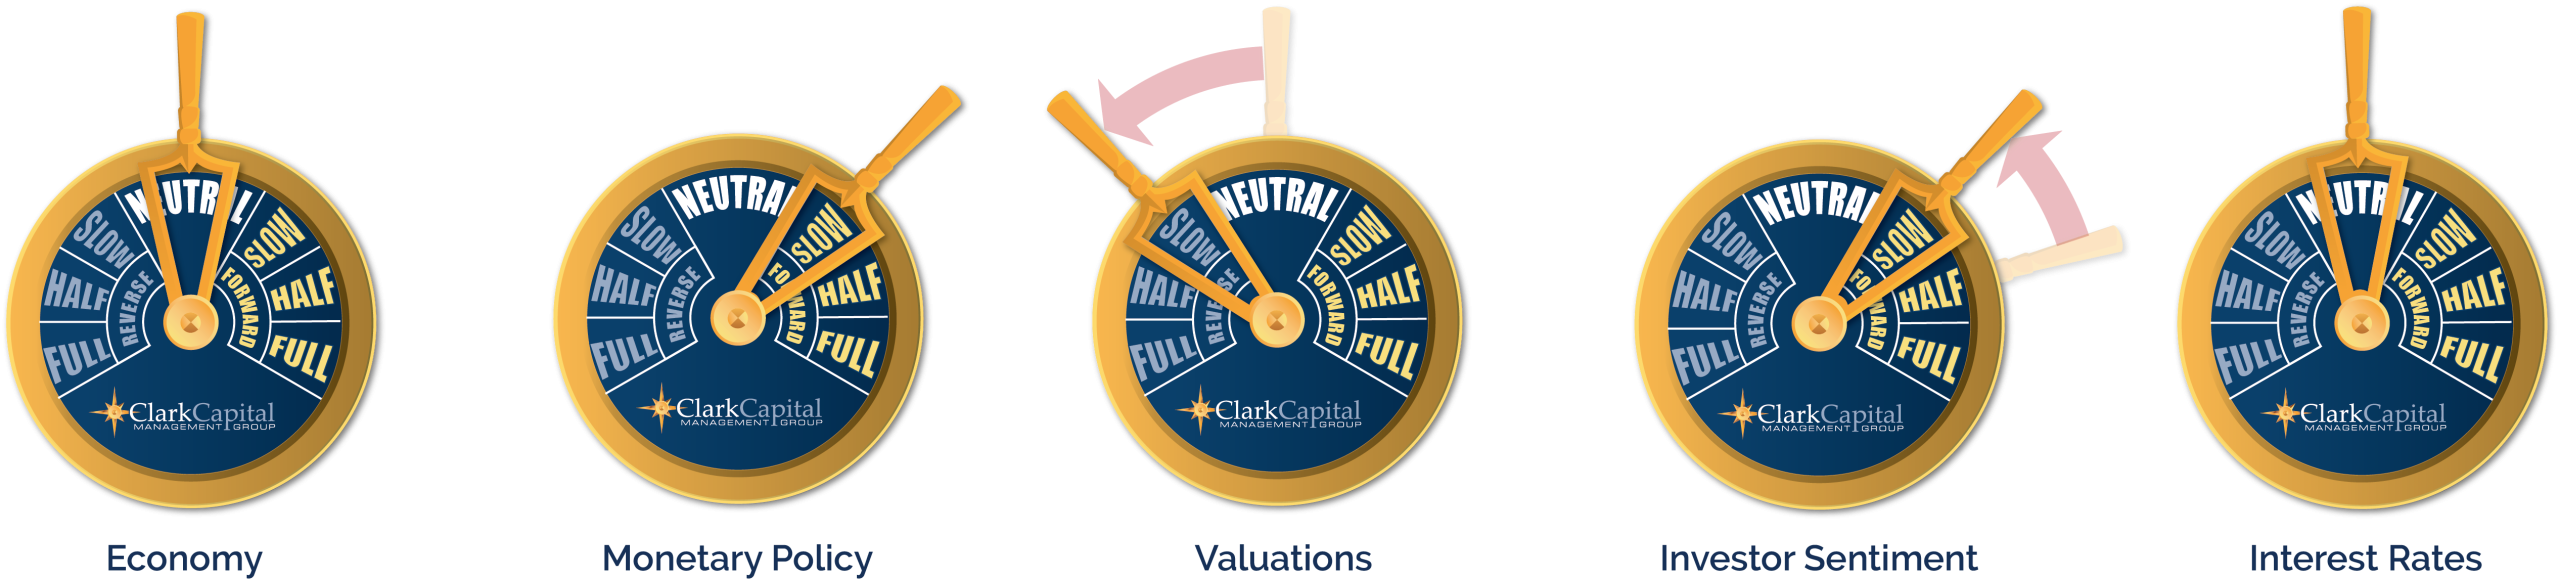
The “Economic Gauges” represent the firm’s expectations for the market, and how changes in the market will affect the strategy, but are only projections which assume certain economic conditions and industry developments and are subject to change without notice. For educational use only.
The S&P 500 measures the performance of the 500 leading companies in leading industries of the U.S. economy, capturing 75% of U.S. equities.
A 10-year Treasury note is a debt obligation issued by the U.S. Treasury Department that has a maturity of 10 years.
Treasury yield is the return on investment, expressed as a percentage, on the U.S. government’s debt obligations. Looked at another way, the Treasury yield is the effective interest rate that the U.S. government pays to borrow money for different lengths of time.
AAA bonds are bonds that have the highest credit rating possible, indicating that they are considered a safe investment with the lowest risk of default.
The chartered financial analyst (CFA) charter is a globally-recognized professional designation offered by the CFA Institute, an organization that measures and certifies the competence and integrity of financial analysts.
Non-investment-grade debt securities (high-yield/junk bonds) may be subject to greater market fluctuations, risk of default or loss of income.
The Russell 3000 Index measures the performance of the 3000 largest U.S. companies based on total market capitalization, which represents approximately 98% of the investable U.S. equity market. The Russell 3000 is generally representative of broad based equities. Index returns reflect the reinvestment of income and other earnings, are provided to represent the investment environment shown, and are not covered by the report of independent verifiers.
The Russell 2000 Index measures the performance of the 2000 smallest U.S. companies based on total market capitalization in the Russell 3000, which represents approximately 10% of Russell 3000 total market capitalization.
The Bloomberg U.S. Corporate High-Yield Index covers the U.S. dollar-denominated, non-investment grade, fixed-rate, taxable corporate bond market. Securities are classified as high-yield if the middle rating of Moody’s, Fitch, and S&P is Ba1/BB+/BB+ or below. The S&P 500 and the Barclays U.S. Aggregate Bond Index are used as supplemental benchmarks.
The Bloomberg US Treasury Index measures US dollar-denominated, fixed-rate, nominal debt issued by the US Treasury. Treasury bills are excluded by the maturity constraint but are part of a separate Short Treasury Index. STRIPS are excluded from the index because their inclusion would result in double-counting. The US Treasury Index is a component of the US Aggregate, US Universal, Global Aggregate and Global Treasury Indices.
The MSCI All Country World ex USA Total Return (MSCI ACWI) is a market capitalization weighted index designed to provide a broad measure of equity-market performance throughout the world. The MSCI ACWI is maintained by Morgan Stanley Capital International and is comprised of stocks from both developed and emerging markets.
ICE BofA US Corporate C Index, a subset of the ICE BofA US High Yield Master II Index, tracks the performance of US dollar denominated below investment grade rated corporate debt publicly issued in the US domestic market. This subset includes all securities with a given investment grade rating CCC or below.

