
Clark Capital’s Bottom-Up, Fundamental Strategies
Optimism surrounding easing tariff tensions prompted a strong market rally. The S&P 500 Index rose 6%, posting its best May since 1990. Strong Big Tech earnings contributed to a rotation from defensives and dividend yielders into momentum and high beta names in the Technology, Communications, and Consumer Discretionary sectors. All sectors posted positive returns except for Health Care, which remains under pressure due to pending federal policy changes.
Uncertainty remains. Sixty days after “Liberation Day,” no formal trade agreements have been finalized with key partners. This situation raises questions about the legality, duration, and scope of tariffs once the temporary suspensions expire. Our equity portfolios remain well positioned given the uncertainty, posting strong gains due to sector positioning and strength in quality companies amidst the earnings season.
On the fixed income front, almost two rate cuts were priced out of the market expectations in May. The Fed is now expected to cut only two more times this year and not until the fourth quarter. Within the taxable bond portfolio, the focus remained on keeping the duration slightly longer than the index. Maturities and coupon payments continued to be reinvested in the five-year and longer portion of the curve. Higher yielding, lower rated bonds were purchased with shorter than five year maturities. As the credit risk in the market continues to be minimal, adding shorter term, lower rated bonds remains a key element to enhance the overall portfolio yield.
Below are strategy updates from May:
Navigator® All Cap Core U.S. Equity
- The portfolio is fully invested with over 76% in large-cap stocks and the remainder in mid-cap companies, small-cap companies, and cash.
- The portfolio continues to balance portfolio holdings between dominant large-cap growth companies and those anti-fragile large-, small- and mid-cap companies that continue to see strong business momentum.
- Our current weighting in the big six free cash flow margin monopolies is 26.5% vs. approximately 26.0% in the Russell 3000. Information Technology remains the largest sector weight in the strategy at 28.2%, albeit underweight to the benchmark.
- The three largest portfolio sectors at the end of the period were Information Technology, Financials, and Industrials.
- To benefit from improving business fundamentals during the month, the three most recent additions to the portfolio were a consumer tobacco products company, an automotive and transportation components company, and a natural gas and utility company.
- The three most recent exits were a consumer goods and specialty retailer, a beer and beverage producer, and a leading producer of basic construction materials.
Navigator® High Dividend Equity
- The portfolio holds approximately 99% in developed countries with the remainder in cash. The United States is the largest country weight at 92.0%, followed by the United Kingdom at 3.3%, and Switzerland at 2.0%.
- Over 95% of the portfolio is large cap, mid cap represents 3% of the portfolio, and the remainder is in cash.
- Financials are the largest sector exposure at 23.4%, approximately in line with the benchmark weight. The next three largest portfolio weights are Industrials, Health Care, and Information Technology at 17.2%, 12.5% and 10.1%, respectively.
- To benefit from improving business fundamentals during the month, the two most recent additions to the portfolio were a home products retailer with a 20% three-year dividend growth rate and a company that provides climate and energy solutions with a 15% three-year dividend growth rate.
- Two recent exits were a biopharma company and a media and telecommunications conglomerate.
Navigator® Large Cap Growth
- The portfolio is fully invested with over 94% in large-cap stocks.
- Approximately 99% of total holdings are in developed countries with ~92% based in the United States.
- Over 70% of portfolio holdings are derived from the 100 largest cash flow producing companies with high and growing cash flows, high cash flow margins, and increasing sales.
- The three largest portfolio sectors at the end of the period were Information Technology, Industrials, and Communication Services.
- To benefit from improving business fundamentals during the month, the three most recent additions to the portfolio were a leading global provider of climate control solutions and two alternative investment managers.
- The three most recent exits were a healthcare conglomerate, a medical devices and technology company, and a health services and insurance company.
Navigator® International Equity ADR
- The portfolio is positioned with ~15% in emerging markets with the balance in developed economies and cash. Britain, Canada, China, Japan, Spain, and Switzerland are the strategy’s largest country weights, all ranging between 7% and 15%.
- The three largest portfolio sectors at the end of the period were Financials, Information Technology, and Industrials.
- To benefit from improving business fundamentals during the month, the three most recent additions to the portfolio were a Chinese internet technology and gaming company, an electrical connection and protection company, and a global bank headquartered in Spain.
- The three most recent exits were a Chinese e-commerce company, a medical devices and technology company, and a top beverage bottling and distribution company.
Navigator® Taxable Fixed Income
- Within the portfolio, the focus remained on keeping the duration slightly longer than the index.
- Maturities and coupon payments continued to be reinvested in the five-year and longer portion of the curve. Shorter than five-year bonds that were purchased were higher yielding lower rated bonds.
- As credit risk in the market continues to be minimal, adding shorter lower rated bonds remains a key element to enhance the overall yield. An airline bond was one such example as these four-year bonds were added at a yield just under 5.6%.
- While further out the curve, higher quality names were added. Shorter bonds from one of the world’s leading providers of technology and telecommunications services were sold and swapped into longer bonds. These trades saw an increase of approximately 45 basis points in yield (5.29% vs 4.85%).
- This thesis of maximizing yield while also positioning to maximize total return will continue to be the
near-term focus.
Navigator® Tax-Free Fixed Income
- With reflation of the yield curve eliminating the exaggerated lows of the trailing two years, we feel more comfortable judiciously extending duration to take advantage of higher yields, albeit a fractional amount currently.
- We continue to avoid health care bonds, especially those that are lower in credit as it seems some of the larger changes in federal budgets appear set to take place in federally sponsored programs.
- Instead, we continue to seek yield in pari-corporate bonds where disclosure and credit dynamics are more readily apparent, and our involvement in the sector results in steady support from our trading counterparties.
- Yields are still attractive both on a gross and relative basis in high grade bonds as well, and we have been participating in that sector in the new issue market.
- While we are happy with our portfolio structure (credit A+ vs AA index and duration slightly longer), we continue to trade to rebalance as current exposures roll down and as relative value opportunities accrue.
Clark Capital’s Top-Down, Quantitative Strategies
We believe May was a much better month for the equity markets as the tariff rhetoric calmed down at least for now, and Congress continues to negotiate on a budget and tax legislation. Time will tell whether we are in the eye of the storm and volatility will pick up again. Risk assets posted solid gains across the board in May. It was the best month for the S&P 500 since November and the best May in 35 years. The S&P 500 gained 6.29%, and the Russell 2000 Small Cap Index gained 5.34%. Large-cap growth outpaced large-cap value, gaining 8.85% and 3.51%, respectively. High yield bonds closed the month at a new all-time high with the Bloomberg High Yield Index up 1.68%. Meanwhile, Treasuries declined with the Bloomberg 7-10 Year Treasury Index down 1.18% during the month.
Our tactical models that drive Fixed Income Total Return, Global Tactical, and Global Risk Management are fully risk-on as credit sits at a new high, spreads have contracted, and investor sentiment remains quite pessimistic even after the 19% rally from the April lows in the S&P 500. Large-cap growth and the momentum factor are leading the equity market rally, while value and mid caps and small caps lag.
Below are strategy updates from May:
Navigator® Alternative
- Event driven and long-short equity are leading the mutual fund core, while managed futures continue to struggle amid a lack of trends.
- The portfolio favors gold and silver and the associated miners, but we recently reduced these positions after their spike and overbought technicals. We will look to increase these positions as they correct.
- The portfolio also favors energy and commodity producers, semiconductors, cloud computing, and private equity-like business development corporations.
Navigator® Fixed Income Total Return (MultiStrategy Fixed Income)
- Since the April 7 bottom, high yield is up 5.0%, while U.S. Treasuries are down 0.8%.
- High yield spreads have come in considerably since early April, falling from 4.5% to 3.1% today.
- Our models are slowly making new highs and solidly favor high yield and risky credit over Treasuries or cash.
Navigator® Global Risk Management
- Our models moved back into equities in mid-April and were fully invested at the beginning of May.
- Our fundamentally driven credit models have recovered after the tariff-driven spike down, and these models recently made new bullish highs.
- The portfolio takes an 80% position in U.S. large-caps and 20% in U.S. small-caps , and has a mix of 70% U.S. and 30% international equity.
- The tactical fixed income portion of the portfolio has favored high yield since late April, fully investing in early May. We have favored investment grade corporates since the end of April.
Navigator® Global Tactical
- Our models moved back into equities in mid-April and were fully invested at the beginning of May.
- Our fundamentally driven credit models have recovered after the tariff-driven spike down, and these models recently made new bullish highs.
- The portfolio takes an 80% position in U.S. large-caps and 20% in U.S. small-caps and has a mix of
70% U.S. and 30% international equity.
Navigator® U.S. Sector Opportunity
- Our sector alignment is risk-facing and leans towards beta and cyclicality.
- We hold only three sectors: Technology (software, cybersecurity, and broad tech), Industrials
(broad sector and aerospace), and Financials (broad sector and broker dealers), along with an
S&P 500 indexed position. - Health Care, Energy, and Materials continue to struggle and land at the bottom of our ETF rankings.
Navigator® U.S. Style Opportunity (MultiStrategy Equity)
- Momentum and large-cap growth dominate the top of our rankings.
- The portfolio features a large indexed position along with S&P 500 Momentum and momentum factor ETFs. These ETFs are price leaders and are the only ETFs in our universe making new price highs.
- Value stocks, mid caps, and small caps remain at the bottom half of our universe.
Navigator® U.S. Strategic Beta
- During the April tariff-driven turbulence, the portfolio took the opportunity to closely align its mix of large caps, mid caps, and small caps closely with the benchmark, so very little active bias remains.
- We also added two active small-cap equity ETFs to the mix.
- The portfolio continues to have a modest growth bias over value, particularly among large-cap stocks.
The views expressed are those of the author(s) and do not necessarily reflect the views of Clark Capital Management Group. The opinions referenced are as of the date of publication and are subject to change due to changes in the market or economic conditions and may not necessarily come to pass. There is no guarantee of the future performance of any Clark Capital investments portfolio. Material presented has been derived from sources considered to be reliable, but the accuracy and completeness cannot be guaranteed. Nothing herein should be construed as a solicitation, recommendation or an offer to buy, sell or hold any securities, other investments or to adopt any investment strategy or strategies. For educational use only. This information is not intended to serve as investment advice. This material is not intended to be relied upon as a forecast or research. The investment or strategy discussed may not be suitable for all investors. Investors must make their own decisions based on their specific investment objectives and financial circumstances. Past performance does not guarantee future results.
Fixed income securities are subject to certain risks including, but not limited to: interest rate (changes in interest rates may cause a decline in market value of an investment), credit, payment, call (some bonds allow the issuer to call a bond for redemption before it matures), and extension (principal repayments may not occur as quickly as anticipated, causing the expected maturity of a security to increase).
Foreign securities are more volatile, harder to price and less liquid than U.S. securities. They are subject to different accounting and regulatory standards and political and economic risks. These risks are enhanced in emerging market countries.
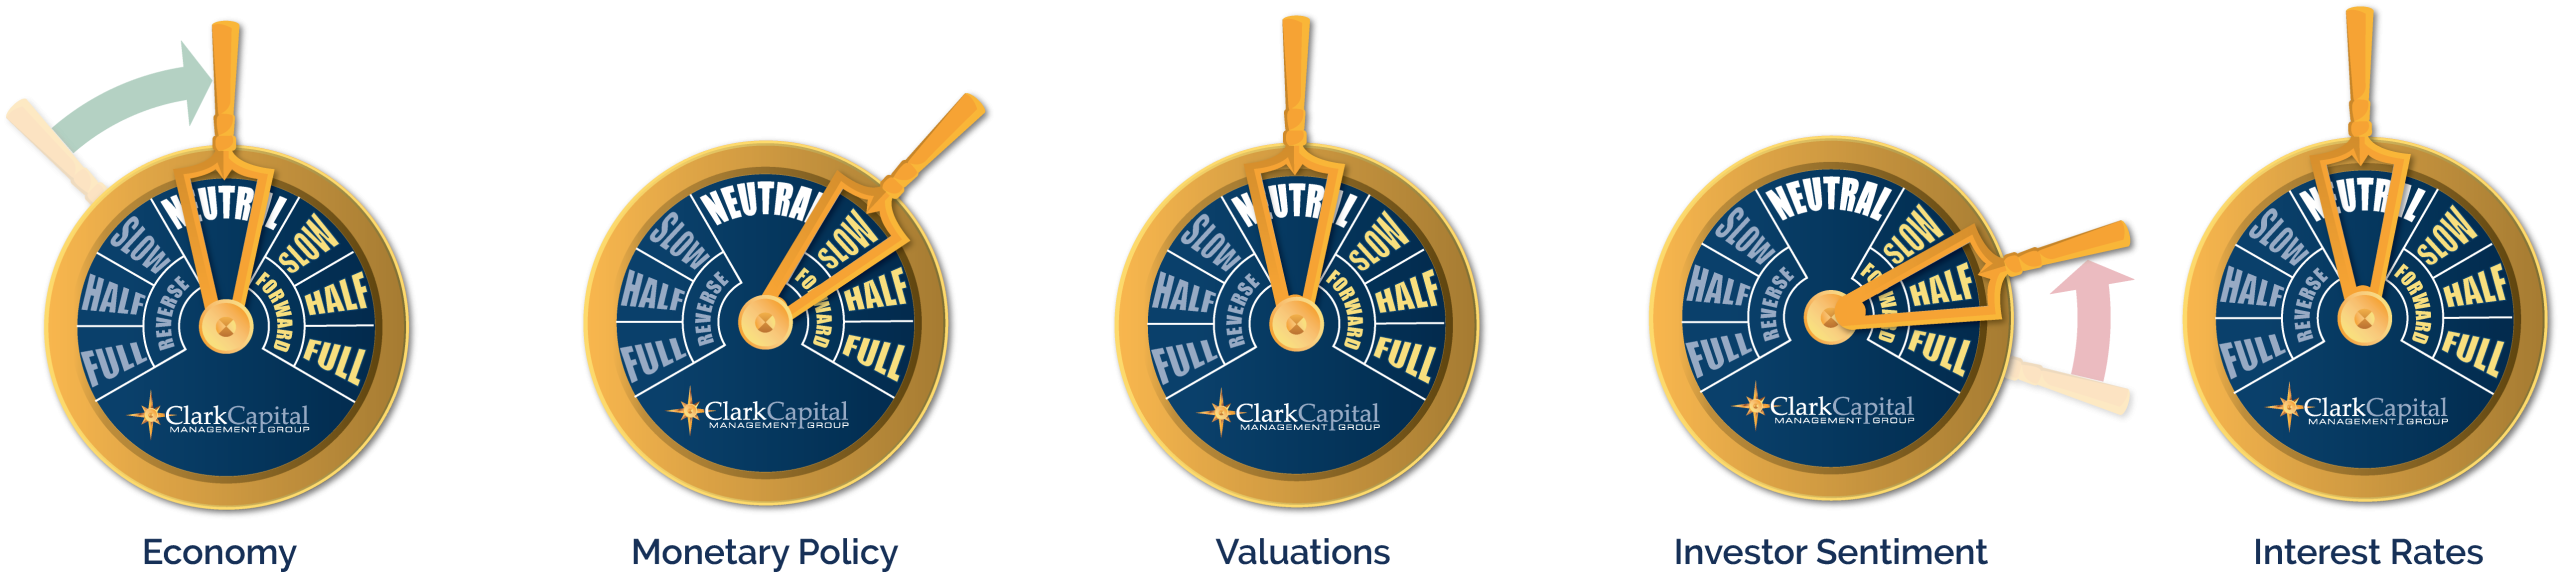
The “Economic Gauges” represent the firm’s expectations for the market, and how changes in the market will affect the strategy, but are only projections which assume certain economic conditions and industry developments and are subject to change without notice. For educational use only.
The S&P 500 measures the performance of the 500 leading companies in leading industries of the U.S. economy, capturing 75% of U.S. equities.
A 10-year Treasury note is a debt obligation issued by the U.S. Treasury Department that has a maturity of 10 years.
The Russell 3000 Index measures the performance of the 3000 largest U.S. companies based on total market capitalization, which represents approximately 98% of the investable U.S. equity market. The Russell 3000 is generally representative of broad based equi[1]ties. Index returns reflect the reinvestment of income and other earnings, are provided to represent the investment environment shown, and are not covered by the report of independent verifiers.
The Bloomberg US Treasury Index measures US dollar-denominated, fixed-rate, nominal debt issued by the US Treasury. Treasury bills are excluded by the maturity constraint but are part of a separate Short Treasury Index. STRIPS are excluded from the index because their inclusion would result in double-counting. The US Treasury Index is a component of the US Aggregate, US Universal, Global Aggregate and Global Treasury Indices.
The CBOE Volatility Index (VIX) is a real-time index that represents the market’s expectations for the relative strength of near-term price changes of the S&P 500 Index (SPX).
The Russell 2000 Index is a small-cap U.S. stock market index that makes up the smallest 2,000 stocks in the Russell Index.
The Bloomberg 5-Year Municipal Bond Index provides a broad-based performance measure of the U.S. municipal bond market, consisting of securities with 4-6 year maturities.
The Bloomberg U.S. Corporate High-Yield Index covers the U.S. dollar-denominated, non-investment grade, fixed-rate, taxable corporate bond market. Securities are classified as high-yield if the middle rating of Moody’s, Fitch, and S&P is Ba1/BB+/BB+ or below.
Treasury yield is the return on investment, expressed as a percentage, on the U.S. government’s debt obligations. Looked at another way, the Treasury yield is the effective interest rate that the U.S. government pays to borrow money for different lengths of time.
AAA bonds are bonds that have the highest credit rating possible, indicating that they are considered a safe investment with the lowest risk of default.
The chartered financial analyst (CFA) charter is a globally-recognized professional designation offered by the CFA Institute, an organization that measures and certifies the competence and integrity of financial analysts.
Non-investment-grade debt securities (high-yield/junk bonds) may be subject to greater market fluctuations, risk of default or loss of income and principal than higher-rated securities.
The securities of mid-cap companies may be subject to more abrupt or erratic market movements and may have lower trading volumes.
This document may contain certain information that constitutes forward-looking statements which can be identified by the use of forward-looking terminology such as “may,” “expect,” “will,” “hope,” “forecast,” “intend,” “target,” “believe,” and/or comparable terminology (or the negative thereof). Forward looking statements cannot be guaranteed. No assurance, representation, or warranty is made by any person that any of Clark Capital’s assumptions, expectations, objectives, and/or goals will be achieved. Nothing contained in this document may be relied upon as a guarantee, promise, assurance, or representation as to the future.
Clark Capital Management Group, Inc. is an investment adviser registered with the U.S. Securities and Exchange Commission. Registration does not imply a certain level of skill or training. More information about Clark Capital’s advisory services and fees can be found in its Form ADV, and/or Form C&S which are available upon request.

