
Clark Capital’s Bottom-Up, Fundamental Strategies
The S&P 500 Index earnings picture remains strong, driven by Technology, Industrials, Utilities, and Financials. The earnings momentum and heavy capital expenditures made by companies have mostly been linked to the AI buildout. Valuations are in record territory with an S&P 500 Index forward P/E of 23X, increasing odds of a normal correction over the next six months.
The bond market was driven by the uncertainty of the government shutdown and the expected Federal Reserve rate cut towards the end of the month. With the government shut down for the entire month, economic data was delayed and not released throughout October. The Federal Reserve reduced overnight lending rates, but Chair Powell messaged a hawkish tone at the press conference when he said it’s “far from a foregone conclusion that the Fed will cut rates in December.” From our vantage point, it appears clear the Fed is more concerned about the weakening labor market conditions than it is about inflation remining above its 2% target. The 10-year Treasury note briefly fell below 4.0% and remains in a “lower-high-lower-low” pattern, the definition of a downtrend.
The equity portfolios remain focused on owning what we consider to be high-quality, undervalued companies with strong fundamentals and strong business momentum. Broader participation remains key for the sustainability of the market rally, but leadership from high-quality growth remains firmly entrenched. On the fixed income side, the focus in the Taxable Bond portfolio remained consistent with previous months: to keep duration slightly longer than the index and move maturing bonds into the five-year and longer portion of the yield curve.
Below are strategy updates from October:
Navigator® All Cap Core U.S. Equity
- The portfolio is fully invested with over 74% in large-cap stocks and the remainder in mid-/small-cap companies and cash.
- The portfolio continues to balance portfolio holdings between dominant, large-cap growth companies and those anti-fragile large-, small-, and mid-cap companies, which continue to see strong business momentum.
- The three largest portfolio sectors at the end of the period were Information Technology, Financials, and Industrials.
- Our current weighting in the big six free cash flow margin monopolies is 28.8% vs. approximately 29.4% in the Russell 3000. Albeit underweight to the benchmark, Information Technology remains the largest sector weight in the strategy at 29.9%.
- To benefit from improving business fundamentals during the month, the three most recent additions to the portfolio were one of the world’s largest gold mining companies, a midstream energy company, and a financial services and technology firm.
- The three most recent exits were a specialty grocery retailer, a diversified gaming and hospitality company, and an independent exploration and energy production company.
Navigator® High Dividend Equity
- The portfolio is positioned with approximately 96% in developed countries with the remainder in cash. The United States is the largest country weight at 88.8%, followed by the United Kingdom at 3.9%, and Ireland at 2.0%.
- Over 94% of the portfolio is in large cap with the remainder in mid cap and cash.
- Financials represent the largest sector weight at 20.9%, which is below the benchmark weight. The next three largest portfolio weights are Industrials, Health Care, and Information Technology at 15.3%, 11.5%, and 11.1%, respectively.
- To benefit from improving business fundamentals during the month, the two most recent additions to the portfolio were a company that provides trading and investment solutions and an electric utility company.
- The three most recent exits were a financial information and analytics company, an international insurance brokerage and risk management firm, and an international membership-based warehouse retailer.
Navigator® Large Cap Growth
- The portfolio is fully invested with over 94% in large-cap stocks.
- Approximately 99% of total holdings are in developed countries with approximately 93% based in the United States.
- Over 70% of the portfolio’s holdings are derived from the 100 largest cash-flow-producing companies with high and growing cash flows, high cash-flow margins, and increasing sales.
- The three largest portfolio sectors at the end of the period were Information Technology, Communication Services, and Consumer Discretionary.
- Our current weighting in the big six free cash flow margin monopolies is 53.9% vs. approximately 49.9% in the Russell 1000 Growth. Albeit underweight to the benchmark, Information Technology remains the largest sector weight in the strategy at 49.2%.
- To benefit from improving business fundamentals during the month, the three most recent additions to the portfolio were a provider of construction, industrial maintenance, and energy infrastructure services, an off-price retailer of apparel and home goods, and a medical device company.
- The most recent exit was an online grocery delivery and pickup platform.
Navigator® International Equity ADR
- The portfolio is positioned with ~18% in emerging markets with the balance in developed economies and cash.
- Britain, Canada, China, Ireland, Japan, and Spain are the strategy’s largest country weights, all ranging between 6% and 14%.
- The three largest portfolio sectors at the end of the period were Financials, Information Technology, and Industrials.
- To benefit from improving business fundamentals during the month, the three most recent additions to the portfolio were a British multinational bank, a Dutch company that designs and manufactures advanced photolithography equipment essential to semiconductor production, and a Japanese multinational conglomerate engaged in electronics, gaming, entertainment, and financial services.
Navigator® Taxable Fixed Income
- Within the portfolio, the focus remained consistent with previous months: keep duration slightly longer than the index and move maturing bonds into the five-year and longer portion of the yield curve. Bonds for a notable drug store company were one such example of a swap we did to move the portfolio longer and increase yield.
- Similar trades were done with a financial services company’s bonds.
- The portfolio will continue to execute trade like these where the overall price is reduced while increasing the overall yield. This thesis of maximizing yield while also positioning to maximize total return will continue to be the near-term focus.
Navigator® Tax-Free Fixed Income
- Technicals conspired to cheapen relative value, as slower purchasing moved the needle higher on the muni/Treasury ratio. This cheapening was welcomed here at Clark Capital, as our view has been the three- to six-year spots are overbought, a condition really exacerbated when the ratio hit a one-year low of 57% on September 22.
- The five-year ratio moved from 62% to 65% throughout the month, with perhaps a bias to move higher until a level of outright value emerges. Conversely, ratios in 10- and 30-years declined, as the wave of buying by investors late to the benefit of extension we have been highlighting this year moved rates lower on a relative basis.
- Interestingly, the muni curve is inverted again; curve flattening and possible inversion is something we have discussed here for nearly three months, but the street has remained somewhat quiet about. The 2s5s curve has averaged nine basis points (bps) for the trailing 12 months but moved definitively negative in October. It went from four bps on September 30 to close the month at -9. The change is even more dramatic if we consider the 2s10s curve, which hit a 2025 high on 8/22 of 100 bps and now comes in at 25 bps.
- To capture what was once a steeper 2s5s and 5s10s curve, the herd behavior of the funds/ETF/SMA community has taken much of that positioning advantage out of play. The curve has “warped” so much that we are now focused on counter-trading the herd mentality and finding great value propositions in the one- and two-year portion of the curve due to inversion, as well as shifting our interest in the longer maturities of our barbell investments to 13- to 15-year maturities priced to an nine- to 10-year call, where duration measure between 6-8 years, taxable equivalent yields are 5% or higher, and slower buying equates to a 68%-74% muni/Treasury ratio.
Clark Capital’s Top-Down, Quantitative Strategies
The market continued to grind higher during October, and the S&P 500 posted its sixth consecutive monthly gain. The major indices hit new record highs during the month, with the S&P 500 up 2.3%, the Russell 1000 Growth Index up 3.6%, the Russell 1000 Value Index up 0.4%, the small-cap Russell 2000 Index up 1.8%, and the MSCI All Country World Index Ex USA up 2.0%. Fixed income markets also posted gains, led by a 0.7% gain in Treasuries and a 0.4% gain in investment grade corporate bonds.
The month was not without drama. Increased trade tensions with China have settled down after last week’s meeting with Presidents Trump and Xi. The federal government shutdown continues with each side blaming the other. The Fed cut rates again last week and messaged that another rate cut in December is not a foregone conclusion.
Meanwhile, corporate earnings have posted solid gains. Earnings are beating estimates at an 85% rate. Strong earnings growth has kept this market aloft despite expensive valuations. Credit spreads have remained tight despite recent concerns of cracks in the private credit markets. Tight spreads and solid credit fundamentals have kept our tactical strategies risk on, including Fixed Income Total Return, Global Tactical, and Global Risk Management. In addition, large-cap growth’s dominance remains a constant theme, with an overweight position there in Style Opportunity.
Below are strategy updates from October:
Navigator® Alternative
- Managed futures and multi-strategy were the top contributors in the mutual fund core, while long/short commodity and event driven were laggards.
- We own a smaller position in precious metals and have mostly switched equities for fixed income and reduced volatility.
Navigator® Fixed Income Total Return (MultiStrategy Fixed Income)
- Our models remain positive on high yield vs. Treasuries and cash.
- October witnessed a quick 30-basis-point widening in yields early in the month, but high yield recovered almost all of that spread by the end of the month.
- The Fed’s continuing easing cycle has provided a strong boost to risky credit.
Navigator® Global Risk Management
- Strong economic growth combined with moderating inflation gave markets a further boost in October.
- Our models should continue to favor risk-on stocks for the foreseeable future.
- Treasuries would be our favored vehicle if we turned defensive, but nothing has occurred to alter the favorable risk backdrop.
Navigator® Global Tactical
- The Fed’s easing cycle and strong corporate earnings reports helped our credit-based models to send strong risk-on signals indicating that we do not see major fundamental roadblocks over the horizon.
- U.S. large-cap stocks continued to lead markets in October, with U.S. and international small-cap stocks lagging.
Navigator® U.S. Sector Opportunity
- October saw market leadership narrow even further. Financials took a major hit amid concerns about bank loan portfolios.
- Technology and semiconductors stand out as market leaders, and now only aerospace & defense and biotechnology are keeping up.
- Staples, Energy, and Consumer Discretionary are persistently weak and are to be avoided.
Navigator® U.S. Style Opportunity (MultiStrategy Equity)
- The portfolio continues to focus on large-cap and mega-cap growth stocks.
- No other factor or style ETF ranks above the S&P 500. Still, while other ETFs are not outperforming, they are producing positive gains in a bull market.
Navigator® U.S. Strategic Beta
- At the end of October, the portfolio slightly reduced large-cap growth and added slightly to large-cap value.
- The overall portfolio is now more neutral towards the broad market, and we stand ready to become defensive upon a further rally but also to add back risk if a shorter-term correction occurs.
Disclosures
The views expressed are those of the author(s) and do not necessarily reflect the views of Clark Capital Management Group. The opinions referenced are as of the date of publication and are subject to change due to changes in the market or economic conditions and may not necessarily come to pass. There is no guarantee of the future performance of any Clark Capital investments portfolio. Material presented has been derived from sources considered to be reliable, but the accuracy and completeness cannot be guaranteed. Nothing herein should be construed as a solicitation, recommendation or an offer to buy, sell or hold any securities, other investments or to adopt any investment strategy or strategies. For educational use only. This information is not intended to serve as investment advice. This material is not intended to be relied upon as a forecast or research. The investment or strategy discussed may not be suitable for all investors. Investors must make their own decisions based on their specific investment objectives and financial circumstances. Past performance does not guarantee future results.
Clark Capital Management Group (Clark) is an investment adviser registered with the U.S. Securities and Exchange Commission. Registration does not imply a certain level of skill or training. More information about Clark’s investment advisory services can be found in its Form ADV Part 2 and/or Form CRS, which are available upon request.
Fixed income securities are subject to certain risks including, but not limited to: interest rate (changes in interest rates may cause a decline in market value of an investment), credit, payment, call (some bonds allow the issuer to call a bond for redemption before it matures), and extension (principal repayments may not occur as quickly as anticipated, causing the expected maturity of a security
to increase).
Foreign securities are more volatile, harder to price and less liquid than U.S. securities. They are subject to different accounting and regulatory standards and political and economic risks. These risks are enhanced in emerging market countries.
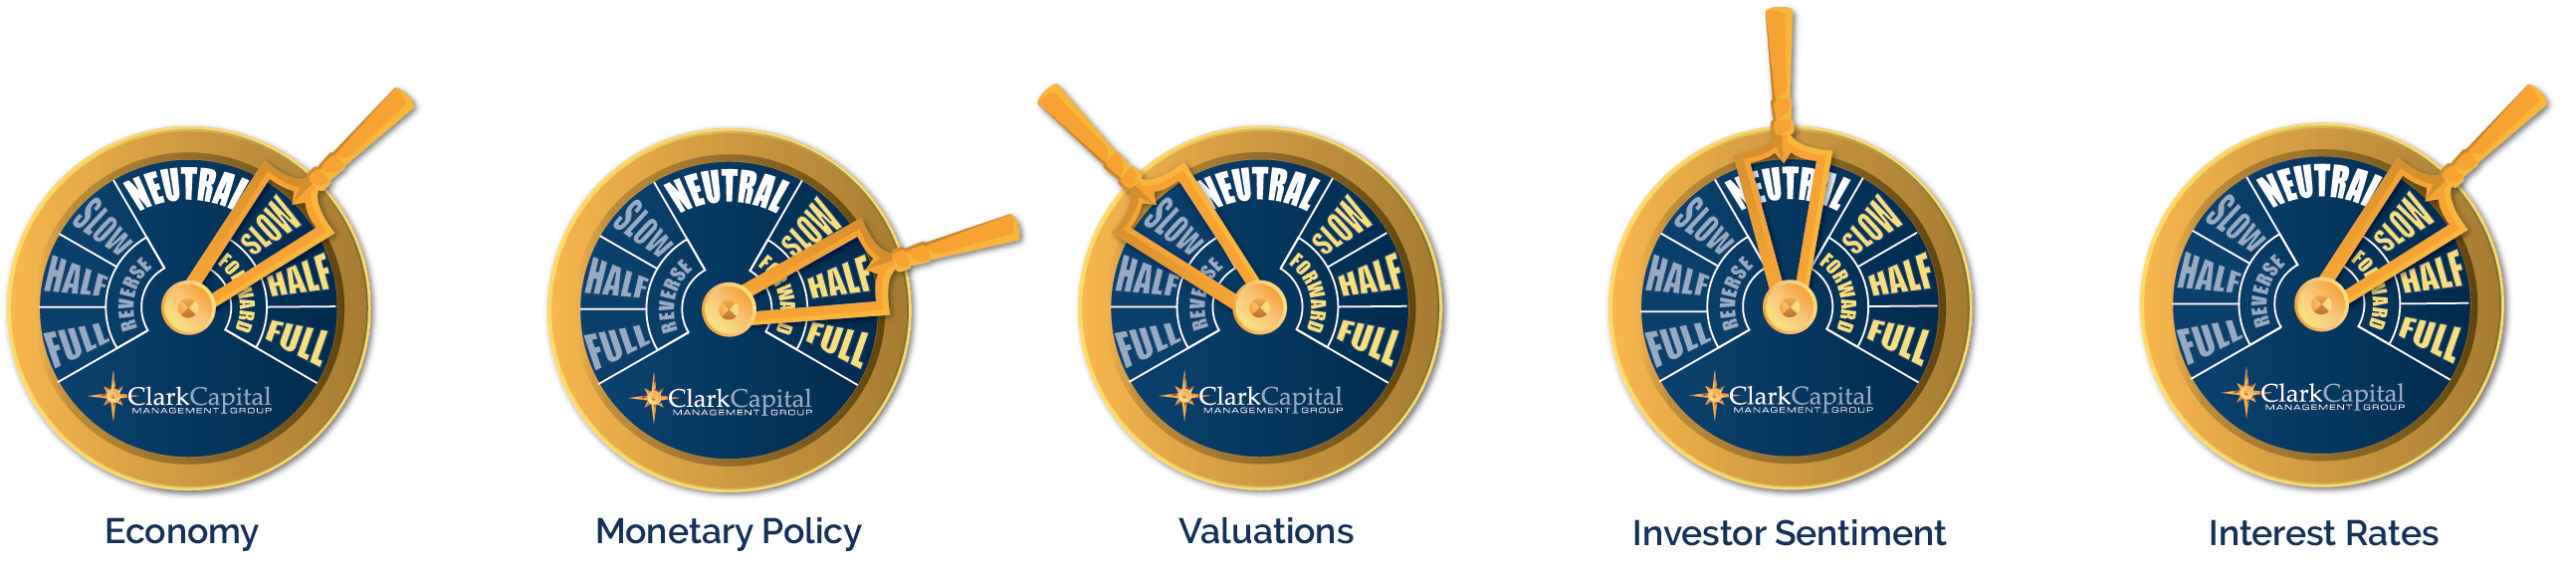
The “Economic Gauges” represent the firm’s expectations for the market, and how changes in the market will affect the strategy, but are only projections which assume certain economic conditions and industry developments and are subject to change without notice. For educational use only.
The S&P 500 measures the performance of the 500 leading companies in leading industries of the U.S. economy, capturing 75% of U.S. equities.
A 10-year Treasury note is a debt obligation issued by the U.S. Treasury Department that has a maturity of 10 years.
Treasury yield is the return on investment, expressed as a percentage, on the U.S. government’s debt obligations. Looked at another way, the Treasury yield is the effective interest rate that the U.S. government pays to borrow money for different lengths of time.
An AA bond rating signifies very high credit quality and a very low risk of default for a bond issued by a government or corporation, indicating a very strong ability to meet financial commitments that is not significantly vulnerable to foreseeable events. While not as exceptional as the highest AAA rating, an AA rating still provides strong reassurance to investors that their investment is secure.
An A rated bond signifies “high credit quality,” indicating a low risk of default, though it is more vulnerable to adverse economic conditions than higher-rated bonds. These ratings are issued by agencies like Fitch, S&P, and Moody’s, reflecting the issuer’s strong capacity to meet financial commitments, but with a greater potential risk than AA or AAA bonds.
A BBB-rated bond is an investment-grade bond that signifies an adequate, though not strong, capacity to meet financial commitments, carrying a low risk of default under normal conditions but a greater susceptibility to adverse economic or business factors compared to higher-rated bonds. In essence, these are considered the lowest tier of “safe” bonds before moving into the more speculative “junk” bond category.
The chartered financial analyst (CFA) charter is a globally-recognized professional designation offered by the CFA Institute, an organization that measures and certifies the competence and integrity of financial analysts.
Non-investment-grade debt securities (high-yield/junk bonds) may be subject to greater market fluctuations, risk of default or loss of income.
The Russell 1000 Value Index tracks companies with lower price-to-book ratios and lower expected and historical growth rates. Russell’s value indexes focus more on dividend yield.
The Russell 2000 Index measures the performance of the 2000 smallest U.S. companies based on total market capitalization in the Russell 3000, which represents approximately 10% of Russell 3000 total market capitalization.
The Bloomberg U.S. Corporate High-Yield Index covers the U.S. dollar-denominated, non-investment grade, fixed-rate, taxable corporate bond market. Securities are classified as high-yield if the middle rating of Moody’s, Fitch, and S&P is Ba1/BB+/BB+ or below. The S&P 500 and the Barclays U.S. Aggregate Bond Index are used as supplemental benchmarks.
The Bloomberg US Treasury Index measures US dollar-denominated, fixed-rate, nominal debt issued by the US Treasury. Treasury bills are excluded by the maturity constraint but are part of a separate Short Treasury Index. STRIPS are excluded from the index because their inclusion would result in double-counting. The US Treasury Index is a component of the US Aggregate, US Universal, Global Aggregate and Global Treasury Indices.
The MSCI All Country World ex USA Total Return (MSCI ACWI) is a market capitalization weighted index designed to provide a broad measure of equity-market performance throughout the world. The MSCI ACWI is maintained by Morgan Stanley Capital International and is comprised of stocks from both developed and emerging markets.
ICE BofA US Corporate C Index, a subset of the ICE BofA US High Yield Master II Index, tracks the performance of US dollar denominated below investment grade rated corporate debt publicly issued in the US domestic market. This subset includes all securities with a given investment grade rating CCC or below.

