
Anxiety has been building over the last several weeks about what the Trump tariffs would look like. The S&P 500 peaked on February 19 and experienced a 10% correction by March 13 as this uncertainty mounted. The stock market reflected a lot of bad news leading up to “Liberation Day” on April 2, the day Trump would unveil his proposed tariffs. Unfortunately, the tariffs that were announced were far worse than even the most pessimistic investors were expecting. When reality is better than expectations, the market goes up. When reality is worse than expectations, the market goes down. In the case of the tariff announcements, the reality was worse than expectations and stocks sold off violently, bonds rallied, and volatility and fear spiked. Stocks experienced their worst single day since March of 2020 during the COVID crisis.
Here is a look at how some broad measures of the market reacted to the tariff announcement.
| Index | 3-Apr-25 |
| S&P 500 | -4.83% |
| S&P 500 Equal Weight | -4.79% |
| Russell 2000 | -6.59% |
| Russell 1000 Growth | -5.67% |
| Russell 1000 Value | -4.19% |
| MSCI ACWI ex U.S. | -0.64% |
| CBOE Volatility Index | 30.02 |
| Bloomberg U.S. Aggregate Bond | 0.58% |
| Bloomberg U.S. Corporate High Yield Bond | -0.94% |
| Bloomberg Corporate | 0.21% |
| Bloomberg U.S. Municipal Index | 0.60% |
| Bloomberg U.S. Treasury Index | 0.69% |
Let’s dive into the details. President Trump had been warning that the United States would enact reciprocal tariffs on the countries with whom we trade. What was announced appears far worse. A broad, across-the-board tariff of 10% was announced for nearly all imports. Additionally, countries with the largest trade surpluses with the U.S., or otherwise deemed to have been treating the U.S. unfairly, were slapped with far larger tariffs. Below is a table reflecting some of the more punitive tariffs being imposed.
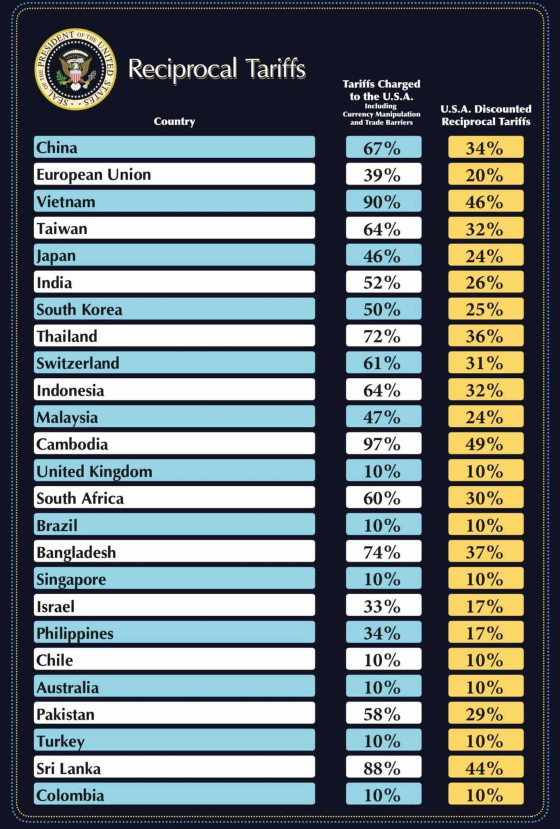
The fear is these tariffs will push the cost of goods up dramatically. Companies will either pass these higher costs along to consumers in the form of higher prices, absorb the higher costs (which would reduce profit margins), or some combination of both. These scenarios would lead to slower profit growth and potentially a recession if demand is impacted enough by higher prices.
So why is our headline “Stay the Course?” Simplistically, the markets reflect known and widely available information. The bad news is out, and stock prices are reflecting that bad news. While higher tariff rates were announced on April 2, they are not going to be implemented until April 9. We believe there is a significant possibility that better tariffs will be negotiated over that time and the market will rally to reflect a better reality than feared. For example, President Trump signaled openness to negotiation and acknowledged the possibility of striking deals if countries “offer something phenomenal.” The mention of flexibility from the administration late yesterday suggests that the tariffs may be tactical rather than a permanent fixture. Time will tell whether the tariffs are a means to an end to force negotiation on trade terms globally.
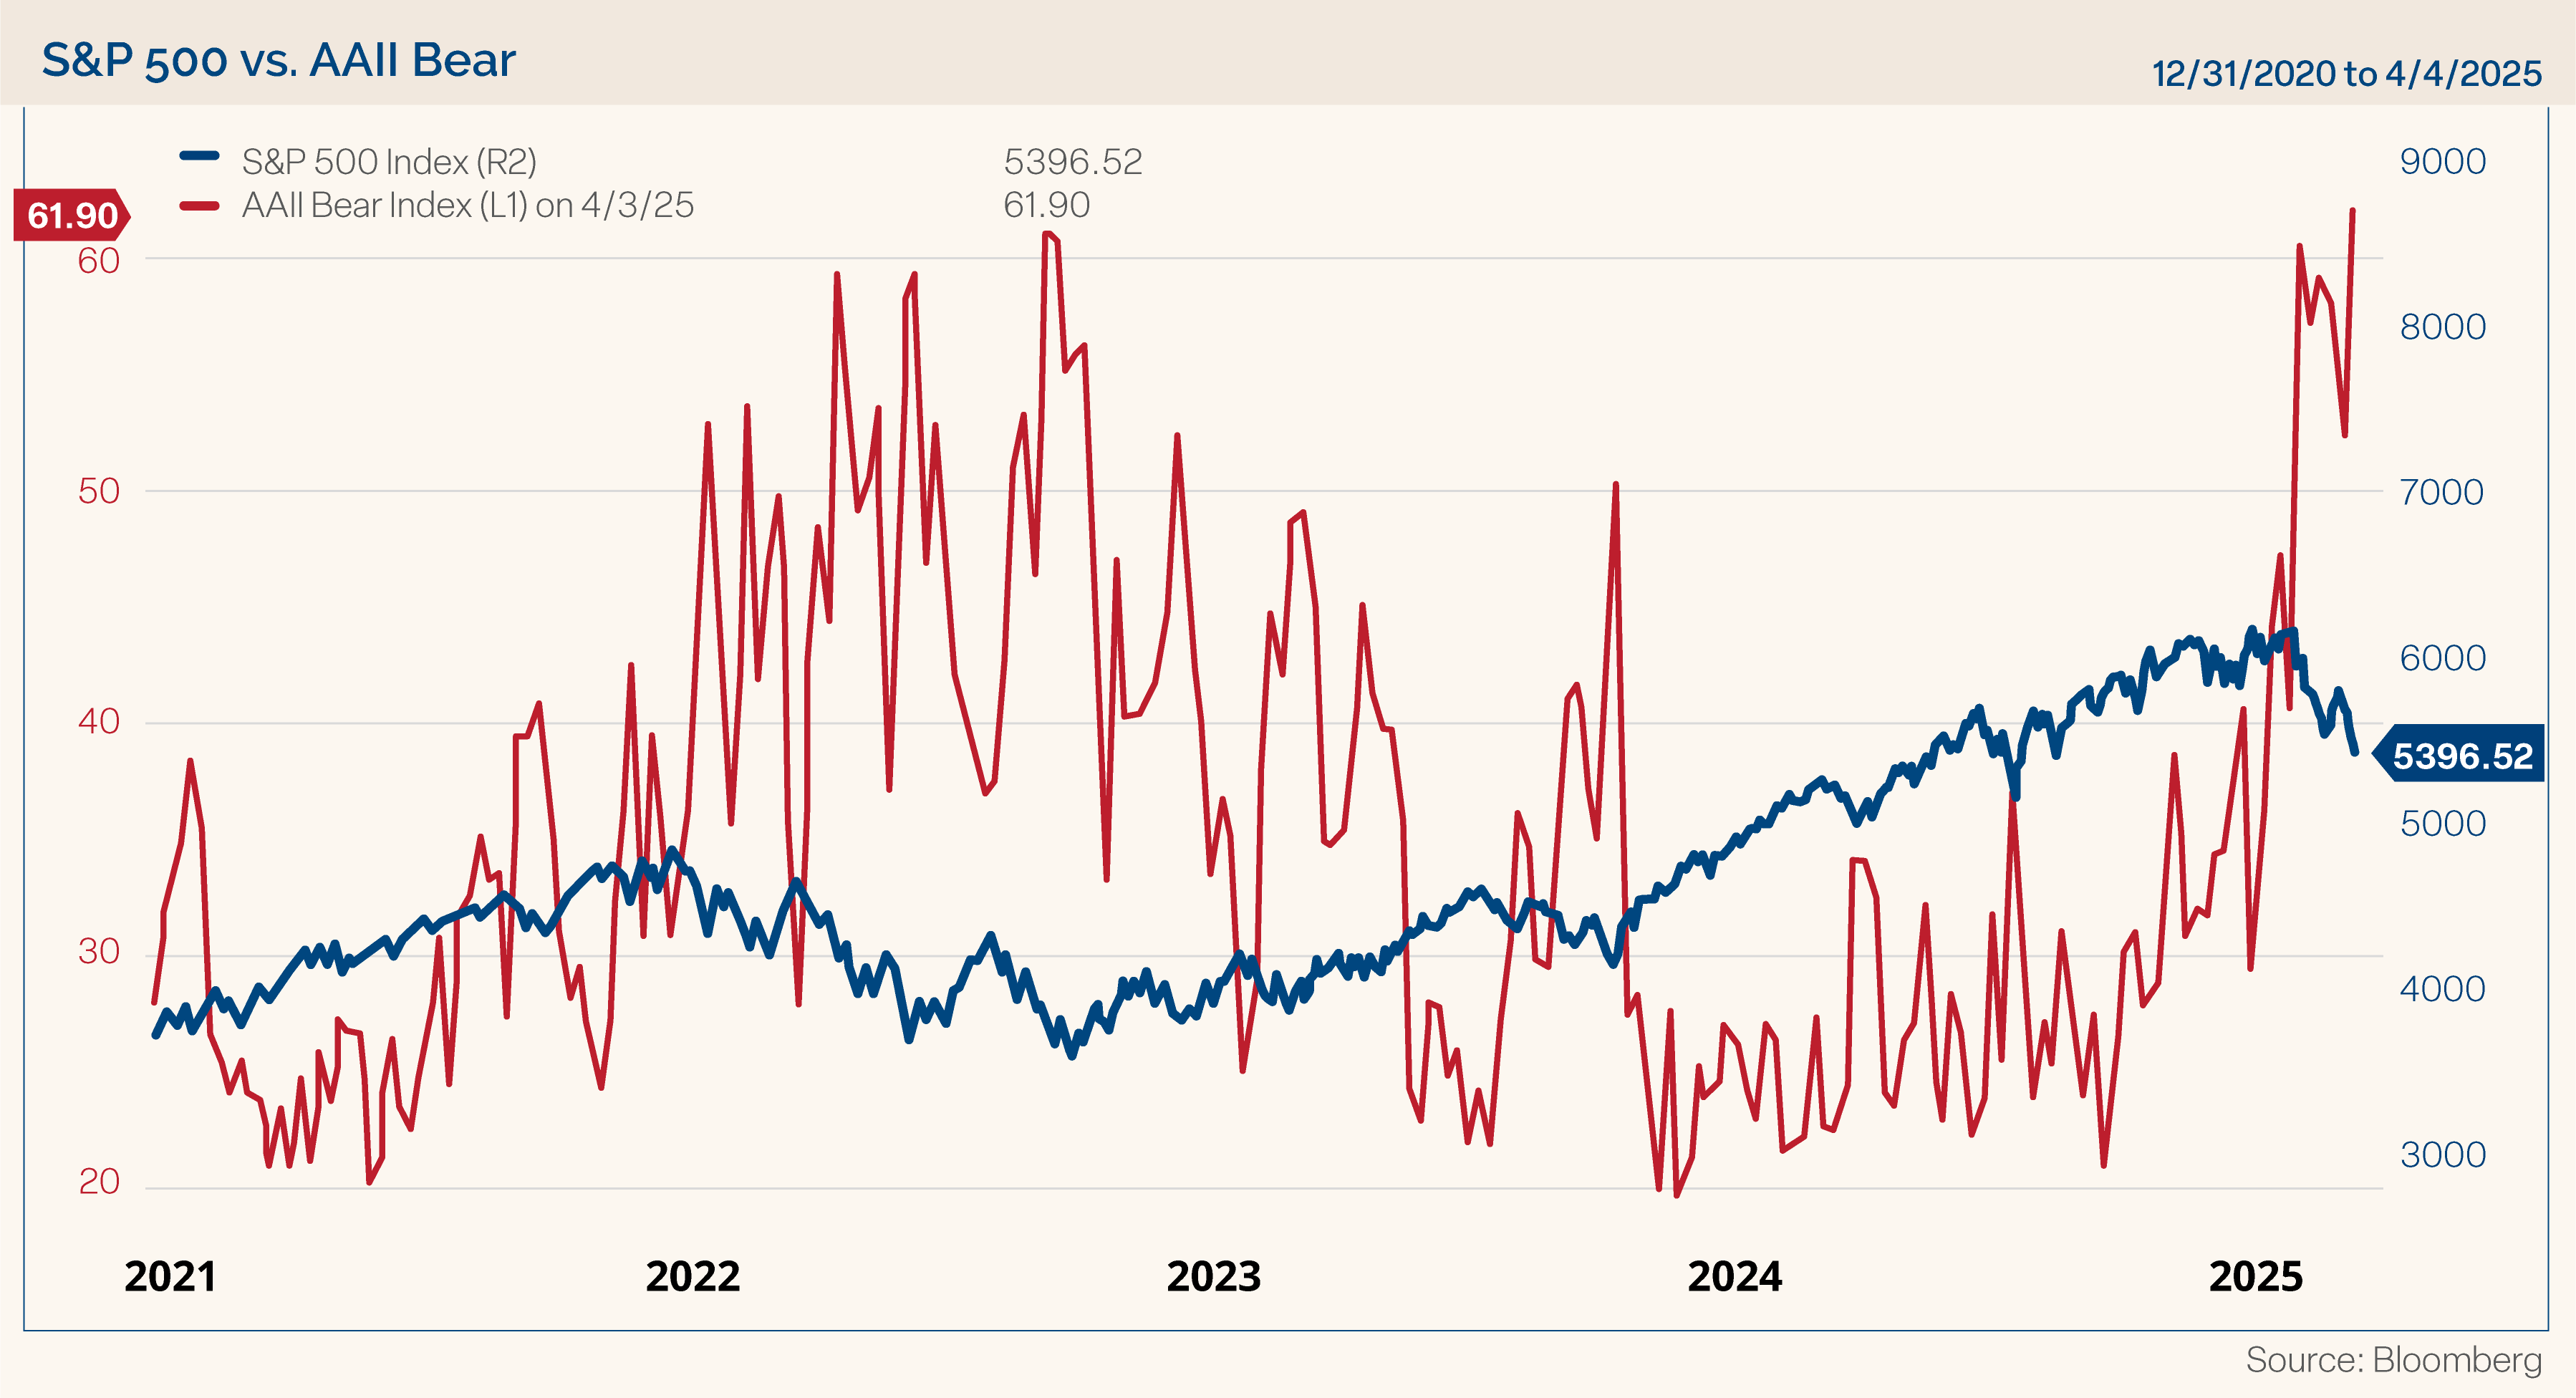
Historically, panic selling has often provided good entry points for investors with a long time horizon. The American Association of Individual Investors (AAII) sentiment poll shows that 61.9% of investors are bearish. That is the third highest level on record. The only higher readings were during the Global Financial Crisis on March 5, 2009, and during the 1990 recession and bear market on October 18, 1990. In both of those prior cases the market bottomed within a week of the extreme bearish sentiment.
There will be winners and losers from these tariffs, and consequently not all companies and their respective stocks will behave the same way. For example, the tariffs currently in place only apply to goods, not services. Additionally, many foreign companies manufacture goods in the U.S. and therefore would not be subject to the tariffs. This is complex and highlights that this is a market of stocks and not just a stock market. This is where active management comes into play — to identify high-quality, anti-fragile companies that will navigate through the current environment. This is what Clark Capital strives to do all day, every day. We believe it is imperative for investors to stay focused on their long-term goals and not let short-term swings in the market derail them from achieving their long-term objectives. Remember the mantra “buy low, sell high.” Unfortunately, too many investors do the opposite – selling because prices went down. That is pure emotion and will likely lead to bad outcomes.
For more information on the tariffs, see our latest Office Hours.
CFA® and Chartered Financial Analyst® are registered trademarks owned by CFA Institute. CAIA® and Chartered Alternative Investment Analyst are registered trademarks owned by the Chartered Alternative Investment Analyst Association. CAIA is a professional designation for investment professionals who specialize in alternative investments. The CAIA Association offers the designation to those who complete a course of study and pass two exams. The CAIA Charter is globally recognized as the standard for analysis, application, and best practices in the alternative investments field.
The opinions referenced are as of the date of publication and are subject to change due to changes in the market or economic conditions and may not necessarily come to pass. There is no guarantee of the future performance of any Clark Capital investments portfolio. Material presented has been derived from sources considered to be reliable and has not been independently verified by us or our personnel. Nothing herein should be construed as a solicitation, recommendation or an offer to buy, sell or hold any securities, other investments or to adopt any investment strategy or strategies. For educational use only. This information is not intended to serve as investment advice. This material is not intended to be relied upon as a forecast or research. The investment or strategy discussed may not be suitable for all investors. Investors must make their own decisions based on their specific investment objectives and financial circumstances. Past performance does not guarantee future results.
Fixed income securities are subject to certain risks including, but not limited to: interest rate (changes in interest rates may cause a decline in market value of an investment), credit, payment, call (some bonds allow the issuer to call a bond for redemption before it matures), and extension (principal repayments may not occur as quickly as anticipated, causing the expected maturity of a security to increase).
Equity securities are subject to price fluctuation and possible loss of principal. Stock markets tend to move in cycles, with periods of rising prices and periods of falling prices. Certain investment strategies tend to increase the total risk of an investment (relative to the broader market). Strategies that concentrate their investments in limited sectors are more vulnerable to adverse market, economic, regulatory, political, or other developments affecting those sectors.
References to market or composite indices, benchmarks or other measures of relative market performance over a specified period of time (each, an “index”) are provided for your information only. Reference to an index does not imply that the portfolio will achieve returns, volatility or other results similar to that index. The composition of the index may not reflect the manner in which a portfolio is constructed in relation to expected or achieved returns, portfolio guidelines, restrictions, sectors, correlations, concentrations, volatility or tracking error targets, all of which are subject to change. Investors cannot invest directly in an index.
The Russell 1000 Growth Index measures the performance of the large-cap growth segment of the U.S. equity universe. It includes those Russell 1000 Index companies with higher price-to-book ratios and higher forecasted growth values.
The Russell 1000 Value Index measures the performance of the large-cap value segment of the U.S. equity universe. It includes those Russell 1000 Index companies with lower price-to-book ratios and lower forecasted growth values.
The Russell 2000 Index measures the performance of the 2000 smallest U.S. companies based on total market capitalization in the Russell 3000, which represents approximately 10% of Russell 3000 total market capitalization.
The Standard and Poor’s 500, or simply the S&P 500, is a stock market index tracking the stock performance of 500 large companies listed on stock exchanges in the United States.
The S&P 500 EWI is maintained in accordance with the index methodology of the S&P 500, which measures 500 leading companies in leading U.S. industries. The S&P 500 EWI measures the performance of the same 500 companies, in equal weights. As such, sector exposures in the S&P 500 EWI will differ.
The MSCI All Country World ex USA Total Return (MSCI ACWI) is a market capitalization weighted index designed to provide a broad measure of equity-market performance throughout the world. The MSCI ACWI is maintained by Morgan Stanley Capital International and is comprised of stocks from both developed and emerging markets.
Bloomberg U.S. Aggregate Bond Index covers the U.S. investment-grade fixed-rate bond market, including government and credit securities, agency mortgage pass-through securities, asset-backed securities and commercial mortgage-based securities. To qualify for inclusion, a bond or security must have at least one year to final maturity, and be rated investment grade Baa3 or better, dollar denominated, non-convertible, fixed rate and publicly issued.
The Bloomberg U.S. Corporate High-Yield Index covers the U.S. dollar-denominated, non-investment grade, fixed-rate, taxable corporate bond market. Securities are classified as high-yield if the middle rating of Moody’s, Fitch, and S&P is Ba1/BB+/BB+ or below.
The Bloomberg US Treasury Index measures US dollar-denominated, fixed-rate, nominal debt issued by the US Treasury. Treasury bills are excluded by the maturity constraint but are part of a separate Short Treasury Index. STRIPS are excluded from the index because their inclusion would result in double-counting. The US Treasury Index is a component of the US Aggregate, US Universal, Global Aggregate and Global Treasury Indices.
The Bloomberg 5-Year Municipal Bond Index is the 5 Year (4-6) component of the Municipal Bond index. It is a rules-based, market-value-weighted index engineered for the tax-exempt bond market. The index tracks general obligation bonds, revenue bonds, insured bonds, and pre-refunded bonds rated Baa3/BBB- or higher by at least two of the ratings agencies.
VIX of VIX (or VVIX) is a measure of the volatility of the Chicago Board Options Exchange (CBOE) Volatility Index (VIX). The CBOE’s VIX measures the short-term volatility of the S&P 500 indexes, and the VVIX measures the volatility of the price of the VIX. In other words, VVIX is a measure of the volatility of the S&P 500 index and alludes to how quickly market sentiment changes.
This document may contain certain information that constitutes forward-looking statements which can be identified by the use of forward-looking terminology such as “may,” “expect,” “will,” “hope,” “forecast,” “intend,” “target,” “believe,” and/ or comparable terminology (or the negative thereof). Forward looking statements cannot be guaranteed.
Clark Capital Management Group, Inc. is an investment adviser registered with the U.S. Securities and Exchange Commission. Registration does not imply a certain level of skill or training. More information about Clark Capital’s advisory services and fees can be found in its Form ADV and/or Form CRS which are available upon request.


