



Clark Capital’s Bottom-Up, Fundamental Strategies
June capped off a strong first half of the year as equities continued to advance despite elevated interest rates and ongoing geopolitical uncertainty. Breadth is improving with more sectors participating in the advance. Markets are rewarding a wider swath of the economy rather than just a narrow cohort of platform winners — a dynamic we think has further to run, for reasons tied directly to how AI capex is being spent and how AI itself is being adopted.
One of the more consequential technical events of the year was the Russell U.S. Index’s reconstitution, which occurred after the close on June 26. This year’s rebalance was unusually significant, and it materially altered the composition of several key benchmarks. The growth/value line blurred further at the top of the market. Apple, Amazon, and Microsoft are all seeing a meaningful portion of their market capitalization reclassified from the Russell 1000 Growth Index into the Russell 1000 Value Index, continuing a shift that began with Amazon, Meta, and Alphabet last year. Mega-cap technology companies are increasingly difficult to characterize as purely “growth” exposures, which materially changes the character — and the AI/momentum sensitivity — of the benchmarks.
Looking ahead, positive earnings revisions remain supportive, though elevated valuations, geopolitical risks, and the historical volatility associated with midterm election years could create more volatility in the markets.
Below are strategy updates from June:
Navigator® All Cap Core U.S. Equity
- The portfolio is fully invested with ~62.2% in large-cap stocks and the remainder in mid-/small-cap companies and cash.
- The portfolio continues to balance portfolio holdings between dominant large-cap growth companies and those anti-fragile large-, small-, and mid-cap companies that continue to see strong business momentum.
- The three largest portfolio sectors at the end of the period were Information Technology, Financials, and Industrials.
- Our current weighting in the Big Six free cash flow margin monopolies is 29.1% vs. approximately 26.1% in the Russell 3000.
- Information Technology remains the largest sector weight in the strategy at 32.9%, a slight underweight to the Russell 3000 benchmark.
- The three most recent additions to the portfolio were a private space launch and aerospace company, a commercial real estate services firm, and a membership warehouse retailer.
- The three most recent exits were a food and beverage company, a retail-focused real estate investment trust, a biotechnology company.
Navigator® High Dividend Equity
- The portfolio is fully invested with ~89.1% of the portfolio in large-cap stocks and the balance in mid-/small-cap companies and cash.
- The United States is the largest country weight at 92.8%, followed by the United Kingdom at 3.3% and Switzerland at 1.4%.
- Approximately 98.3% of total holdings are in developed countries with approximately 92.8% based in the United States.
- The three largest portfolio sectors at the end of the period were Information Technology, Financials, and Industrials.
- For risk management purposes, our strategies may at times purchase companies that do not meet all investment criteria because of their size and/or benchmark weight. Due to the Russell 1000 Value reconstitution, we established a position in an e-commerce and cloud computing company but remain underweight.
- The most recent exit was a data storage products company, as the reconstitution reduced the combined weighting of data storage and semiconductors.
Navigator® Large Cap Growth
- The portfolio is fully invested with ~85.8% of the portfolio in large-cap stocks and the balance in mid-cap stocks and cash.
- Approximately 99% of total holdings are in developed countries with approximately 91.2% based in the United States.
- Over 70% of the portfolio holdings are derived from the 100 largest cash flow producing companies with high and growing cash flows, high cash flow margins, and increasing sales.
- The three largest portfolio sectors at the end of the period were Information Technology, Communication Services, and Industrials.
- Our current weighting in the Big Six free cash flow margin is 39.2% vs. approximately 39.4% in the Russell 1000 Growth.
- Albeit underweight to the benchmark, Information Technology remains the largest sector weight in the strategy at 51.8%.
- The three most recent additions to the portfolio were a semiconductor manufacturing equipment maker, a semiconductor manufacturer, and a flash memory and storage products company.
- The three most recent exits were a cloud-based CRM software company, a government IT and defense contractor, and a mobile app marketing technology company.
Navigator® International Equity ADR
- The portfolio is positioned with ~18.5% in emerging / frontier markets with the balance in developed economies and cash.
- United Kingdom, Japan, Switzerland, and Canada are the strategy’s largest country weights, all ranging between 8% and 16%.
- The three largest portfolio sectors at the end of the period were Information Technology, Financials, and Industrials.
- The three most recent additions to the portfolio were a multinational European semiconductor manufacturer, a Swiss luxury goods conglomerate, and an agribusiness/commodities trading company.
- The most recent exit was an international jewelry company.
Navigator® Small Cap Core U.S. Equity
- The portfolio remains fully invested with ~84.8% of the portfolio in small-cap stocks with the balance in mid-/large-cap stocks and cash.
- The portfolio continues to balance portfolio holdings between anti-fragile small- and mid-cap companies characterized by high cash-flow margin and high-cash flow yields, alongside companies exhibiting accelerating business momentum.
- The three largest portfolio sectors at the end of the period were Industrials, Health Care, and Information Technology.
- The three most recent additions to the portfolio were a solar tracker/energy technology company, an electrical infrastructure construction company, and a network performance and security software company.
- The three most recent exits were a semiconductor connectivity company, a fuel-cell energy technology company, and a photomask manufacturer for semiconductors.
Navigator® SMID Cap Core U.S. Equity
- The portfolio remains fully invested with ~63.5% of the portfolio in small-cap stocks, ~32.0% in mid-cap stocks, and the balance in large-cap stocks and cash.
- The portfolio continues to balance portfolio holdings between anti-fragile small- and mid-cap companies characterized by high cash-flow margin and high-cash flow yields, alongside companies exhibiting accelerating business momentum.
- The three largest portfolio sectors at the end of the period were Industrials, Information Technology, and Financials.
- The two most recent additions to the portfolio were a power electronics/semiconductor equipment maker and a network performance and security software company.
- The three most recent exits were a flash memory and storage products company, a retail-focused real estate investment trust, and a photomask manufacturer for semiconductors.
Navigator® Taxable Fixed Income
- Within the portfolio, the focus remained consistent with previous months, keeping duration longer than the index and moving proceeds from maturing and shorter bonds into the 5-year and longer portion of the yield curve.
- While rates remained relatively stable month over month, the significant intra-month volatility created opportunities to add duration and increase portfolio yield.
- This strategy of maximizing yield and extending duration will continue as long as interest rates remain elevated.
Navigator® Tax-Free Fixed Income
- We continue to be a price maker and not a price taker in periods of weaker demand and were able to structure and secure new issues at above market coupons, enhancing current yield and total return.
- Though the curve continued to grind flatter, we believe we can still get between 80-90% of 30-year yields in the 15- to 20-year part of the curve, so we will cautiously maintain the butterfly trade provided we stay steeper than 10-year averages.
Clark Capital’s Top-Down, Quantitative Strategies
The markets rebounded during the second quarter with the S&P 500 gaining 15.2%, its best quarterly gain in six years. The rally was led by AI and semiconductor themes. The semiconductor index surged 88% during the quarter. Participation across the market broadened the Russell 2000 Small Cap Index gained 21.6%, large growth rose 16.7%, and large value climbed 13.9%. Surging corporate earnings, which have kept valuations in check, have led the gains. June saw some rotation out of the big winners as the market broadened out.
In June, the Federal Reserve held its first FOMC meeting with new Fed Chair Warsh at the helm. As expected, they left rates unchanged but shifted to a more hawkish bias. Warsh’s first press conference left no ambiguity. He called inflation “a choice” and insisted price stability is the FOMC’s number one goal. The market has taken note of the Fed’s more hawkish position and focus on inflation with yields rising on the front end of the curve.
Strong corporate earnings and a stable labor market underpin a strong foundation for U.S. credit fundamentals. There is no stress in public credit markets, and abundant liquidity provides a supportive backdrop. High yield bond spreads are near record lows, ending the quarter at 270 bps. As such, our tactical models that drive Fixed Income Total Return, Global Risk Management, Global Tactical, and others remain risk-on, and portfolios allocated accordingly.
Below are strategy updates from June:
Navigator® Alternative
- While the broad S&P 500 stands just a few percentage points from an all-time high, some market sub-sectors are experiencing major pain.
- During the quarter, the portfolio moved out of positions in private credit, gold, metals and mining stocks, and non-AI technology.
- Infrastructure, retail, biotech, and real estate were new additions during the quarter.
- We currently own no crypto but maintain a position in an agriculture ETN.
Navigator® Fixed Income Total Return (MultiStrategy Fixed Income)
- While equities have undergone dramatic sector rotation recently, credit markets have been yawning through all recent volatility, displaying minimal weakness, and high yield spreads continue to be very tight and near all-time lows.
- As markets look to anticipate one or two Fed rate hikes later this year, we are encouraged that high yield historically enjoys strong relative performance during times of rising rates.
Navigator® Global Risk Management
- Our quantitative models continue to rank equities well ahead of Treasuries and cash.
- Corporate fundamentals are very strong, as evidenced by a near record 28% growth in S&P 500 earnings.
- Any new bond issues are eagerly swept up by investors, and financing and balance sheet stresses appear to be pushed out well into the future.
Navigator® Global Tactical
- Markets have been experiencing a sector and leadership rotation, but the message from credit markets continues to signal all clear.
- Our credit-based models’ strength would label any corrective activity with equities as a buying opportunity.
- In a market and economy strong enough to possibly force rate hikes, we believe equities will continue to be the best risk-on choice.
Navigator® U.S. Sector Opportunity
- Technology gains are no longer broad and uniform. Semiconductors, cybersecurity, and AI-related segments maintain relative strength, but software and legacy core technology are struggling.
- We continue to own broad tech, semiconductors, and cybersecurity, but now market breadth has improved, and other segments like pharma, biotech, banking, and homebuilders have risen in our ranks and became holdings.
- Energy, software, and Telecomm Services rank lowest.
Navigator® U.S. Style Opportunity (MultiStrategy Equity)
- Large-cap growth’s relative strength has slowed and flattened, and, as a result, our position has become neutral regarding growth vs. value.
- We recently added mega-cap value to the portfolio. We also purchased small caps and the momentum factor ETF, which remains atop our rankings even as large growth has faded.
- Mid- and small-cap ETFs could become holdings as the third quarter develops.
- Defensive and lower beta value ETFs continue near the bottom of our ranks.
Navigator® U.S. Strategic Beta
- In early June, the portfolio moved from a modestly pro-cyclical stance to more neutral regarding equity risk and growth vs. value.
- Large growth was reduced to add to large value.
- We continue to believe that our next move will become more defensive in anticipation of a midterm election year correction.
Disclosures
The views expressed are those of the author(s) and do not necessarily reflect the views of Clark Capital Management Group. The opinions referenced are as of the date of publication and are subject to change due to changes in the market or economic conditions and may not necessarily come to pass. There is no guarantee of the future performance of any Clark Capital investments portfolio. Material presented has been derived from sources considered to be reliable, but the accuracy and completeness cannot be guaranteed. Nothing herein should be construed as a solicitation, recommendation or an offer to buy, sell or hold any securities, other investments or to adopt any investment strategy or strategies. For educational use only. This information is not intended to serve as investment advice. This material is not intended to be relied upon as a forecast or research. The investment or strategy discussed may not be suitable for all investors. Investors must make their own decisions based on their specific investment objectives and financial circumstances. Past performance does not guarantee future results. All investing involves risk, including the loss of principal, and there can be no guarantee investment objectives will be met.
Clark Capital Management Group (Clark) is an investment adviser registered with the U.S. Securities and Exchange Commission. Registration does not imply a certain level of skill or training. More information about Clark’s investment advisory services can be found in its Form ADV Part 2 and/or Form CRS, which are available upon request.
Fixed income securities are subject to certain risks including, but not limited to: interest rate (changes in interest rates may cause a decline in market value of an investment), credit, payment, call (some bonds allow the issuer to call a bond for redemption before it matures), and extension (principal repayments may not occur as quickly as anticipated, causing the expected maturity of a security
to increase).
Foreign securities are more volatile, harder to price and less liquid than U.S. securities. They are subject to different accounting and regulatory standards and political and economic risks. These risks are enhanced in emerging market countries.
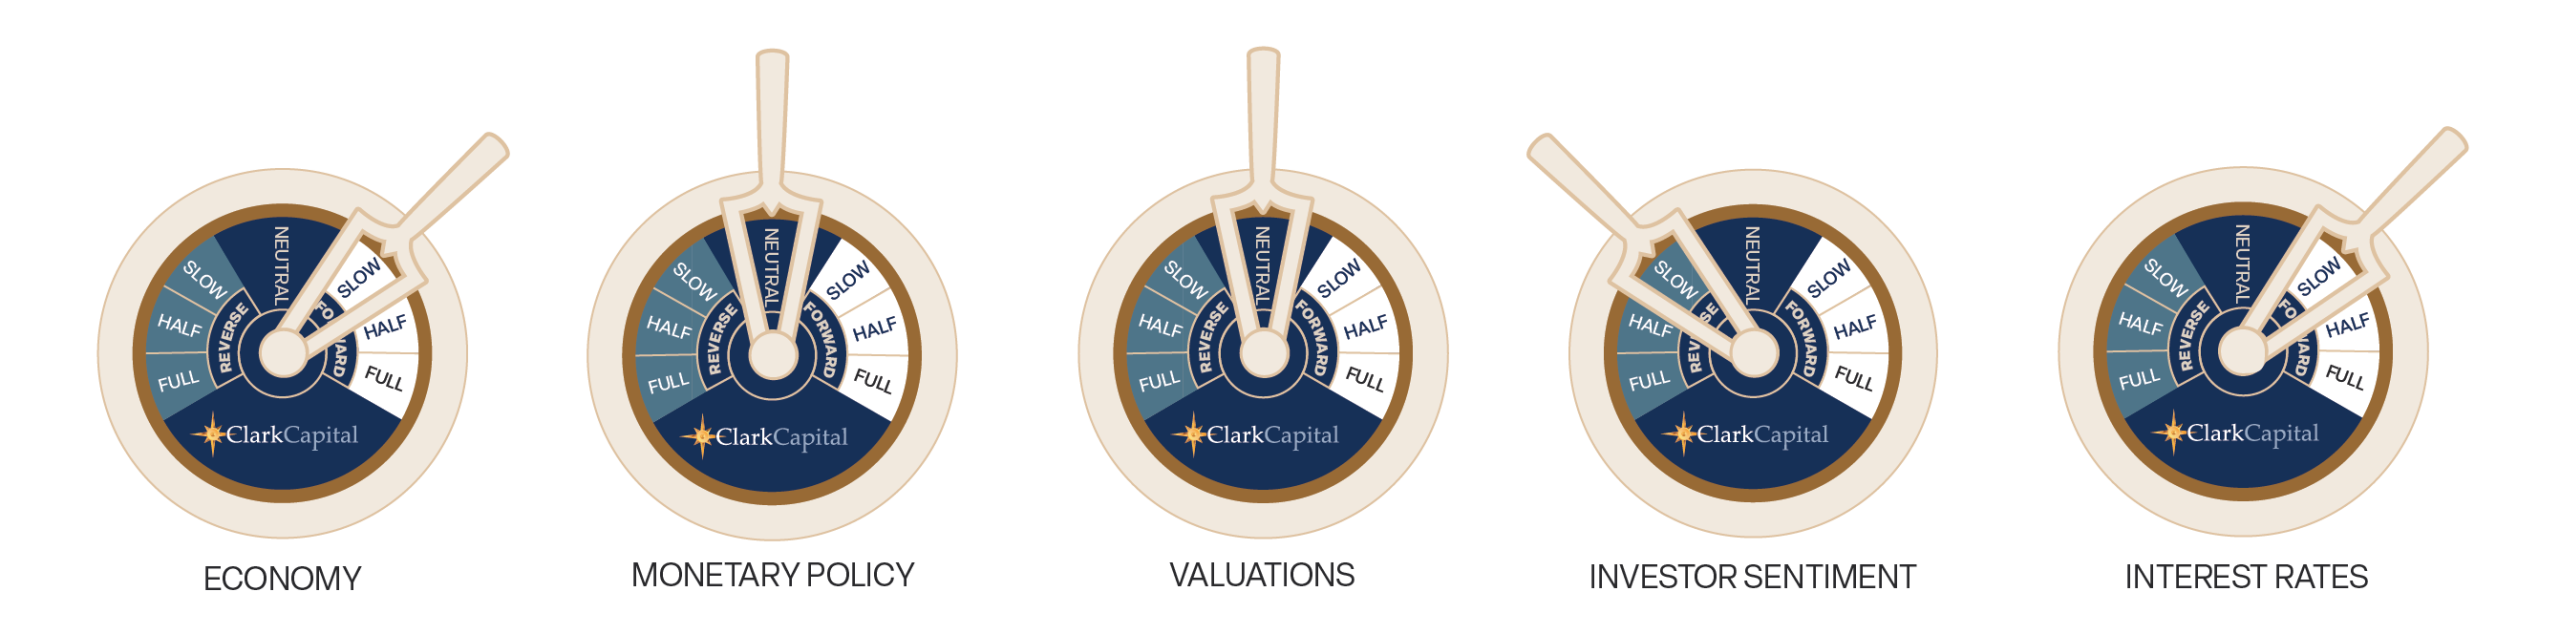
The “Economic Gauges” represent the firm’s expectations for the market, and how changes in the market will affect the strategy, but are only projections which assume certain economic conditions and industry developments and are subject to change without notice. For educational use only.
The S&P 500 measures the performance of the 500 leading companies in leading industries of the U.S. economy, capturing 75% of U.S. equities.
A 10-year Treasury note is a debt obligation issued by the U.S. Treasury Department that has a maturity of 10 years.
Treasury yield is the return on investment, expressed as a percentage, on the U.S. government’s debt obligations. Looked at another way, the Treasury yield is the effective interest rate that the U.S. government pays to borrow money for different lengths of time.
An AA bond rating signifies very high credit quality and a very low risk of default for a bond issued by a government or corporation, indicating a very strong ability to meet financial commitments that is not significantly vulnerable to foreseeable events. While not as exceptional as the highest AAA rating, an AA rating still provides strong reassurance to investors that their investment is secure.
An A rated bond signifies “high credit quality,” indicating a low risk of default, though it is more vulnerable to adverse economic conditions than higher-rated bonds. These ratings are issued by agencies like Fitch, S&P, and Moody’s, reflecting the issuer’s strong capacity to meet financial commitments, but with a greater potential risk than AA or AAA bonds.
A BBB-rated bond is an investment-grade bond that signifies an adequate, though not strong, capacity to meet financial commitments, carrying a low risk of default under normal conditions but a greater susceptibility to adverse economic or business factors compared to higher-rated bonds. In essence, these are considered the lowest tier of “safe” bonds before moving into the more speculative “junk” bond category.
The chartered financial analyst (CFA) charter is a globally-recognized professional designation offered by the CFA Institute, an organization that measures and certifies the competence and integrity of financial analysts.
Non-investment-grade debt securities (high-yield/junk bonds) may be subject to greater market fluctuations, risk of default or loss of income.
The Russell 1000 Value Index tracks companies with lower price-to-book ratios and lower expected and historical growth rates. Russell’s value indexes focus more on dividend yield.
The Russell 2000 Index measures the performance of the 2000 smallest U.S. companies based on total market capitalization in the Russell 3000, which represents approximately 10% of Russell 3000 total market capitalization.
The Bloomberg U.S. Corporate High-Yield Index covers the U.S. dollar-denominated, non-investment grade, fixed-rate, taxable corporate bond market. Securities are classified as high-yield if the middle rating of Moody’s, Fitch, and S&P is Ba1/BB+/BB+ or below. The S&P 500 and the Barclays U.S. Aggregate Bond Index are used as supplemental benchmarks.
The Bloomberg US Treasury Index measures US dollar-denominated, fixed-rate, nominal debt issued by the US Treasury. Treasury bills are excluded by the maturity constraint but are part of a separate Short Treasury Index. STRIPS are excluded from the index because their inclusion would result in double-counting. The US Treasury Index is a component of the US Aggregate, US Universal, Global Aggregate and Global Treasury Indices.
The MSCI All Country World ex USA Total Return (MSCI ACWI) is a market capitalization weighted index designed to provide a broad measure of equity-market performance throughout the world. The MSCI ACWI is maintained by Morgan Stanley Capital International and is comprised of stocks from both developed and emerging markets.
ICE BofA US Corporate C Index, a subset of the ICE BofA US High Yield Master II Index, tracks the performance of US dollar denominated below investment grade rated corporate debt publicly issued in the US domestic market. This subset includes all securities with a given investment grade rating CCC or below.
Equity securities are subject to price fluctuation and possible loss of principal. Stock markets tend to move in cycles, with periods of rising prices and periods of falling prices. Certain investment strategies tend to increase the total risk of an investment (relative to the broader market). Strategies that concentrate their investments in limited sectors are more vulnerable to adverse market, economic, regulatory, political, or other developments affecting those sectors.