



Clark Capital’s Bottom-Up, Fundamental Strategies
We continue to see one of the strongest earnings periods in recent history, with S&P profits up 30% in the second quarter, led by Tech’s 58% growth. The results reflect solid revenue that outpaced the economy by 7% and strong operating leverage, driving incremental margins of 38% for the market and 60% for Technology.
Interest rates grabbed the spotlight during the month as the “bond vigilantes” expressed their displeasure. U.S. federal government debt hit $40 trillion, and a wave of corporate bond supply conspired to drive yields higher. The 30-year Treasury yield ended above 5.3%, its highest level since 2007, while the 10-year climbed toward 4.7%, near its highest since early 2025. At Jackson Hole, Chair Warsh flagged that inflation is not slowing and again resisted forward guidance. With three July dissents favoring a hike, investors now see a September move in play, pressuring long-duration equities and the most bond-like income names.
Amidst that backdrop, stocks remain supported by strong earnings with major indices hitting new all-time highs in August. Leadership remains in mega-cap value as growth undergoes a correction. The Russell 1000 Value Index advanced and again outpaced growth during the month.
Below are strategy updates from August:
Navigator® All Cap Core U.S. Equity
- The portfolio is fully invested with ~66.4% in large-cap stocks and the remainder in mid-/ small-cap companies and cash.
- The portfolio continues to balance portfolio holdings between dominant large-cap growth companies and those anti-fragile large-, small- and mid-cap companies that continue to see strong business momentum.
- The three largest portfolio sectors at the end of the period were Information Technology, Financials, and Communication Services.
- Our current weighting in the “Big Six” free cash flow margin monopolies is 30.9% vs. approximately 28.2% in the Russell 3000.
- Information Technology remains the largest sector weight in the strategy at 34.8%, a slight underweight to the Russell 3000 benchmark.
- The three most recent additions to the portfolio were a U.S. cloud-based customer relationship management (CRM) software company, a U.S. biotechnology company, and a U.S. brokerage and financial services firm.
- The three most recent exits were a U.S. maker of security/inspection systems plus healthcare and optoelectronics products, a U.S. power generation and energy company, and a U.S. bank holding company.
Navigator® High Dividend Equity
- The portfolio is fully invested with ~84.9% of the portfolio in large-cap stocks and the balance in mid-/small-cap companies and cash.
- The United States is the largest country weight at 94.9%, followed by the United Kingdom at 2.4% and Switzerland at 1.4%.
- Approximately 98.7% of total holdings are in developed countries.
- Information Technology is the largest sector exposure at 19%, slightly below the benchmark weight. The next three largest portfolio weights are Financials, Health Care, and Industrials at 18.9%, 13.4%, and 11.3%, respectively.
- The three most recent additions to the portfolio were a U.S. cloud-based customer relationship management (CRM) software company, a U.S. auto insurance company, and a U.S. packaged foods company.
- The three most recent exits were a U.S. media and entertainment conglomerate, a U.S. fast-food restaurant chain, and a U.S. manufacturer of paints, coatings, and specialty materials.
Navigator® Large Cap Growth
- The portfolio is fully invested with ~88.2% of the portfolio in large-cap stocks and the balance in mid-cap stocks and cash.
- Approximately 98.9% of total holdings are in developed countries with approximately 92.7% based in the United States.
- Over 73% of portfolio holdings are derived from the 100 largest cash flow producing companies with high and growing cash flows, high cash flow margins, and increasing sales.
- The three largest portfolio sectors at the end of the period were Information Technology, Communication Services, and Industrials.
- Our current weighting in the “Big Six” free cash flow margin monopolies is 41.3% vs. approximately 43% in the Russell 1000 Growth.
- Albeit underweight to the benchmark, Information Technology remains the largest sector weight in the strategy at 53.5%.
- The two most recent additions to the portfolio were a U.S. semiconductor manufacturer and an e-commerce and cloud computing company.
- The most recent exit was a European semiconductor manufacturer.
Navigator® International Equity ADR
- The portfolio is positioned with ~16% in emerging/frontier markets with the balance in developed economies and cash.
- Japan, Switzerland, United Kingdom, and Spain are the strategy’s largest country weights, all ranging between 8% and 13%.
- The three largest portfolio sectors at the end of the period were Financials, Information Technology, and Industrials.
- The three most recent additions to the portfolio were a German operator of stock exchanges and financial market infrastructure, a Singapore-based banking and financial services group, and a German telecommunications company.
- Recent exits include a Pan-Asian life insurance and financial services group, a cruise line operator, and a British-Swedish pharmaceutical company.
Navigator® Small Cap Core U.S. Equity
- The portfolio remains fully invested with ~88.9% of the portfolio in small-cap stocks with the balance in mid-/large-cap stocks and cash.
- The portfolio continues to balance portfolio holdings between anti-fragile small- and mid-cap companies characterized by high cash-flow margins and high cash-flow yields, alongside those companies exhibiting accelerating business momentum.
- The three largest portfolio sectors at the end of the period were Health Care, Information Technology, and Industrials.
- The two most recent additions to the portfolio were a manufacturer of industrial batteries and energy storage solutions and a U.S. REIT focused on shopping center properties.
- The three most recent exits were a U.S. REIT specializing in gas station and convenience-store real estate, a U.S. maker of security/inspection systems plus healthcare and optoelectronics products, and a U.S. manufacturer of recreational powerboats.
Navigator® SMID Cap Core U.S. Equity
- The portfolio remains fully invested with ~68.8% of the portfolio in small-cap stocks, ~28.2% in mid-cap stocks, and the balance in large-cap stocks and cash.
- The portfolio continues to balance portfolio holdings between anti-fragile small and mid-cap companies characterized by high cash-flow margins and high cash-flow yields, alongside those companies exhibiting accelerating business momentum.
- The three largest portfolio sectors at the end of the period were Information Technology, Industrials, and Financials.
- The most recent addition to the portfolio was a U.S. REIT focused on shopping center properties.
- Recent exits include a U.S. REIT specializing in gas station and convenience-store real estate, a U.S. maker of security/inspection systems plus healthcare and optoelectronics products, and a U.S. biotechnology company focused on treatments for rare diseases.
Navigator® Taxable Fixed Income
- Within the portfolio, the focus remained consistent with previous months, keeping duration longer than the index. However, the shift has been to invest proceeds from maturing and shorter bonds into the 3-5 year portion of the yield curve.
- In the banking sector, short bonds were sold to raise cash and reinvest in other names. Not only did these trades increase the overall yield, they also reduced the purchase price.
- The shift toward investing in slightly shorter bonds follows the strategy of staying overweight duration while reducing the additional interest rate risk and still increasing overall yields and reducing the purchase price.
Navigator® Tax-Free Fixed Income
- A close look at curve behavior highlights a definitive divergence between muni and Treasury curves versus a challenging rate environment. Muni curves steepened while their Treasury equivalent flattened.
- This steepening detracted from our overall performance as it pushed the long end of our barbell wider, but munis 5s10s, 5s15s, and 5s20s are all behind their one-year average slopes now.
- Further, the high yields associated with the intermediate maturities as well as the cautiously curated holdings of well-structured bonds we have accumulated compel us to stay steadfast in the barbell trade until clearer signs lead us to re-evaluate our current investing strategy.
Clark Capital’s Top-Down, Quantitative Strategies
For a slow summer month, a lot happened in the markets in August. The month was dominated by several big macro events, including Fed Chair Warsh’s first Jackson Hole address, stellar corporate earnings announcements, continued tensions in Iran with rising oil prices, higher yields, new highs in major stock indices, and a supportive credit backdrop. Fed Chair Warsh was much more hawkish than expected in his Jackson Hole speech, reaffirming the Fed’s 2.0% inflation target, stating that short-term rates remain the Fed’s primary policy tool and that financial conditions are not too tight. Those comments pushed September rate-hike odds to approximately 60%. Yields rose and broke out to new highs while the curve flattened, with 2-year yields rising more than 10-year yields. 30-year yields hit 5.31%, their highest level in over 19 years.
Meanwhile, earnings and credit provide a supportive backdrop for the market. 88% of the S&P 500 companies reported second quarter earnings that beat estimates and credit spreads are hovering near multi-decade lows. As such, most of our tactical strategies maintain their risk-on positioning.
With summer almost over, attention now shifts to the September FOMC meeting and midterm elections. A bit of volatility would be normal, but as we see it, investors are still too pessimistic in sentiment surveys, and we would use any weakness as a buying opportunity.
Below are strategy updates from August:
Navigator® Alternative
- Managed futures and long-short equity have led the mutual fund core, while multi-strategy and event-driven have trailed.
- On the commodity front, we reduced a position in agriculturals and continue to minimize
precious metals. - Positions in infrastructure and retail have been weak. In general, we may reduce beta to manage risk in the coming weeks.
Navigator® Fixed Income Total Return (MultiStrategy Fixed Income)
- High yield has continued its historical pattern of outperforming during periods of rising rates. The 10-Year Treasury yield has risen 80 basis points (bps) since February 27, from under 4% to 4.8%.
- Over that time, high yield is up 1.5% while Treasuries have fallen 3.8%. Meanwhile, cash has been strongest, gaining 1.8%.
- Our models continue to strongly favor high yield. Cash would be our defensive vehicle if conditions worsen but the horizon still gives the “all clear.”
Navigator® Global Risk Management
- This quarter, 85.4% of S&P 500 companies have beaten estimates, and nine of the eleven S&P 500 sectors are producing sales growth ahead of the S&P 500’s long-term average of 6.8%.
- In the long run, such stellar growth will undergo mean reversion, and the coming few years will put stocks and investors to the test.
- Our credit models continue to signal a green light, but rising interest rates mean bonds are slowly becoming a more appealing and lower risk alternative.
Navigator® Global Tactical
- Since the portfolio turned bullish on May 5, 2025, the S&P 500 is up 37.2% and small caps have gained 42.1%.
- Year to date, international stocks have outperformed the S&P 500, gaining 19.5% versus 12.3%.
- Participation has been broad among both sectors and countries. Our credit models continue to be robust, and our models do not see any stressors or irritants on the horizon.
Navigator® U.S. Sector Opportunity
- Since the portfolio turned bullish on May 5, 2025, the S&P 500 is up 37.2% and small caps have gained 42.1%.
- Year to date, international stocks have outperformed the S&P 500, gaining 19.5% versus 12.3%.
- Participation has been broad among both sectors and countries. Our credit models continue to be robust, and our models do not see any stressors or irritants on the horizon.
Navigator® U.S. Style Opportunity (MultiStrategy Equity)
- The portfolio continues to favor large-cap value and quality, while technology-driven growth is least favored.
- Rising interest rates have forced us to sell small caps, and we moved those proceeds into a very large 70% position in the S&P 500.
- While value, driven by Energy and Financials, is most favored, Tech performance has stabilized, with cybersecurity and software looking stellar, while semiconductors are laggards.
Navigator® U.S. Strategic Beta
- In early June, the portfolio reduced its exposure to growth and became neutral with regard to growth vs. value. Since then, value has performed well, driven by Financials and Energy.
- We expect our next move will be to become more defensive, as turbulence around the midterm elections should cause volatility, but so far sentiment and technical conditions do not support more defensiveness.
Disclosures
The views expressed are those of the author(s) and do not necessarily reflect the views of Clark Capital Management Group. The opinions referenced are as of the date of publication and are subject to change due to changes in the market or economic conditions and may not necessarily come to pass. There is no guarantee of the future performance of any Clark Capital investments portfolio. Material presented has been derived from sources considered to be reliable, but the accuracy and completeness cannot be guaranteed. Nothing herein should be construed as a solicitation, recommendation or an offer to buy, sell or hold any securities, other investments or to adopt any investment strategy or strategies. For educational use only. This information is not intended to serve as investment advice. This material is not intended to be relied upon as a forecast or research. The investment or strategy discussed may not be suitable for all investors. Investors must make their own decisions based on their specific investment objectives and financial circumstances. Past performance does not guarantee future results. All investing involves risk, including the loss of principal, and there can be no guarantee investment objectives will be met.
Clark Capital Management Group (Clark) is an investment adviser registered with the U.S. Securities and Exchange Commission. Registration does not imply a certain level of skill or training. More information about Clark’s investment advisory services can be found in its Form ADV Part 2 and/or Form CRS, which are available upon request.
Fixed income securities are subject to certain risks including, but not limited to: interest rate (changes in interest rates may cause a decline in market value of an investment), credit, payment, call (some bonds allow the issuer to call a bond for redemption before it matures), and extension (principal repayments may not occur as quickly as anticipated, causing the expected maturity of a security
to increase).
Foreign securities are more volatile, harder to price and less liquid than U.S. securities. They are subject to different accounting and regulatory standards and political and economic risks. These risks are enhanced in emerging market countries.
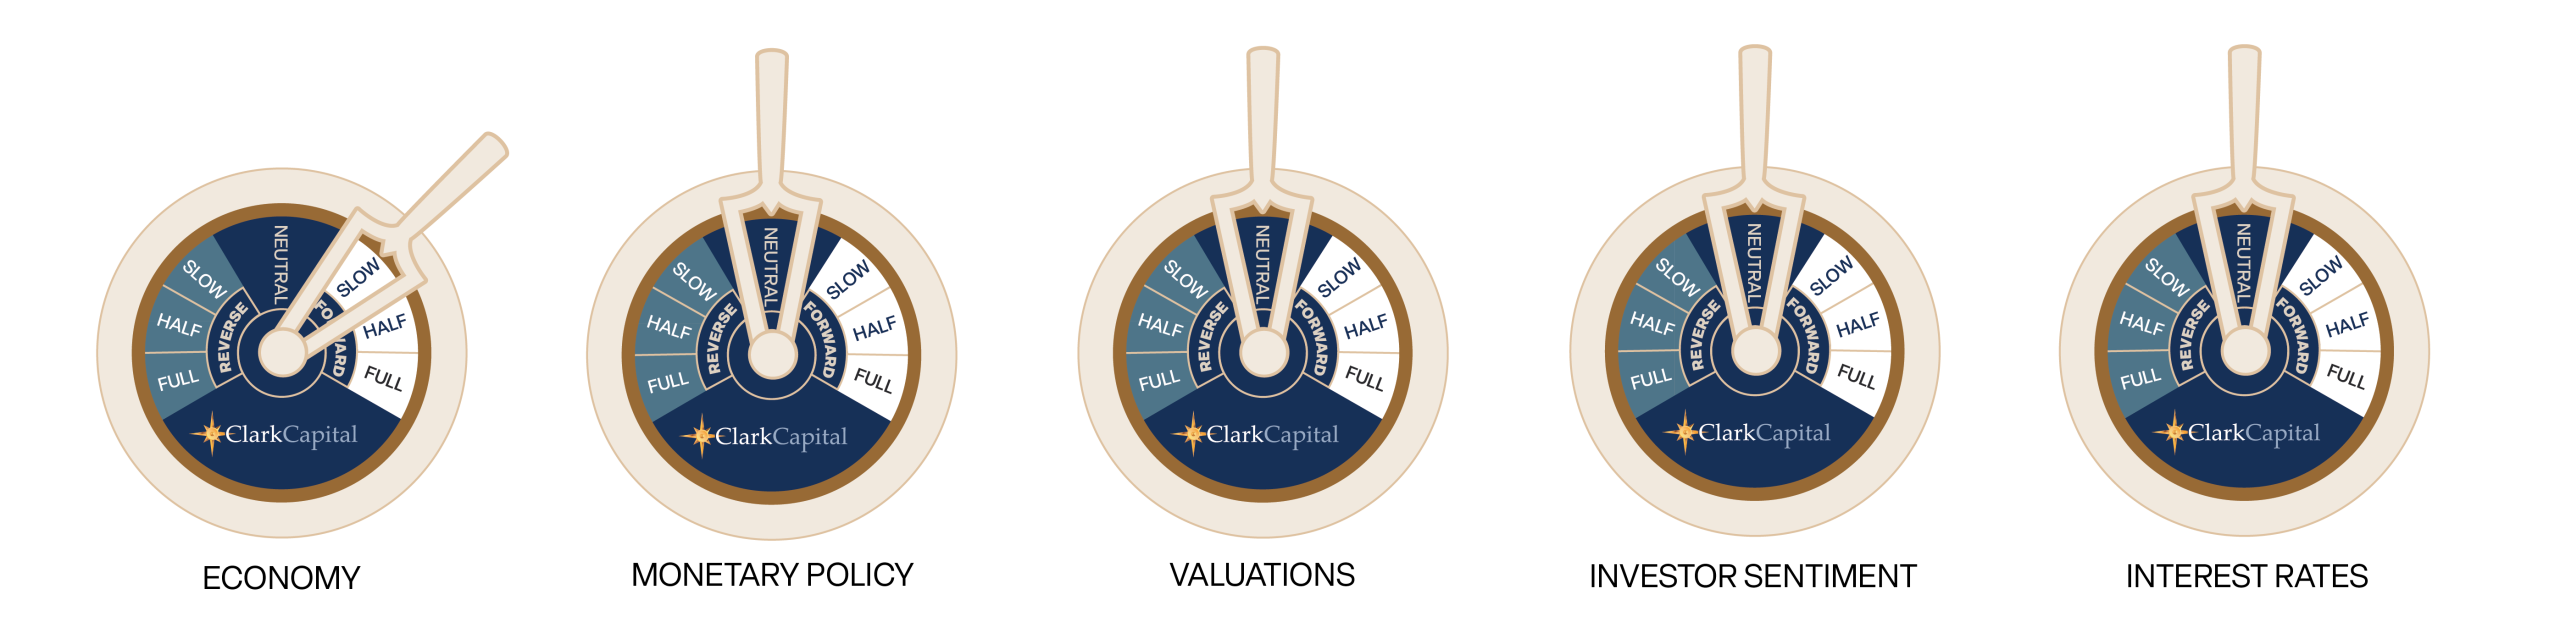
The “Economic Gauges” represent the firm’s expectations for the market, and how changes in the market will affect the strategy, but are only projections which assume certain economic conditions and industry developments and are subject to change without notice. For educational use only.
The NASDAQ Composite is a stock market index of the common stocks and similar securities listed on the NASDAQ stock market.
The Nasdaq 100 Index is a basket of the 100 largest, most actively traded U.S companies listed on the Nasdaq stock exchange. The index includes companies from various industries except for the financial industry, like commercial and investment banks.
The Dow Jones Industrial Average® (The Dow®), is a price-weighted measure of 30 U.S. blue-chip companies. The index covers all industries except transportation and utilities.
The S&P 500® Equal Weight Index (EWI) is the equal-weight version of the widely-used S&P 500. The index includes the same constituents as the capitalization weighted S&P 500, but each company in the S&P 500 EWI is allocated a fixed weight or 0.2% of the index total at each quarterly rebalance.
The S&P 500 measures the performance of the 500 leading companies in leading industries of the U.S. economy, capturing 75% of U.S. equities.
A 10-year Treasury note is a debt obligation issued by the U.S. Treasury Department that has a maturity of 10 years.
Treasury yield is the return on investment, expressed as a percentage, on the U.S. government’s debt obligations. Looked at another way, the Treasury yield is the effective interest rate that the U.S. government pays to borrow money for different lengths of time.
The chartered financial analyst (CFA) charter is a globally-recognized professional designation offered by the CFA Institute, an organization that measures and certifies the competence and integrity of financial analysts.
Non-investment-grade debt securities (high-yield/junk bonds) may be subject to greater market fluctuations, risk of default or loss of income.
The Russell 1000 Value Index tracks companies with lower price-to-book ratios and lower expected and historical growth rates. Russell’s value indexes focus more on dividend yield.
Russell 1000 Growth Index tracks companies with higher price-to-book ratios, higher sales per share growth, and higher I/B/E/S forecast growth.
The Russell 2000 Index measures the performance of the 2000 smallest U.S. companies based on total market capitalization in the Russell 3000, which represents approximately 10% of Russell 3000 total market capitalization.
The Russell 3000 Index measures the performance of the 3,000 largest U.S. companies based on total market capitalization, which represents approximately 98% of the investable U.S. equity market.
Equity securities are subject to price fluctuation and possible loss of principal. Stock markets tend to move in cycles, with periods of rising prices and periods of falling prices. Certain investment strategies tend to increase the total risk of an investment (relative to the broader market). Strategies that concentrate their investments in limited sectors are more vulnerable to adverse market, economic, regulatory, political, or other developments affecting those sectors.