



Clark Capital’s Bottom-Up, Fundamental Strategies
Investor attention shifted from AI demand toward the sustainability of returns on the trillions being committed to AI infrastructure, while concerns over memory pricing, excess compute capacity, and growing Chinese competition weighed heavily on sentiment. Major market indices reflected this rotation as well. The Nasdaq declined 3.2% and the S&P 500 slipped 0.1%, while the Dow Jones Industrial Average gained 0.3% and the Russell 2000 advanced 3.1%. Notably, the equal-weight S&P 500 outperformed its capitalization-weighted counterpart, further supporting the long-anticipated broadening of market leadership beyond a handful of mega-cap AI beneficiaries.
The fixed income market in July was driven by the Federal Reserve’s July meeting and renewed geopolitical tensions that pressured both interest rates and risk assets throughout the month. As expected, the Federal Reserve left interest rates unchanged. Chair Kevin Warsh once again emphasized that inflation remains above the Committee’s long-term target and that monetary policy will remain restrictive until additional progress is achieved.
Below are strategy updates from July:
Navigator® All Cap Core U.S. Equity
- The portfolio remains fully invested, with approximately 61.9% allocated to large-cap companies and the balance invested in mid- and small-cap companies and cash.
- The portfolio continues to balance exposure between dominant large-cap growth franchises and anti-fragile large-, mid-, and small-cap companies demonstrating strong business momentum.
- The largest sector exposures at month-end were Information Technology, Financials, and Industrials.
- Our allocation to the “Big Six” free cash flow margin monopolies is 30.2%, compared with approximately 28.1% in the Russell 3000.
- Information Technology remains the largest sector exposure at 33.5%, representing a modest underweight relative to the benchmark.
- Recent additions include a health insurer and healthcare services company, a memory and storage chip manufacturer, and a large U.S. steel producer.
- We exited a health insurer, a gold mining company, and an oil and gas exploration and production company.
Navigator® High Dividend Equity
- The portfolio is fully invested with approximately 87.2% of the portfolio in large-cap stocks and the balance in mid-/small-cap companies and cash.
- The United States is the largest country weight at 94.6%, followed by the United Kingdom at 2.6% and Switzerland at 1.5%.
- Approximately 98.7% of total holdings are in developed countries.
- Financials are the largest sector weight at 18.8%, slightly below the benchmark weight. The next three largest portfolio weights are Information Technology, Health Care, and Consumer Discretionary at 17.7%, 13%, and 11.5%, respectively.
- The three most recent additions to the portfolio were a healthcare company that makes medical devices, diagnostics, and nutrition products, a payroll processing and human resources management services company, and a pharmaceutical company known for immunology drugs.
- The three most recent exits were a manufacturer of paints, coatings, and specialty materials, an oilfield services company supporting energy exploration and production, and an energy technology company.
Navigator® Large Cap Growth
- The portfolio remains fully invested, with approximately 85.9% of assets in large-cap companies, with the balance invested in mid-cap companies and cash.
- Approximately 99% of holdings are domiciled in developed markets, with 91.7% based in the United States.
- More than 70% of portfolio holdings are derived from the 100 largest cash flow producing companies, characterized by high and growing cash flows, strong cash flow margins, and increasing sales.
- The largest sector exposures at month end were Information Technology, Communication Services, and Industrials.
- Our allocation to the “Big Six” free cash flow margin monopolies is 40.4%, compared with approximately 43.1% in the Russell 1000 Growth.
- Information Technology remains the largest sector exposure at 51.6%, although modestly underweight relative to the benchmark.
- Recent additions include a manufacturer of engines and power generation systems, a cybersecurity company, and a semiconductor company. We exited a power generation company.
Navigator® International Equity ADR
- The portfolio is positioned with approximately 17% in emerging and frontier markets, with the balance invested in developed markets and cash.
- The portfolio’s largest country exposures are the United Kingdom, Japan, Canada, and Switzerland, each representing between 9% and 14% of assets.
- The largest sector exposures at month end were Information Technology, Financials, and Industrials.
- We added a Swiss pharmaceutical company, a South Korean memory chip manufacturer, and a Swiss luxury goods conglomerate.
- We exited a maker of computer peripherals and accessories, a South African gold mining company, and a global oilfield services company.
Navigator® Small Cap Core U.S. Equity
- The portfolio remains fully invested, with approximately 88.8% of assets in small-cap companies, with the balance invested in mid- and large-cap companies and cash.
- The portfolio continues to balance anti-fragile small- and mid-cap businesses characterized by high cash flow margins and attractive cash flow yields with companies demonstrating accelerating business momentum.
- The largest sector exposures at month end were Health Care, Industrials, and Information Technology.
- Recent additions include a regional bank holding company, a healthcare services holding company, and a trucking and freight transportation company.
- We exited a specialty minerals and materials producer, a semiconductor maker specializing in RF chips for mobile devices, and a manufacturer of components for RVs and manufactured housing.
Navigator® SMID Cap Core U.S. Equity
- The portfolio remains fully invested, with approximately 64.5% in small-cap companies, 32.8% in mid-cap companies, and the balance in large-cap companies and cash.
- The strategy continues to balance anti-fragile small- and mid-cap businesses characterized by high cash flow margins and attractive cash flow yields with companies exhibiting accelerating business momentum.
- The largest sector exposures at month end were Industrials, Information Technology, and Financials.
- Recent additions include a trucking and freight transportation company, a medical device maker, and a petroleum refining company.
- Recent exits include a semiconductor maker specializing in RF chips for mobile devices and a manufacturer of components for RVs and manufactured housing.
Navigator® Taxable Fixed Income
- Within the portfolio, the focus remained consistent with previous months, keeping duration longer than the index and moving proceeds from maturing and shorter bonds into the 5-year and longer portion of the yield curve.
- Several bonds were sold and rotated into longer maturities adding yield while maintaining the portfolio’s higher-quality bias.
- This strategy of maximizing yield and extending duration will continue as long as interest rates remain elevated.
Navigator® Tax-Free Fixed Income
- We finally have some positive slope at the front end of the muni curve, driven by developments in the broader fixed income markets along with the comments from the Federal Reserve. These developments merit a focus on our barbell trade, as our trade path may be reaching fruition.
- Prepaid gas bonds continue to grow as a sector and index member. We continue to find opportunities in guarantors such as a global integrated oil and gas company and even a prominent search, advertising, and cloud computing company, which has backed bonds in California to prepay gas used to power its data centers.
- Sorting through the various issuers requires patience, and in these fringe sectors we can find incremental income and total return.
Clark Capital’s Top-Down, Quantitative Strategies
July continued rotation in the equity market that began several months ago. Technology, AI, and related stocks remained under pressure as the market questioned and tried to absorb the debt issuance of the hyper scalers. The semiconductor index fell by 20% during July, its worst monthly decline since the global financial crisis. Performance was not as bad as that headline, as it is still up 60% year to date. The Nasdaq 100 dropped 6% last month. While technology takes a break, other sectors have picked up the slack. Ultimately the rotation is healthy. The S&P 500 was flat for the month, and is right where it was in mid-May, having traded sideways since, and less than 2% from a new all-time high. Meanwhile, the equal-weighted S&P gained 1% last month and made a new all-time high.
Second quarter corporate earnings season is in full swing, and reported earnings have been spectacular. With 61% of the S&P 500 companies reporting, earnings are up 47.5% and feature an 86% beat rate. Strong earnings, a stable labor market, and solid economic growth underpin a favorable backdrop for risk assets. As such, our tactical models that drive Fixed Income Total Return, Global Risk Management, Global Tactical, and others remain risk-on, and portfolios are allocated accordingly.
Below are strategy updates from July:
Navigator® Alternative
- Managed futures and global long/short equity are top contributors in the mutual fund core, while multi-strategy and options-based are weakest.
- The portfolio has been adding economically sensitive equity risk opportunistically, and we now have positions in retailing, biotech, copper miners, and semiconductors, which we added after the selloff.
- Within fixed income, we favor risky credit with lower duration.
Navigator® Fixed Income Total Return (MultiStrategy Fixed Income)
- The Fed’s July hawkish hold on interest rates was not well received by markets, as 10-year and 30-year yields broke out to new highs.
- However, credit and equity markets absorbed the news unaffected. So far, the higher interest rates do not have bite and high yield spreads remain near historic lows.
- Corporate fundamentals have surged to their strongest point in years, and until that turns, we expect to maintain a risk-on position.
Navigator® Global Risk Management
- Strong corporate balance sheets and earnings momentum continue to form a robust backbone for equity risks.
- Our models see credit strength despite the obstacle of higher interest rates, and they continue to register an “all clear” for owning stocks.
- Second quarter earnings have been very impressive, but investors’ reactions have been muted, with markets roughly flat. Nevertheless, such strong earnings combined with flat prices mean that valuations are improving considerably.
Navigator® Global Tactical
- Our credit-based models have displayed persistent strength despite higher interest rates providing considerable pushback.
- Higher interest rates are pushing bonds to their most attractive levels relative to stocks in many years. Nevertheless, such valuation arguments require fundamental weakness to become actionable.
- Right now, stocks are simply too strong. So far in the second quarter, with 61% of the S&P 500 companies reporting, earnings are up 47.5% and feature an 86% beat rate.
Navigator® U.S. Sector Opportunity
- Health Care and Financials have risen to become our top sector holdings, and both can be seen as cyclical value stocks tied to the economy rather than truly defensive sectors like Staples or Utilities.
- Consumer Discretionary is the most notable rising sector, and we also have established small positions in Real Estate and Energy.
- Technology and Materials were darlings for much of 2026, but they have fallen out of favor and will need to reestablish their relative strength to become candidates for purchase.
Navigator® U.S. Style Opportunity (MultiStrategy Equity)
- While the portfolio favors value stocks, we favor cyclical value over defensive value.
- Mega-cap value, small caps, and quality are our top holdings.
- Large-cap growth has faded in our ranks after a rough June and July, but a bounceback appears likely.
- The question will be what happens when the index reaches prior highs and the old highs become resistance.
Navigator® U.S. Strategic Beta
- The portfolio has recently maintained a roughly neutral stance on equity risk, and that has been rewarded recently given the improvement in performance of value stocks.
- An equity rebound or eventual breakout may provide an opportunity to reduce portfolio risk and become more defensive, particularly if interest rates continue their upward path.
- Sentiment remains supportive of stocks so far.
Disclosures
The views expressed are those of the author(s) and do not necessarily reflect the views of Clark Capital Management Group. The opinions referenced are as of the date of publication and are subject to change due to changes in the market or economic conditions and may not necessarily come to pass. There is no guarantee of the future performance of any Clark Capital investments portfolio. Material presented has been derived from sources considered to be reliable, but the accuracy and completeness cannot be guaranteed. Nothing herein should be construed as a solicitation, recommendation or an offer to buy, sell or hold any securities, other investments or to adopt any investment strategy or strategies. For educational use only. This information is not intended to serve as investment advice. This material is not intended to be relied upon as a forecast or research. The investment or strategy discussed may not be suitable for all investors. Investors must make their own decisions based on their specific investment objectives and financial circumstances. Past performance does not guarantee future results. All investing involves risk, including the loss of principal, and there can be no guarantee investment objectives will be met.
Clark Capital Management Group (Clark) is an investment adviser registered with the U.S. Securities and Exchange Commission. Registration does not imply a certain level of skill or training. More information about Clark’s investment advisory services can be found in its Form ADV Part 2 and/or Form CRS, which are available upon request.
Fixed income securities are subject to certain risks including, but not limited to: interest rate (changes in interest rates may cause a decline in market value of an investment), credit, payment, call (some bonds allow the issuer to call a bond for redemption before it matures), and extension (principal repayments may not occur as quickly as anticipated, causing the expected maturity of a security
to increase).
Foreign securities are more volatile, harder to price and less liquid than U.S. securities. They are subject to different accounting and regulatory standards and political and economic risks. These risks are enhanced in emerging market countries.
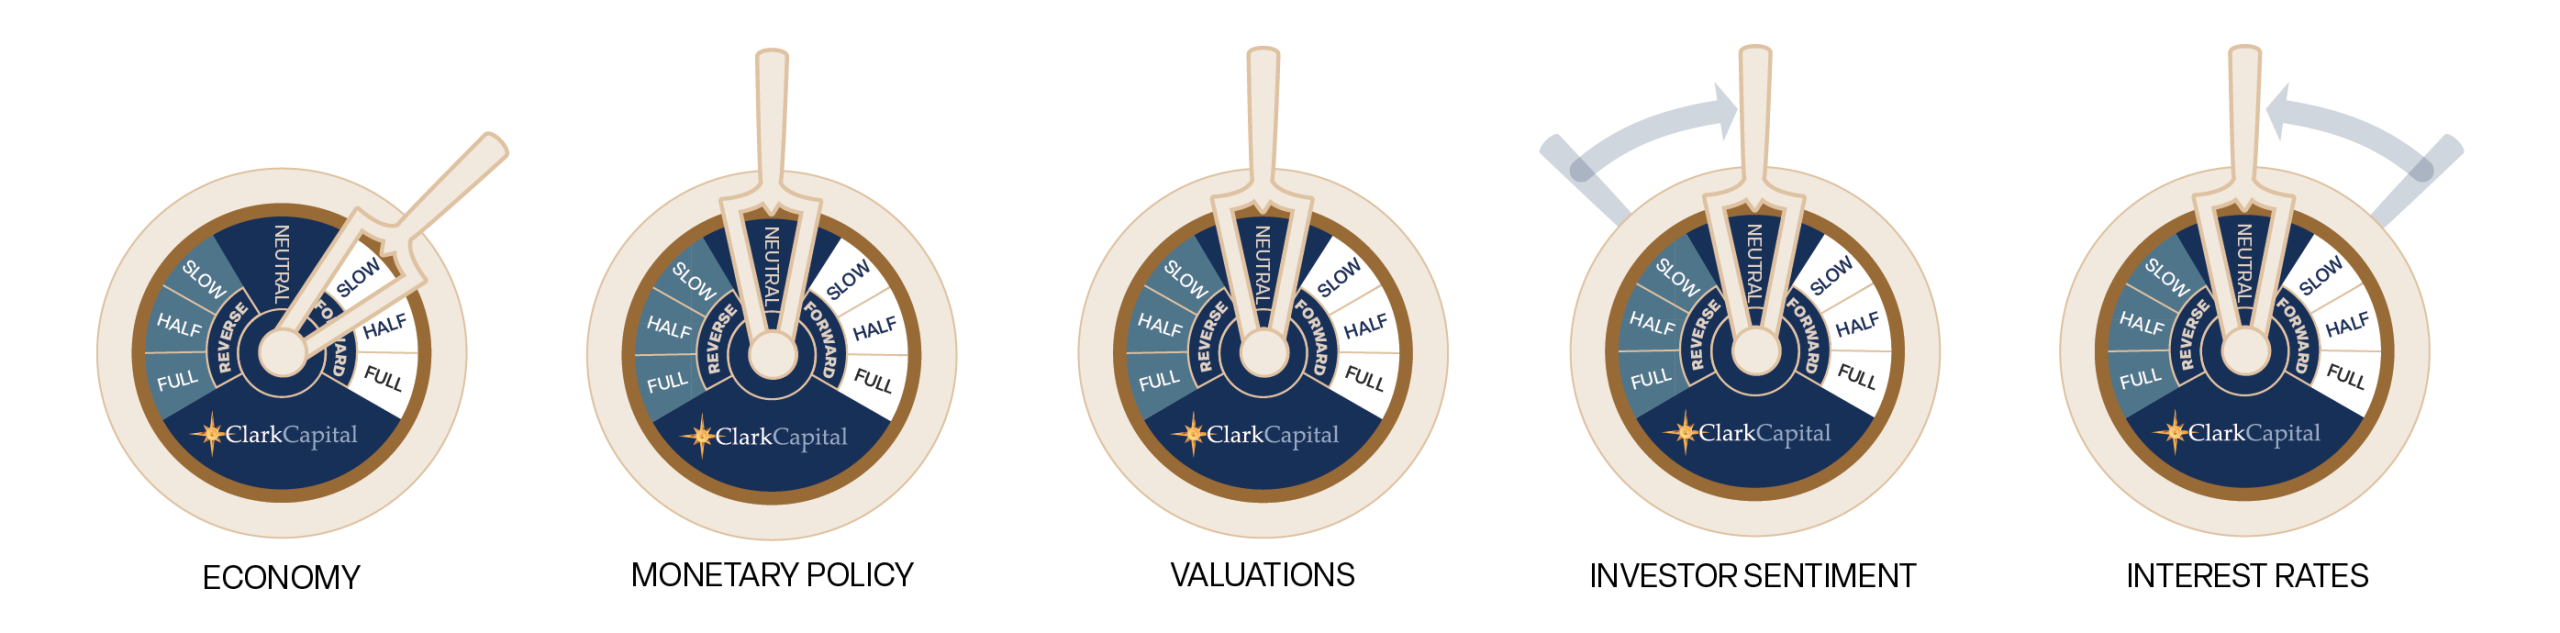
The “Economic Gauges” represent the firm’s expectations for the market, and how changes in the market will affect the strategy, but are only projections which assume certain economic conditions and industry developments and are subject to change without notice. For educational use only.
The NASDAQ Composite is a stock market index of the common stocks and similar securities listed on the NASDAQ stock market.
The Nasdaq 100 Index is a basket of the 100 largest, most actively traded U.S companies listed on the Nasdaq stock exchange. The index includes companies from various industries except for the financial industry, like commercial and investment banks.
The Dow Jones Industrial Average® (The Dow®), is a price-weighted measure of 30 U.S. blue-chip companies. The index covers all industries except transportation and utilities.
The S&P 500® Equal Weight Index (EWI) is the equal-weight version of the widely-used S&P 500. The index includes the same constituents as the capitalization weighted S&P 500, but each company in the S&P 500 EWI is allocated a fixed weight or 0.2% of the index total at each quarterly rebalance.
The S&P 500 measures the performance of the 500 leading companies in leading industries of the U.S. economy, capturing 75% of U.S. equities.
A 10-year Treasury note is a debt obligation issued by the U.S. Treasury Department that has a maturity of 10 years.
Treasury yield is the return on investment, expressed as a percentage, on the U.S. government’s debt obligations. Looked at another way, the Treasury yield is the effective interest rate that the U.S. government pays to borrow money for different lengths of time.
The chartered financial analyst (CFA) charter is a globally-recognized professional designation offered by the CFA Institute, an organization that measures and certifies the competence and integrity of financial analysts.
Non-investment-grade debt securities (high-yield/junk bonds) may be subject to greater market fluctuations, risk of default or loss of income.
The Russell 1000 Value Index tracks companies with lower price-to-book ratios and lower expected and historical growth rates. Russell’s value indexes focus more on dividend yield.
Russell 1000 Growth Index tracks companies with higher price-to-book ratios, higher sales per share growth, and higher I/B/E/S forecast growth.
The Russell 2000 Index measures the performance of the 2000 smallest U.S. companies based on total market capitalization in the Russell 3000, which represents approximately 10% of Russell 3000 total market capitalization.
The Russell 3000 Index measures the performance of the 3,000 largest U.S. companies based on total market capitalization, which represents approximately 98% of the investable U.S. equity market.
Equity securities are subject to price fluctuation and possible loss of principal. Stock markets tend to move in cycles, with periods of rising prices and periods of falling prices. Certain investment strategies tend to increase the total risk of an investment (relative to the broader market). Strategies that concentrate their investments in limited sectors are more vulnerable to adverse market, economic, regulatory, political, or other developments affecting those sectors.