

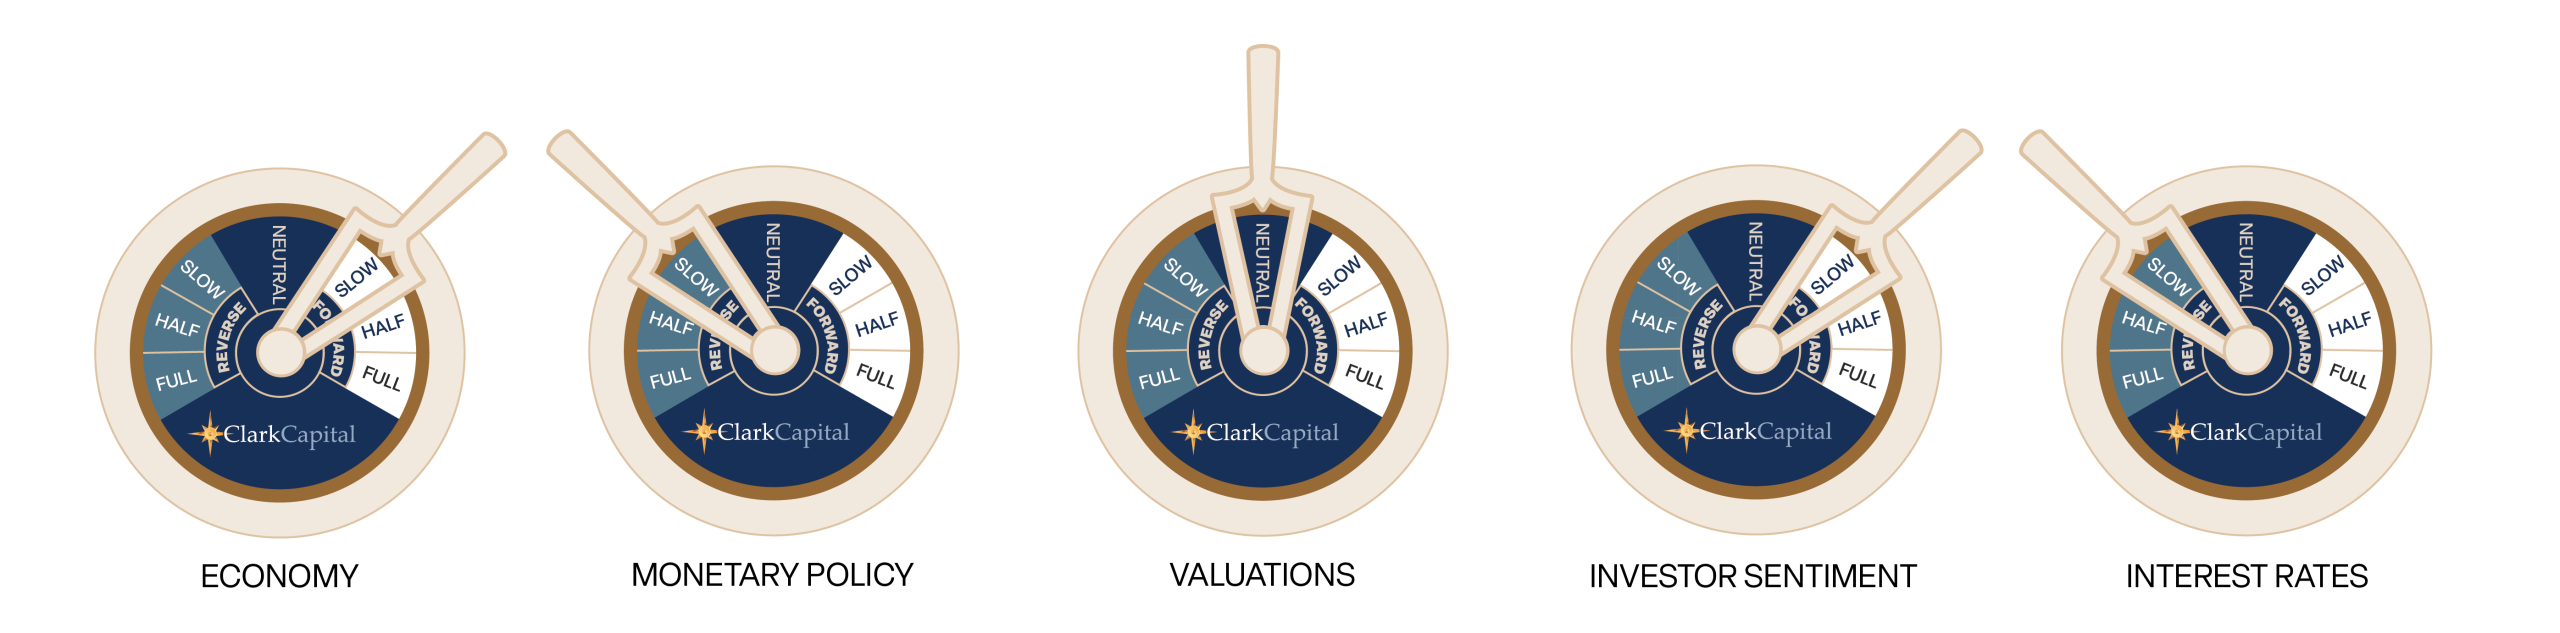
Clark Capital’s Bottom-Up, Fundamental Strategies
October delivered one of the sharpest swings toward value on record. The Russell 1000 Value Index gained 4.4%, while the Russell 1000 Growth Index fell 6.1%. That 10.5-point gap was the widest since February 2001 and the third-largest monthly outperformance since the index began in 1987. Leadership also broadened. The equal-weighted S&P 500 beat its cap-weighted version by 5.9 percentage points, its second-best relative month since its 2003 inception, as investors rotated away from mega-cap technology. The AI trade has become a “show me” story, with the market demanding evidence that heavy spending translates into earnings.
Earnings season kicked off, and results have been strong. Blended S&P 500 third-quarter earnings growth reached 30.2% with 82% of reporters beating earnings per share (EPS) estimates as of October 30, but those companies that missed expectations are being punished. However, new highs in next 12-month estimated earnings continue unabated for the S&P 500, the S&P MidCap 400, and the S&P SmallCap 600 indices. The AI trade shifted in October from a debate over demand to a debate over financing: CoreWeave’s credit stress and Meta’s flagging of potential capital needs in the “hundreds of billions” contributed to an eight-session 15% losing streak in the semiconductor index (SOX).
Below are strategy updates from October:
Navigator® All Cap Core U.S. Equity
- The portfolio is fully invested with ~76.7% in large-cap stocks and the remainder in mid-/small-cap companies and cash.
- The portfolio continues to balance portfolio holdings between dominant large-cap growth companies and those anti-fragile large-, small-, and mid-cap companies that continue to see strong business momentum.
- The three largest portfolio sectors at the end of the period were Information Technology, Financials, and Health Care.
- Our current weighting in the Big Six free-cash-flow-margin monopolies is 29% vs. approximately 27.9% in the Russell 3000. Information Technology remains the largest sector weight in the strategy at 35.1%, a slight overweight to the Russell 3000 benchmark.
- The three most recent additions to the portfolio were a provider of enterprise software and cloud infrastructure, an oil and natural gas producer, and a global asset manager.
- The three most recent exits were a real estate investment trust that owns casino and gaming properties, a diversified regional bank, and a diversified health care company focused on pharmaceuticals and medical devices.
Navigator® High Dividend Equity
- The portfolio is fully invested with ~96.8% of the portfolio in large-cap stocks and the balance in mid-/small-cap companies and cash.
- The United States is the largest country weight at 93.7%, followed by the United Kingdom at 2.3% and Switzerland at 1.5%.
- The portfolio is positioned with approximately 98.7% in developed countries with the remainder in cash.
- Information Technology is the largest sector weight at 21.4% and is slightly above the benchmark weight. The next three largest portfolio weights are Financials, Health Care, and Industrials at 17.8%, 15.1%, and 10.9%, respectively.
- The three most recent additions to the portfolio were a global quick-service restaurant chain, a provider of enterprise software and cloud infrastructure, and a supplier of scientific instruments, reagents, and laboratory services.
- The three most recent exits were an automotive supplier of powertrain and electrification components, a real estate investment trust that owns industrial and logistics properties, and a telecommunications and broadband provider
Navigator® Large Cap Growth
- The portfolio is fully invested with ~96.2% of the portfolio in large-cap stocks and the balance in mid-cap stocks and cash.
- Approximately 98.7% of total holdings are in developed countries with approximately 92.8% based in the United States.
- More than 70% of holdings are derived from the 100 largest cash flow producing companies with high and growing cash flows, high cash flow margins, and increasing sales.
- The three largest portfolio sectors at the end of the period were Information Technology, Communication Services, and Industrials.
- Our current weighting in the Big Six free-cash-flow-margin monopolies is 41.7% vs. approximately 43% in the Russell 1000 Growth. Albeit underweight to the benchmark, Information Technology remains the largest sector weight in the strategy at 53.4%.
- The portfolio had no trades in October.
Navigator® International Equity ADR
- The portfolio is positioned with ~14.8% in emerging markets with the balance in developed economies and cash.
- Japan, Switzerland, Canada, and Germany are the strategy’s largest country weights, all ranging between 8% and 16%.
- The three largest portfolio sectors at the end of the period were Financials, Information Technology, and Industrials.
- The three most recent additions to the portfolio were a Hong Kong-based life insurer, a Chinese e-commerce and cloud computing company, and a Bermuda-based provider of specialty insurance, reinsurance, and mortgage insurance.
- Recent exits include a South Korean banking and financial services company, a Chinese automaker, and a Swiss food and beverage company.
Navigator® Small Cap Core U.S. Equity
- The portfolio remains fully invested with ~61.6% of the portfolio in small-cap stocks with the balance in mid-/large-cap stocks and cash.
- The portfolio continues to balance portfolio holdings between anti-fragile small- and mid-cap companies characterized by high cash-flow margins and high cash-flow yields, alongside those companies exhibiting accelerating business momentum.
- The three largest portfolio sectors at the end of the period were Health Care, Information Technology, and Industrials.
- The three most recent additions to the portfolio were a real estate investment trust that owns skilled nursing and senior housing properties, a manager of fertility and family-building benefits for employers, and a maker of solar tracking systems and related equipment.
- The three most recent exits were a real estate investment trust that owns casino and gaming properties, an online grocery delivery and technology platform, and an owner and operator of casino resorts.
Navigator® SMID Cap Core U.S. Equity
- The portfolio remains fully invested with ~42.7% of the portfolio in small-cap stocks, ~39.2% in mid-cap stocks, and the balance in large-cap stocks and cash.
- The portfolio continues to balance portfolio holdings between anti-fragile small- and mid-cap companies characterized by high cash-flow margins and high cash-flow yields, alongside those companies exhibiting accelerating business momentum.
- The three largest portfolio sectors at the end of the period were Information Technology, Financials, and Health Care.
- The most recent additions to the portfolio were a manager of fertility and family-building benefits for employers, a real estate investment trust that owns skilled nursing and senior housing properties, and a provider of health, life, and annuity insurance products.
- Recent exits include an online grocery delivery and technology platform, a real estate investment trust that owns casino and gaming properties, and an automotive supplier of powertrain and electrification components.
Navigator® Taxable Fixed Income
- Within the portfolio, the focus remained consistent with previous months, keeping duration longer than the index while continuing to extend duration slightly.
- We sold shorter bonds and reinvested the proceeds in slightly longer bonds with higher yields.
- These trades increased the overall yield of the portfolio while reducing the average purchase price, improving the total return profile of the holdings.
- This strategy of maximizing yield while maintaining duration longer than the index will continue as long as interest rates remain elevated.
Navigator® Tax-Free Fixed Income
- We see tremendous value in the market, and we are actively searching for opportunities rather than simply building ladders.
- The Bloomberg 5-Year Muni Index returned 3.12% in October, in stark contrast to its September performance. In the broader market, the BAML Muni Master Index returned 3.22%, on pace for a top 14 month on record and the strongest October ever.
- Movements in the shape of the muni curve were not uniform. As buying materializes further and we get into the more fundamentally strong late fall and early winter seasonals, we expect flattening to resume.
Clark Capital’s Top-Down, Quantitative Strategies
October marked a reversal of fortunes for the AI trade and the overall market. A massive rotation out of everything AI, Tech, and AI adjacent occurred, with the broader market being the beneficiary. For example, the S&P 500 lost 0.87% during the month while the equal-weighted S&P 500 gained 5.0%, small-cap stocks were up 0.6%, and large-cap value stocks added 4.38%. On the losing side were large-cap growth, down 6.09%, semiconductors down 17.08%, and the Mag 7 down 4.48%.
After hitting a high of 5.3% for the 10-Year yield in early October, bonds staged a meaningful rally with the 10-Year yield ending the month at 4.03%. 7-10 Year Treasuries gained 3.07%, corporate investment grade rose 1.59%, and high yield eked out a 0.30% gain. The Fed held rates steady at their late-October Federal Open Market Committee (FOMC) meeting, and now the market is pricing in a 75% chance of a hike in December and one hike in 2027.
With the midterm elections, looks like we are in for a split government. An old Wall Street adage is “The market loves gridlock.” No matter the outcome, the market usually does well in the period after the midterm elections. History suggests the market is now entering the strongest seasonal period of the four-year presidential cycle. Since 1950, coming off the October lows in midterm election years, the S&P 500 has risen more than double the non-midterm year average in the following six months. The index has been higher 19 of 19 times, with an average 15.4% gain.
On the strategy front, Fixed Income Total Return, Global Tactical, and related strategies have had several reallocations after a long stint in risk-on. At the end of September, these strategies went to 100% cash equivalents, and then on October 23, they assumed a 50/50 balanced mix of risk-on and Treasuries.
Below are strategy updates from October:
Navigator® Alternative
- Event-driven and options-based strategies led the mutual fund core of the portfolio, while managed futures tailed off.
- Generally, the portfolio has become more cautious in recent weeks, as our models have sold out of crypto for Treasuries and reduced bank loan exposure.
- We maintain some risk-facing positions in Tech and biotech, along with a 5% position in Real Estate.
Navigator® Fixed Income Total Return (MultiStrategy Fixed Income)
- Our credit-based models moved into cash equivalents at the end of September as higher rates began to bite.
- However, that did not last long, as rates eased a bit, and our models turned neutral on October 23. We now own 50% high yield and 50% Treasuries.
- Interest rates have ended their persistent climb, and now our models are more positive toward owning duration.
Navigator® Global Risk Management
- In September, our credit-based models reduced equity exposure after a 16-month holding period since May 2025.
- After briefly moving to cash equivalents, our models returned to a more neutral setting, and on October 23 we established a roughly 50% equities and 50% U.S. Treasuries position.
- Our models continue to give mixed signals, and we are closer to turning defensive than 100% risk-on.
Navigator® Global Tactical
- Our models sold out of equities on September 29; however, the monetary backdrop improved, and on October 23, the portfolio moved from cash equivalents to 50% equities and 50% Treasuries.
- Our models are quite mixed. While we are not too far from becoming defensive, a post-election turnaround matches seasonal patterns.
Navigator® U.S. Sector Opportunity
- Health Care remains our largest sector overweight at 25%, with Energy second at 18%.
- While the AI trade has weakened, other areas of Tech like software, cloud, and cybersecurity remain strong.
- Staples and retail are on the rise, while Industrials and Communication Services rank lowest.
Navigator® U.S. Style Opportunity (MultiStrategy Equity)
- Our models have favored large-cap stocks overall, with value and growth alternating leadership over time.
- While October was tough for tech and AI names, market breadth improved, and investors rewarded value.
- Our models are shifting slightly toward favoring value stocks, with the quality factor now finding life and a spot in our rankings matrix.
Navigator® U.S. Strategic Beta
- The portfolio maintains a moderate risk-facing position, with a target beta of roughly one.
- Strong performance from our large-cap value ETF was offset by a large-cap growth ETF, as the Tech and AI trades faced headwinds.
- Nevertheless, we are noting that valuations in large-cap growth have become quite reasonable and should offer opportunities looking forward.
Disclosures
The views expressed are those of the author(s) and do not necessarily reflect the views of Clark Capital Management Group. The opinions referenced are as of the date of publication and are subject to change due to changes in the market or economic conditions and may not necessarily come to pass. There is no guarantee of the future performance of any Clark Capital investments portfolio. Material presented has been derived from sources considered to be reliable, but the accuracy and completeness cannot be guaranteed. Nothing herein should be construed as a solicitation, recommendation or an offer to buy, sell or hold any securities, other investments or to adopt any investment strategy or strategies. For educational use only. This information is not intended to serve as investment advice. This material is not intended to be relied upon as a forecast or research. The investment or strategy discussed may not be suitable for all investors. Investors must make their own decisions based on their specific investment objectives and financial circumstances. Past performance does not guarantee future results. All investing involves risk, including the loss of principal, and there can be no guarantee investment objectives will be met.
Clark Capital Management Group (Clark) is an investment adviser registered with the U.S. Securities and Exchange Commission. Registration does not imply a certain level of skill or training. More information about Clark’s investment advisory services can be found in its Form ADV Part 2 and/or Form CRS, which are available upon request.
Fixed income securities are subject to certain risks including, but not limited to: interest rate (changes in interest rates may cause a decline in market value of an investment), credit, payment, call (some bonds allow the issuer to call a bond for redemption before it matures), and extension (principal repayments may not occur as quickly as anticipated, causing the expected maturity of a security
to increase).
Foreign securities are more volatile, harder to price and less liquid than U.S. securities. They are subject to different accounting and regulatory standards and political and economic risks. These risks are enhanced in emerging market countries.
The “Economic Gauges” represent the firm’s expectations for the market, and how changes in the market will affect the strategy, but are only projections which assume certain economic conditions and industry developments and are subject to change without notice. For educational use only.
The NASDAQ Composite is a stock market index of the common stocks and similar securities listed on the NASDAQ stock market.
The Nasdaq 100 Index is a basket of the 100 largest, most actively traded U.S companies listed on the Nasdaq stock exchange. The index includes companies from various industries except for the financial industry, like commercial and investment banks.
The Dow Jones Industrial Average® (The Dow®), is a price-weighted measure of 30 U.S. blue-chip companies. The index covers all industries except transportation and utilities.
The S&P 500® Equal Weight Index (EWI) is the equal-weight version of the widely-used S&P 500. The index includes the same constituents as the capitalization weighted S&P 500, but each company in the S&P 500 EWI is allocated a fixed weight or 0.2% of the index total at each quarterly rebalance.
The S&P 500 measures the performance of the 500 leading companies in leading industries of the U.S. economy, capturing 75% of U.S. equities.
A 10-year Treasury note is a debt obligation issued by the U.S. Treasury Department that has a maturity of 10 years.
Treasury yield is the return on investment, expressed as a percentage, on the U.S. government’s debt obligations. Looked at another way, the Treasury yield is the effective interest rate that the U.S. government pays to borrow money for different lengths of time.
The chartered financial analyst (CFA) charter is a globally-recognized professional designation offered by the CFA Institute, an organization that measures and certifies the competence and integrity of financial analysts.
Non-investment-grade debt securities (high-yield/junk bonds) may be subject to greater market fluctuations, risk of default or loss of income.
The Russell 1000 Value Index tracks companies with lower price-to-book ratios and lower expected and historical growth rates. Russell’s value indexes focus more on dividend yield.
Russell 1000 Growth Index tracks companies with higher price-to-book ratios, higher sales per share growth, and higher I/B/E/S forecast growth.
The Russell 2000 Index measures the performance of the 2000 smallest U.S. companies based on total market capitalization in the Russell 3000, which represents approximately 10% of Russell 3000 total market capitalization.
The Russell 3000 Index measures the performance of the 3,000 largest U.S. companies based on total market capitalization, which represents approximately 98% of the investable U.S. equity market.
Equity securities are subject to price fluctuation and possible loss of principal. Stock markets tend to move in cycles, with periods of rising prices and periods of falling prices. Certain investment strategies tend to increase the total risk of an investment (relative to the broader market). Strategies that concentrate their investments in limited sectors are more vulnerable to adverse market, economic, regulatory, political, or other developments affecting those sectors.