



Clark Capital’s Bottom-Up, Fundamental Strategies
The defining developments during September were another synchronized backup in global bond yields and the Federal Reserve’s first rate hike since July 2023. Interest rates rose approximately 0.50% across the U.S. Treasury curve from 2 years, 5 years, and 10 years pushing broad equity indices down, while large-cap indices demonstrated notable resilience. Large-cap growth equities advanced 2.16%, carried by semiconductors and a handful of mega-cap AI leaders. That performance masked significant damage beneath the surface.
Breadth told a very different story as roughly three-quarters of S&P 500 constituents declined, the equal-weight S&P 500 fell 5.2%, and the more fragile Russell 2000 dropped 5.40%. On the fixed income side, the rise in rates negatively impacted short-term performance. The increase in yields also created more attractive opportunities to reinvest proceeds at yields not available in several years.
Hopefully, the Fed will remain patient with monetary policy tightening. It will need to weigh inflation expectations that have stayed stable, are less sensitive to supply shocks, and are slowly declining toward the Fed’s 2% target, against the risk of resurgent wage growth, given stronger-than-expected August payroll gains and persistently low unemployment claims.
Below are strategy updates from September:
Navigator® All Cap Core U.S. Equity
- The portfolio is fully invested with ~65.2% in large-cap stocks and the remainder in mid-/small-cap companies and cash.
- The portfolio continues to balance portfolio holdings between dominant large-cap growth companies and those anti-fragile large-, small- and mid-cap companies that continue to see strong business momentum.
- The three largest portfolio sectors at the end of the period were Information Technology, Financials, and Communication Services.
- Our current weighting in the Big Six free cash flow margin monopolies is 32.1% vs. approximately 29.5% in the Russell 3000. Information Technology remains the largest sector weight in the strategy at 36.1%, a slight underweight to the Russell 3000 benchmark.
- The three most recent additions to the portfolio were a payments technology company, a semiconductor company making processors and graphics chips, and a beverage company.
- The three most recent exits were a utility and renewable energy company, a membership-based warehouse retailer, and a logistics and freight transportation company.
Navigator® High Dividend Equity
- The portfolio is fully invested with ~85.3% of the portfolio in large-cap stocks and the balance in mid-/small-cap companies and cash.
- The United States is the largest country weight at 94.1%, followed by the United Kingdom at 2.5% and Switzerland at 1.4%.
- The portfolio is positioned with approximately 98% in developed countries with the remainder in cash.
- Approximately 85.3% of the portfolio is large cap with the remainder in mid cap and cash.
- Information Technology is the largest sector weight at 21.2%, slightly above the benchmark weight. The next three largest portfolio weights are Financials, Health Care, and Industrials at 18%, 13.4%, and 10.9%, respectively.
- The two most recent additions to the portfolio were a semiconductor and telecommunications equipment company and a banking and financial services company. The two most recent exits were a power generation and utility company and a home improvement retailer.
Navigator® Large Cap Growth
- The portfolio is fully invested with ~90% of the portfolio in large-cap stocks and the balance in mid-/small-cap stocks and cash.
- Approximately 98.8% of total holdings are in developed countries with approximately92.7% based in the United States.
- Over 70% of portfolio holdings are derived from the 100 largest cash flow producing companies with high and growing cash flows, high cash flow margins, and increasing sales.
- The three largest portfolio sectors at the end of the period were Information Technology, Communication Services, and Industrials.
- Our current weighting in the Big Six free cash flow margin monopolies is 42.2% vs. approximately 44% in the Russell 1000 Growth Index. Albeit underweight to the benchmark, Information Technology remains the largest sector weight in the strategy at 55.2%.
- The most recent addition was an aerospace and defense company. The most recent exits were an energy drink and beverage company and a power generation company.
Navigator® International Equity ADR
- The portfolio is positioned with ~16.4% in emerging / frontier markets with the balance in developed economies and cash.
- Japan, Spain, United Kingdom, and Switzerland are the strategy’s largest country weights, all ranging between 8% and 16%.
- The three largest portfolio sectors at the end of the period were Information Technology, Financials, and Industrials.
- The three most recent additions to the portfolio were a Japanese athletic footwear and apparel maker, a Japanese materials and chemical manufacturer, and a Brazilian financial services and investment platform.
- Recent exits include a global agribusiness and food processing company, a Latin American airline holding company, and a building materials company.
Navigator® Small Cap Core U.S. Equity
- The portfolio remains fully invested with ~89.3% of the portfolio in small-cap stocks with the balance in mid-/large-cap stocks and cash.
- The portfolio continues to balance portfolio holdings between anti-fragile small- and mid-cap companies characterized by high cash-flow margins and high cash-flow yields, alongside those companies exhibiting accelerating business momentum.
- The three largest portfolio sectors at the end of the period were Information Technology, Health Care, and Industrials.
- The most recent addition was a REIT focused on gaming and casino properties.
- The three most recent exits were a REIT that owns and leases single-tenant commercial properties, a renewable energy company, and a medical device company.
Navigator® SMID Cap Core U.S. Equity
- The portfolio remains fully invested with ~70.1% of the portfolio in small-cap stocks, ~25.5% in mid-cap stocks, and the balance in large-cap stocks and cash.
- The portfolio continues to balance portfolio holdings between anti-fragile small- and mid-cap companies characterized by high cash-flow margins and high cash-flow yields, alongside those companies exhibiting accelerating business momentum.
- The three largest portfolio sectors at the end of the period were Information Technology, Industrials, and Financials.
- The most recent additions to the portfolio were a content delivery network and cybersecurity company, a REIT focused on gaming and casino properties, and a packaged food company.
- Recent exits include a renewable energy company, a power generation company, and a medical device company.
Navigator® Taxable Fixed Income
- Within the portfolio, the focus remained consistent with previous months, keeping duration longer than the index.
- Maturing bonds and bonds with less than two years to maturity were sold and proceeds were reinvested in the 3-5 year portion of the yield curve.
- The portfolio will continue to maintain duration longer than the index, but the focus for new purchases remains in the 3-5 year portion of the curve, where higher yields and lower dollar prices provide attractive opportunities without adding significant interest rate risk.
Navigator® Tax-Free Fixed Income
- While 5s/10s steepening hurt our performance in August, we still advocated for flattening, and despite an overall rate increase, the curve came our way: 5s/10s peaked early in the month at 53 basis points (bps) and closed the month at 40 bps. Often, it is the most basic strategies that provide alpha in munis. This move was far faster than we predicted, so we will monitor it closely.
- If the Fed is not set to move further, the curve could steepen, or compelling rates could keep attention on the long end and create further flattening.
- We have discussed the Ides of Fall in the past, where heavy supply and low organic demand create opportunities, and we feel there will be continued opportunity in munis.
- We also stand on our observation that over 20 years the longer end tends to perform better in the later term of the fourth quarter, and investors are often mistaken that staying short is the better move.
Clark Capital’s Top-Down, Quantitative Strategies
The market digested a lot of macroeconomic headlines in the third quarter, which led to a very divergent landscape of asset class performance. The dominant factors affecting the markets during the quarter were the sharp rise in interest rates, the Federal Reserve hiking rates for the first time since July 2023, higher energy prices as negotiations in the Middle East have proven unfruitful, robust corporate earnings, and a surprisingly resilient economy.
The Federal Reserve lifted overnight rates by 0.25% to a range of 3.75% to 4% on September 16. The healthy labor market has allowed the Fed to focus squarely on bringing inflation back to target. Fed Chair Warsh previously noted that inflation has been “too high … for too long.” After the hike, the Fed’s statement said, “Today’s policy action will support a timelier return to the committee’s 2% goal.” The hawkish tone from the Fed now has the bond vigilantes out in force, and the market pricing in an additional three rate hikes over the next 12 months.
Our tactical models that drive the allocations for Fixed Income Total Return, Global Tactical, Global Risk Management, and U.S. Tactical Allocation shifted from risk-off at the end of September as credit deteriorated with rising rates. As a result, those strategies derisked into the safety of cash equivalents.
Below are strategy updates from September:
Navigator® Alternative
- In the mutual fund core allocations, the portfolio reduced its managed futures exposure slightly, taking profits on commodity and short-rates trades in the space. In doing so, we added back to multi-strategy funds.
- The portfolio sold its agriculture exposure, and continues its focus on Technology, semiconductors, and copper miners and has added duration as interest rates have spiked higher.
Navigator® Fixed Income Total Return (MultiStrategy Fixed Income)
- On September 29, the portfolio sold out of high yield and moved into cash as rising interest rates began to bite, ending an extended 16-month period owning high yield.
- While credit has weakened and spreads have widened, this can almost entirely be attributed to rising rates. Broadly, the economy and labor markets are stable.
- While the underlying economic fundamentals appear solid, monetary conditions have become hostile, and our models are responding and favoring capital preservation in these uncertain times.
Navigator® Global Risk Management
- Rising interest rates and falling bonds caused our models to favor cash over equities and U.S. Treasuries.
- On September 29, the portfolio sold equities and moved mostly to cash, with only small equity and U.S. Treasury positions remaining.
- Markets have now priced in three-and-a-half Fed rate hikes, and, as a result, the monetary environment could become an obstacle to market gains.
Navigator® Global Tactical
- Our credit-based models turned cautious on September 29. As a result, the portfolio sold out of its equity holdings and moved into cash equivalents.
- Hostile monetary conditions drove the defensive move, as higher interest rates began to be reflected in credit weakness.
- Underlying corporate fundamentals appear to be hanging in there, but our models are stating that rising interest rates have become a headwind.
Navigator® U.S. Sector Opportunity
- Technology has become the portfolio’s most favored sector at a 42% weight; AI, software, cybersecurity, broad Technology, and cloud computing are featured ETFs. Health Care and Energy stand out as the only other favored sectors.
- The bigger story has been tremendous weakness in the Consumer Discretionary sector,mwhich has been slammed by higher energy prices and rising interest rates.
- Industrials, Utilities, and recently Financials have faded and are to be avoided.
Navigator® U.S. Style Opportunity (MultiStrategy Equity)
- The portfolio had favored mega-cap value for many months, but in September large growth began to rise in our rankings, and now mega-cap growth has followed.
- AI relative strength has resumed, and beyond Tech, few sectors provide leadership.
- Mid- and small-cap stocks have now fallen to the bottom of our matrix. We now own twice as much large growth as large value, and we maintain a very large, indexed position.
Navigator® U.S. Strategic Beta
- The portfolio remains largely neutral regarding growth vs. value.
- Despite rising interest rates creating havoc in fixed income markets, equities have not yet displayed defensive sector leadership.
- As a result, the portfolio will maintain a neutral stance on beta, and we await further indications if the higher interest rates we see today will affect future earnings expectations.
Disclosures
The views expressed are those of the author(s) and do not necessarily reflect the views of Clark Capital Management Group. The opinions referenced are as of the date of publication and are subject to change due to changes in the market or economic conditions and may not necessarily come to pass. There is no guarantee of the future performance of any Clark Capital investments portfolio. Material presented has been derived from sources considered to be reliable, but the accuracy and completeness cannot be guaranteed. Nothing herein should be construed as a solicitation, recommendation or an offer to buy, sell or hold any securities, other investments or to adopt any investment strategy or strategies. For educational use only. This information is not intended to serve as investment advice. This material is not intended to be relied upon as a forecast or research. The investment or strategy discussed may not be suitable for all investors. Investors must make their own decisions based on their specific investment objectives and financial circumstances. Past performance does not guarantee future results. All investing involves risk, including the loss of principal, and there can be no guarantee investment objectives will be met.
Clark Capital Management Group (Clark) is an investment adviser registered with the U.S. Securities and Exchange Commission. Registration does not imply a certain level of skill or training. More information about Clark’s investment advisory services can be found in its Form ADV Part 2 and/or Form CRS, which are available upon request.
Fixed income securities are subject to certain risks including, but not limited to: interest rate (changes in interest rates may cause a decline in market value of an investment), credit, payment, call (some bonds allow the issuer to call a bond for redemption before it matures), and extension (principal repayments may not occur as quickly as anticipated, causing the expected maturity of a security
to increase).
Foreign securities are more volatile, harder to price and less liquid than U.S. securities. They are subject to different accounting and regulatory standards and political and economic risks. These risks are enhanced in emerging market countries.
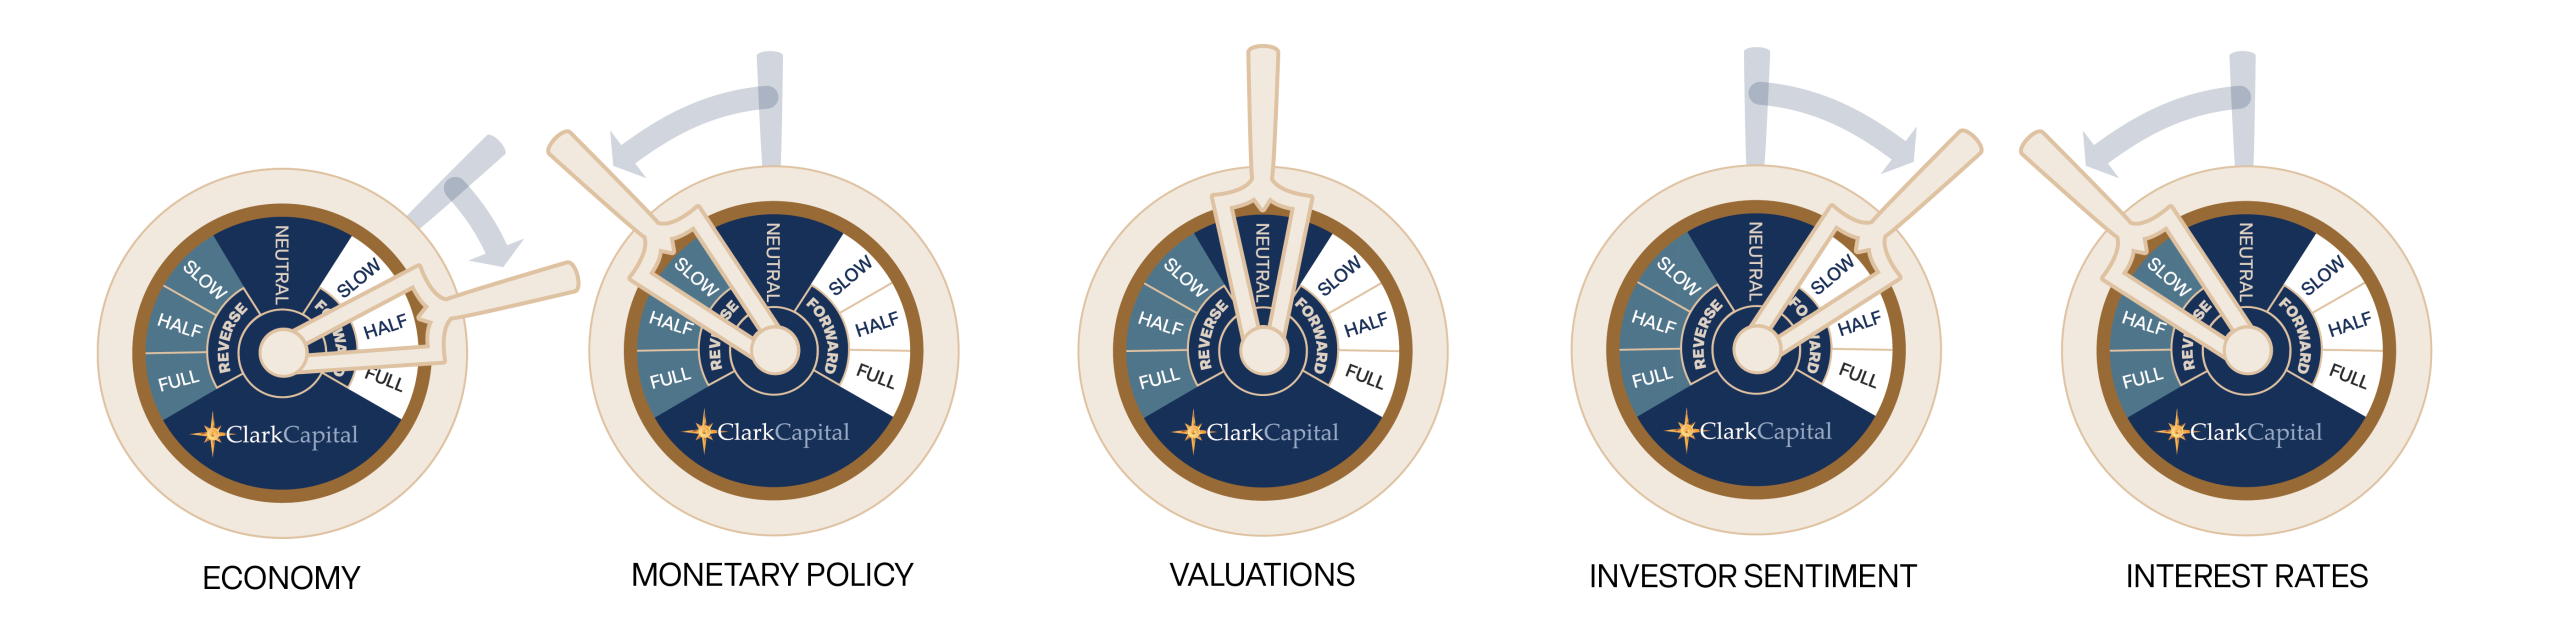
The “Economic Gauges” represent the firm’s expectations for the market, and how changes in the market will affect the strategy, but are only projections which assume certain economic conditions and industry developments and are subject to change without notice. For educational use only.
The NASDAQ Composite is a stock market index of the common stocks and similar securities listed on the NASDAQ stock market.
The Nasdaq 100 Index is a basket of the 100 largest, most actively traded U.S companies listed on the Nasdaq stock exchange. The index includes companies from various industries except for the financial industry, like commercial and investment banks.
The Dow Jones Industrial Average® (The Dow®), is a price-weighted measure of 30 U.S. blue-chip companies. The index covers all industries except transportation and utilities.
The S&P 500® Equal Weight Index (EWI) is the equal-weight version of the widely-used S&P 500. The index includes the same constituents as the capitalization weighted S&P 500, but each company in the S&P 500 EWI is allocated a fixed weight or 0.2% of the index total at each quarterly rebalance.
The S&P 500 measures the performance of the 500 leading companies in leading industries of the U.S. economy, capturing 75% of U.S. equities.
A 10-year Treasury note is a debt obligation issued by the U.S. Treasury Department that has a maturity of 10 years.
Treasury yield is the return on investment, expressed as a percentage, on the U.S. government’s debt obligations. Looked at another way, the Treasury yield is the effective interest rate that the U.S. government pays to borrow money for different lengths of time.
The chartered financial analyst (CFA) charter is a globally-recognized professional designation offered by the CFA Institute, an organization that measures and certifies the competence and integrity of financial analysts.
Non-investment-grade debt securities (high-yield/junk bonds) may be subject to greater market fluctuations, risk of default or loss of income.
The Russell 1000 Value Index tracks companies with lower price-to-book ratios and lower expected and historical growth rates. Russell’s value indexes focus more on dividend yield.
Russell 1000 Growth Index tracks companies with higher price-to-book ratios, higher sales per share growth, and higher I/B/E/S forecast growth.
The Russell 2000 Index measures the performance of the 2000 smallest U.S. companies based on total market capitalization in the Russell 3000, which represents approximately 10% of Russell 3000 total market capitalization.
The Russell 3000 Index measures the performance of the 3,000 largest U.S. companies based on total market capitalization, which represents approximately 98% of the investable U.S. equity market.
Equity securities are subject to price fluctuation and possible loss of principal. Stock markets tend to move in cycles, with periods of rising prices and periods of falling prices. Certain investment strategies tend to increase the total risk of an investment (relative to the broader market). Strategies that concentrate their investments in limited sectors are more vulnerable to adverse market, economic, regulatory, political, or other developments affecting those sectors.